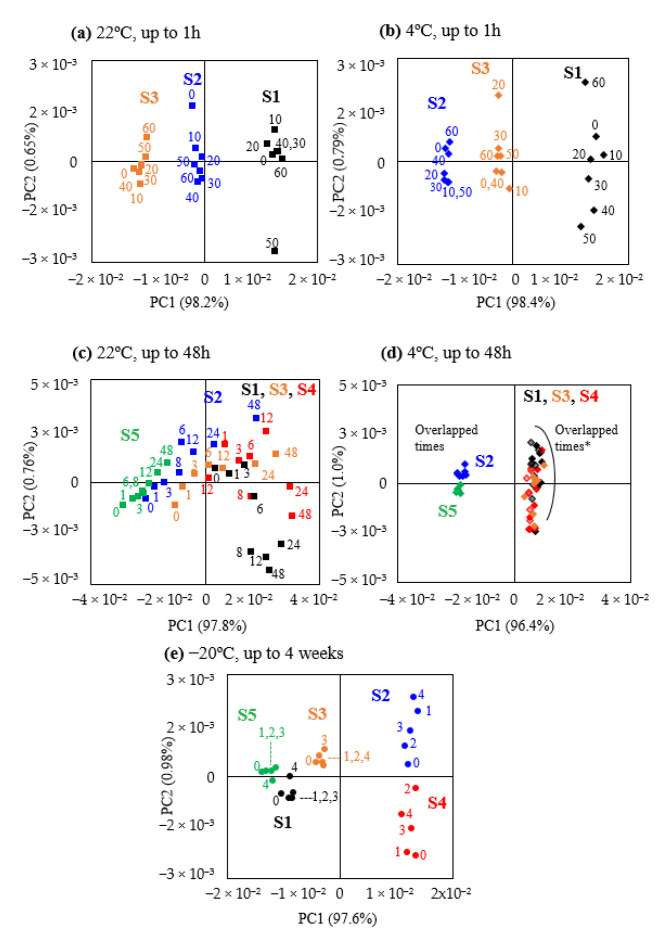
Figure 2.
PCA scores plots for storage stability up to 1 h at (a) 22 °C and (b) 4 °C (numbers indicate minutes); up to 48 h at (c) 22 °C and (d) 4 °C (numbers indicate hours), *: group includes collections in different days for subjects 1 and 4 (darker/lighter symbols); (e) up to 4 weeks at −20 °C (numbers indicate weeks). Different individuals are represented by different colors: subject S1—black, subject S2—blue, subject S3—orange, subject S4—red, subject S5—green. Symbol shapes represent storage temperatures: 22 °C, ■; 4 °C, ♦; −20 °C, ●.

