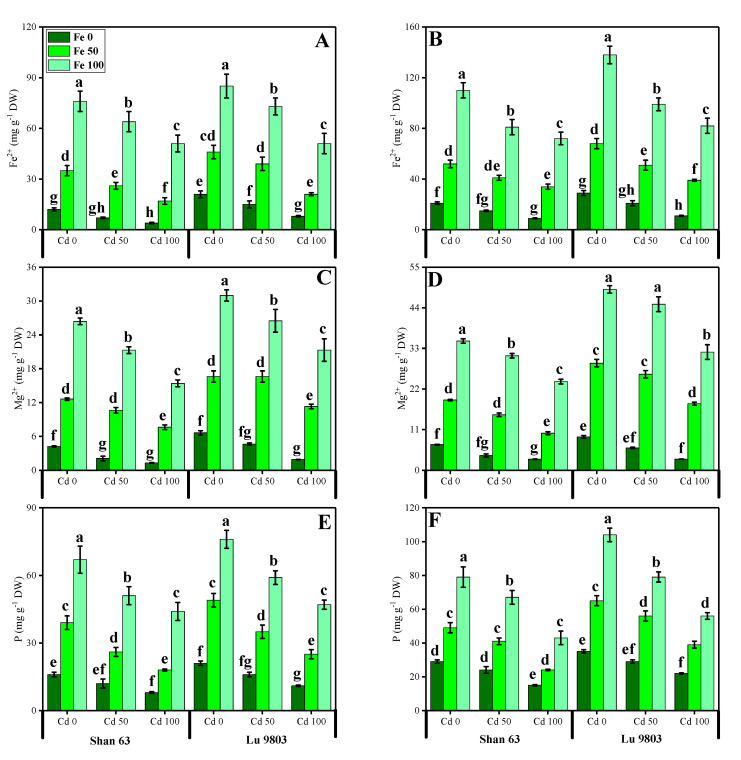
Figure 6.
Effect of different concentrations of exogenous application of FeSO4 (0, 50, and 100 µM) on ion uptake, i.e., iron contents in the roots (E), iron contents in the shoots (F), calcium contents in the roots (G), and calcium contents in the leaves (H), magnesium contents in the roots (A), magnesium contents in the shoots (B), phosphorus contents in the roots (C) and phosphorus contents in the shoots (D) of Oryza sativa (cultivars) grown under different levels of Cd stress (0, 50 and 100 µM). Bars sharing different letter(s) for each parameter are significantly different from each other according to Duncan’s multiple range test (p < 0.05). All the data represented are the average of four replications (n = 4). Error bars represent the standard deviation (SD) of four replicates.

