Abstract
Background
Hepatocellular carcinoma (HCC) is one of the most common human malignant tumors. The prognosis of HCC patients is still unsatisfying. In this study, we performed the integrated bioinformatics analysis to identify potential biomarkers and biological pathways in HCC.
Methods
Gene expression profiles were obtained from the Gene Expression Omnibus database (GSE55048, GSE55758, and GSE56545) for the screening of the common differentially expressed genes (DEGs) between HCC tissues and matched non-tumor tissues. DEGs were subjected to Gene Ontology, KEGG pathway, and Reactome pathway analysis. The hub genes were identified by using protein–protein interaction (PPI) network analysis. The hub genes in HCC were further subjected to overall survival analysis of HCC patients. The hub genes were further validated by in vitro functional assays.
Results
A total of 544 common differentially expressed genes were screened from three datasets. Gene Ontology, KEGG and Reactome analysis results showed that DEGs are significantly associated with the biological process of cell cycle, cell division, and DNA replication. PPI network analysis identified 20 hub genes from the DEGs. These hub genes except CENPE were all significantly up-regulated in the HCC tissues when compared to non-tumor tissues. The Kaplan–Meier survival analysis results showed that the high expression of the 20 hub genes was associated with shorter survival of the HCC patients. Further validation studies showed that knockdown of KIF14 and KIF23 both suppressed the proliferative potential, increased the caspase-3/-7 activity, up-regulated Bax expression, and promoted the invasive and migratory abilities in the HCC cells. In addition, knockdown of KIF14 and KIF23 enhanced chemosensitivity to cisplatin and sorafenib in the HCC cells. Finally, the high expression of KIF14 and KIF23 was associated with shorter progression-free survival, recurrence-free survival, and disease-specific survival of patients with HCC.
Conclusion
In conclusion, the present study performed the integrated bioinformatics analysis and showed that KIF14 and KIF23 silence attenuated cell proliferation, invasion, and migration, and promoted chemosensitivity of HCC cells. KIF14 and KIF23 may serve as potential biomarkers for predicting the worse prognosis of patients with HCC.
Keywords: hepatocellular carcinoma, differentially expressed genes, hub genes, KIF14, KIF23, survival analysis
Introduction
Hepatocellular carcinoma (HCC) is one of the most common human malignancies and is the second leading cause of cancer-related deaths,1 and nearly 50% of the new cases were diagnosed in China.2 The high incidence of HCC in China has been suggested to be associated with Hepatitis B virus infection in the Chinese populations.2 The prognosis of the HCC patients is relatively poor, due to the insufficient tools for the early diagnosis of HCC, and a substantial proportion of HCC patients was diagnosed at a late stage.3 So far, surgical intervention and radio-/chemotherapy were the main strategy for the treatment of HCC. However, the high recurrence of HCC significantly affects the overall survival of HCC patients after the different treatments.3 Therefore, it is urgent for us to further explore the molecular mechanisms underlying the pathophysiology of HCC, which will be of clinical significance to development of novel diagnostic and therapeutic targets for the management of HCC.
Recently, the high throughput techniques have been intensively applied in the field of cancer research, and microarray analysis and RNA-seq techniques have been able to generate a large amount of datasets.4 With the aid of integrated bioinformatics analysis, a large number of novel genes have been identified in various types of cancers.5 However, the public available datasets including microarray data and RNA-seq data are still not fully explored by the researchers, and the re-analysis of these datasets will enable us to identify novel genes related to the disease of interest. For examples, Ma et al6 employed the Gene Expression Omnibus (GEO) database and The Cancer Genome Atlas-Liver Hepatocellular Carcinoma (TCGA-LIHC) for screening differentially expressed genes (DEGs) and identified 11 hub genes associated with HCC progression; Yan et al7 performed the integrated bioinformatics analysis and suggested that MSTO2P has significant diagnostic and prognostic value in HCC; and Xu et al8 analyzed the three datasets from the GEO database and found that ten hub genes were associated with the survival of the HCC patients. Due to the large amounts of the datasets in the public database, more hub genes related to the HCC development and progression are yet to be identified.
In this study, three GEO datasets including GSE55048, GSE55758, and GSE56545 were used to analyze the differentially expressed genes between non-tumor and HCC groups. The common DEGs from these three datasets were subjected to Gene Ontology (GO), KEGG pathway, Reactome pathway, and protein–protein interaction (PPI) network analysis. A total of 20 hub genes were identified based on the PPI network analysis. Furthermore, the hub genes were further analyzed in the TGCA database to determine the association between the expression of these hub genes and overall survival of the HCC patients. Finally, the biological functions of the potential hub genes were validated by the in vitro functional assays. The integrated bioinformatics analysis of the three GEO datasets may provide us with novel insights into understanding the pathophysiology of HCC.
Materials and Methods
Collection of Microarray Data
The microarray data was downloaded from the GEO database (http://www.ncbi.nlm.nih.gov/geo/) under the accession number GSE55048, GSE55758, and GSE56545. For the GSE55048 dataset, the GPL9115 Illumina Genome Analyzer II platform was used, and a total of four human HCC tissues and four matched non-tumor tissues were included in this dataset; for the GSE55758 dataset, the GPL9052 Illumina Genome Analyzer platform was used, and a total of eight human HCC tissues and eight matched non-tumor tissues were included in this dataset; for the GSE56545 dataset, a total of 12 human HCC tissues and 12 matched non-tumor tissues were included in this dataset. The details of three included datasets are summarized in Table 1.
Table 1.
Details of the Analyzed GEO Datasets
| GEO Datasets | Platform | Samples (Tumor versus Normal) | HBV-Positive | Tumor Information | Country |
|---|---|---|---|---|---|
| GSE55048 | GPL9115 Illumina Genome Analyzer II platform | 4 versus 4 | 4 out of 4 patients | Not applicable | China |
| GSE55758 | GPL9052 Illumina Genome Analyzer | 8 versus 8 | 7 out of 8 patients | All patients had a single tumor and most of the primary tumors (5 of 8) had moderately differentiated histology; 6 of 8 had stage II tumor | China |
| GSE56545 | GPL15433 Illumina HiSeq 1000 | 12 versus 12 | 12 out of 12 patients | All the patients were male; 3 patients had stage I tumor; 2 patients had stage I–II tumor; 4 patients had stage II tumor; 3 patients had tumor II–III tumor | USA |
Data Reprocessing and DEG Screening
Geo RNA-seq experiments Interactive Navigator (GREIN; http://www.ilincs.org/apps/grein/) was used to retrieve the expression datasets between non-tumor group and HCC group for the GSE55048, GSE55758, and GSE56545 datasets. The DEGs were analyzed using the iGEAK tool based on edgeR. Principle component analysis (PCA) analysis, clustering heatmap plot, volcano plot, and Venn diagram were processed by iGEAK tool. The common DEGs were then exported into excel for further analysis.
Functional Analysis of DEGs
The ClusterProfiler tool was used to perform Gene Ontology (GO), GO enrichment, KEGG pathway, and Reactome pathway enrichment analysis for the DEGs. GO enrichment analysis including biological processes, cellular components, and molecular function, identified which GO terms were over or underrepresented within a given set of genes.9 The KEGG knowledge database, an integrated database resource, is generally used to identify functional and metabolic pathways.9
PPI Network Analysis
The Search Tool for the Retrieval of Interacting Genes (STRING)10 is a biological database for predicting pairs of PPIs. The interactions between DEGs were evaluated using STRING and genes with a combined score >0.7 were defined as key DEGs. Subsequently, Cytoscape (version 3.6.1; https://cytoscape.org/)11 was used to develop the PPI network of the key DEGs that were identified. Molecular complex detection (MCODE),12 a Cytoscape plugin, was used with the default parameters to identify the most important modules of the PPI network.
Analysis of Hub Gene Expression Level
In this study, the Gene Expression Profiling Interactive Analysis (GEPIA) database was sued to visualize the expression of 20 hub genes by using the boxplot. The protein levels of hub genes were analyzed using the Human Protein Atlas database (https://www.proteinatlas.org/). P<0.05 was considered statistically significant.
Survival Analysis
Survival analysis of the DEGs was performed by using the Gene Expression Profiling Interactive Analysis (GEPIA) database13 and the Kaplan–Meier (KM) plotter database.14 The Kaplan–Meier curves were plotted in the GEPIA database including 364 HCC patients. P<0.05 was considered statistically significant.
Cell Lines, Cell Culture, Transfection with Small Interfering RNAs, and Drug Treatment
LO2, HepG2, SMMC7221, and HCC-LM3 cells were obtained from the Cell Bank of Shanghai Institutes for Biological Sciences, Chinese Academy of Sciences (Shanghai, China). The cells were cultured in the DMEM medium (Thermo Fisher Scientific, Waltham, USA) supplemented with fetal bovine serum (FBS; Thermo Fisher Scientific) and were kept in a humidified incubator at 37°C with 5% CO2. The KIF14 and KIF23 siRNAs (si-KIF14 and siKIF-23) and the scrambled control siRNA (si-NC) were obtained from RiboBio (Guangzhou, China). SMMC7721 and HCC-LM3 cells were transfected with siRNAs using Lipofectamine 2000 reagent (Invitrogen, Carlsbad, CA, USA). At 24 hours after transfection, cells were processed for further experimental assays. The cisplatin and sorafenib were purchased from the Sigma (St. Louis, MO, USA). For the cisplatin and sorafenib treatments, the cells were exposed to different concentrations of cisplatin or sorafenib for 48 hours before further experimental assays.
RNA Isolation and RT-qPCR
The extraction of RNA was performed using the MiniBEST Universal RNA extraction kit (TaKaRa, Dalian, China). A total of 2 μg RNA was reversely transcribed into cDNA using the PrimeScript 1st strand cDNA Synthesis Kit (Takara). The real-time PCR was performed on Applied Biosystems (Applied Biosystems, Foster City, CA, China) using One Step PrimeScript™ RT-PCR Kit (Takara) in accordance with the manufacture’s protocol. GAPDH was used as the reference control for KIF14, KIF23, and Bax expression. The mRNA expression levels were calculated using the 2−ΔΔCt method.
Cell Counting Kit-8 (CCK-8) Assay
Cell proliferative ability was measured by the CCK-8 kit (Beyotime, Beijing, China). Briefly, SMMC7721 and HCC-LM3 cells with different treatments were seeded in a 96-well plate and were cultured for different time durations. After that, cells were incubated with 10 µL of CCK-8 reagent at room temperature for 4 hours. The cell proliferation was detected by measuring the absorbance value at 450 nm using a microplate reader.
BrdU Incorporation Assay
The cell proliferative potential of SMMC7721 and HCC-LM3 cells with different treatments was determined by the BrdU incorporation assay kit (Beyotime) according to the manufacturer’s protocol.
Caspase-3/-7 Activity Assay
The caspase-3/-7 activity of the HCC cells were determined using the Caspase-Glo assay kit (Promega, Madison, WI, USA). In brief, the HCC cells after different treatments were taken out from the incubator and equilibrated to room temperature for 30 minutes. After that, the cells were incubated with 100 μL of Caspase-Glo reagent for 2 hours at room temperature. The caspase-3/-7 activity of HCC cells was determined by measuring the luminescence using a plate-reading luminometer (Thermo Fisher Scientific).
Transwell Invasion Assay
The invasive potential of the HCC cells was assessed by the transwell invasion assay. HCC cells after different treatments were seeded on the upper chamber with transwell inserts (Matrigel-coated membranes, pore size: 8 µm; Millipore, Burlington, VT, USA). The upper chamber was filled with culture medium without FBS, and the lower chamber was filled with culture medium with FBS. After 24 hours, the invaded cells were fixed with 4% paraformaldehyde for 30 minutes followed by staining with 0.1% crystal violet solution for 30 minutes, and the invaded cells were counted under a light microscope by randomly choosing five fields.
Wound Healing Assay
The migratory ability of the HCC cells was determined by the wound healing assay. Briefly, HCC cells after different treatments were seeded onto the 6-well plates. After the cells reached 90% confluence, the wound was created by scratching the cellular monolayer with a sterile pipette tip, and the cell debris was washed away by phosphate buffered saline (PBS). The wound healing was observed for 48 hours. The wound width was determined at 0 and 48 hours, respectively.
Statistical Analysis
Statistical analysis was performed using GraphPad Prism software V7.0 (GraphPad Software, La Jolla, CA, USA). One-way ANOVA or unpaired Student’s t-test was used for determination of significance of differences among/between different treatment groups. A P-value less than 0.05 was considered statistically significant.
Results
Analysis of DEGs in GSE55048, GSE55758, and GSE56545 Datasets
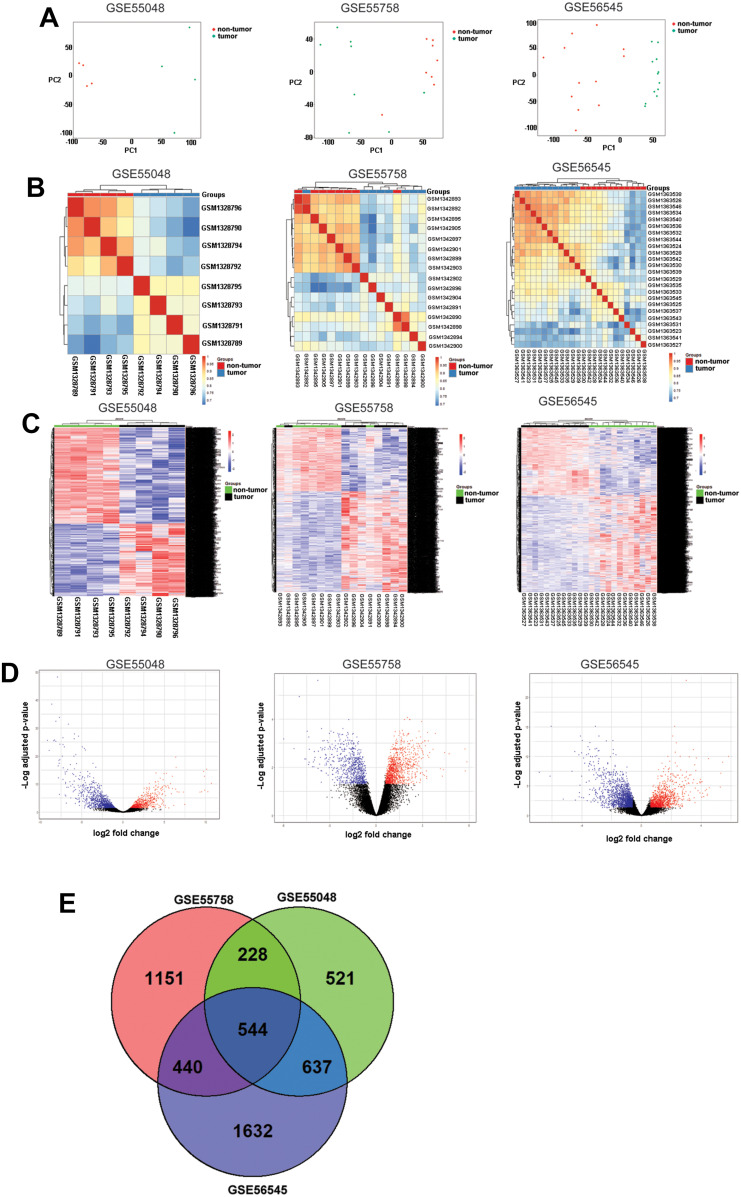
Firstly, PCA analysis was performed on the expression datasets, and the PCA results showed that the non-tumor group and tumor group were divided into two distinctive groups for these three datasets (Figure 1A). Secondly, the Pearson correlation coefficients between samples were determined by RNA-seq correlation analysis, and the Pearson correlation coefficient of each sample was greater than 0.7, indicating good repeatability (Figure 1B). Furthermore, the DEGs from the three datasets were analyzed using edgeR, and 2,439 DEGs (1,050 genes were up-regulated and 1,389 genes were down-regulated), 2,002 DEGs (1,228 genes were up-regulated and 774 genes were down-regulated), and 3,383 DEGs (1,997 genes were up-regulated and 1,386 genes were down-regulated) were identified in the GSE55048, GSE55758, and GSE56545 datasets, respectively. The DEGs were illustrated in the heatmap clustering and volcano plot (Figure 1C and D). Based on the Veen diagram results, a total of 544 common DEGs were identified in these three datasets (Figure 1E). The gene list of the 544 common DEGs was supplied in Supplemental Table S1.
Figure 1.
Analysis of DEGs in GSE55048, GSE55758, and GSE56545 datasets. (A) PCA analysis of GSE55048, GSE55758, and GSE56545 expression datasets. (B) Correlation analysis of GSE55048, GSE55758, and GSE56545 expression datasets. (C) Heatmap clustering of the DEGs between non-tumor and tumor groups in GSE55048, GSE5575, and GSE56545 datasets. (D) Volcano plot of the DEGs between non-tumor and tumor groups in GSE55048, GSE5575, and GSE56545 datasets. (E) Common DEGs shared by the three datasets.
GO Analysis, KEGG Pathway, and Reactome Pathway Analysis
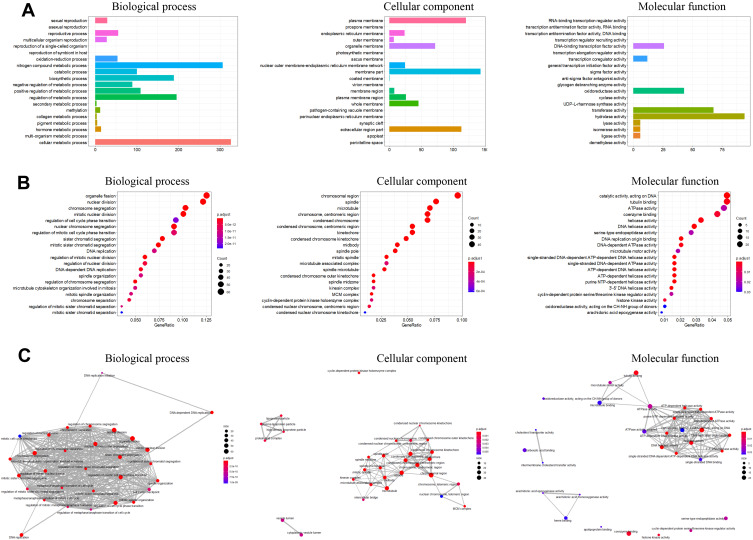
The GO terms annotation of the common DEGs were shown in Figure 2A, the top terms of the biological process include “cell metabolic process”, “nitrogen compound metabolic process”, “regulation of metabolic process”, etc. (Figure 2A); the top terms of the cellular component include “extracellular region part”, “membrane part”, “plasma membrane”, etc (Figure 2A); the top terms of molecular function include “hydrolase activity”, “DNA-binding transcription factor activity”, “transferase activity”, and so on (Figure 2A). The top GO enrichment results are shown in Figure 2B. In the biological process group, the majority of DEGs were enriched in “organelle fission”, “nuclear division”, “chromosome segregation”, “mitotic nuclear division”, “region of cell cycle phase transition” (Figure 2B); in the cellular component group, the majority of DEGs were enriched in “chromosomal region”, “spindle”, “chromosome, centromeric region”, condensed chromosome” (Figure 2B); in the molecular function group, the majority of the DEGs were enriched in “catalytic activity, acting on DNA”, “tubulin binding”, “ATPasae activity”, “coenzyme binding”, and “helicase activity” (Figure 2B). Figure 2C illustrated the enrichment map of the enriched GO terms in the different groups.
Figure 2.
GO annotations and enrichment analysis of the 544 common DEGs identified from GSE55048, GSE55758, and GSE56545 datasets. (A) GO classification of the common DEGs into the biological process, cellular component and molecular function. (B) Top enriched GO terms for common DEGs classified into biological process, cellular component, and molecular function groups. (C) Enrichment map of enriched GO terms for common DEGs. The size of the circle represents the number of genes enriched in the pathway; the color of the circle represents the P-value.
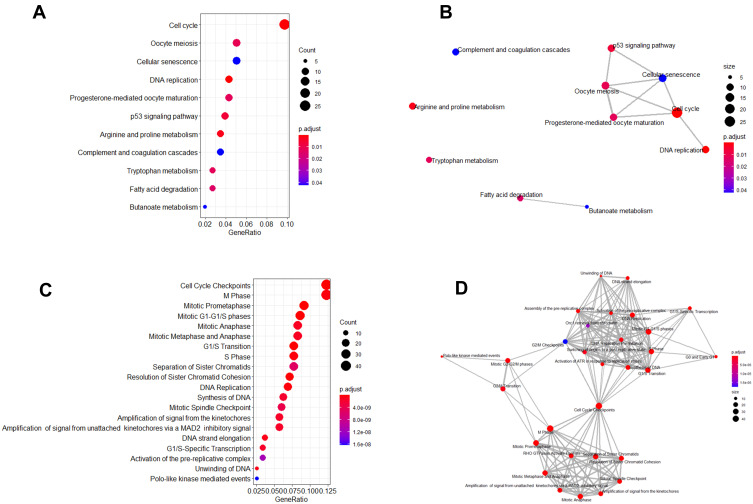
The KEGG pathway analysis results are shown in Figure 3A. The top enriched pathways of the DEGs were “Cell cycle”, “oocyte meiosis”, “cellular senescence”, and “DNA replication”. Figure 3B illustrated the enrichment map of the enriched KEGG pathways. Furthermore, the Reactome pathway analysis results are shown in Figure 3C. The top enriched pathways of the DEGs were “cell cycle checkpoints”, “M phase”, “mitotic prometaphase”, mitotic G1-G1/S phases”, “mitotic anaphase” (Figure 3C), and the enrichment map of the enriched Reactome pathways is shown in Figure 3D.
Figure 3.
KEGG pathway and Reactome pathway analysis of the 544 common DEGs identified from GSE55048, GSE55758, and GSE56545 datasets. (A) Top enriched KEGG pathways for the 544 DEGs. (B) Enrichment map of enriched KEGG pathways for common DEGs. (C) Top enriched Reactome pathways for the 544 DEGs. (D) Enrichment map of enriched Reactome pathways for the 544 DEGs. The size of the circle represents the number of genes enriched in the pathway; the color of the circle represents the P-value.
PPI Network and Identification of Hub Genes
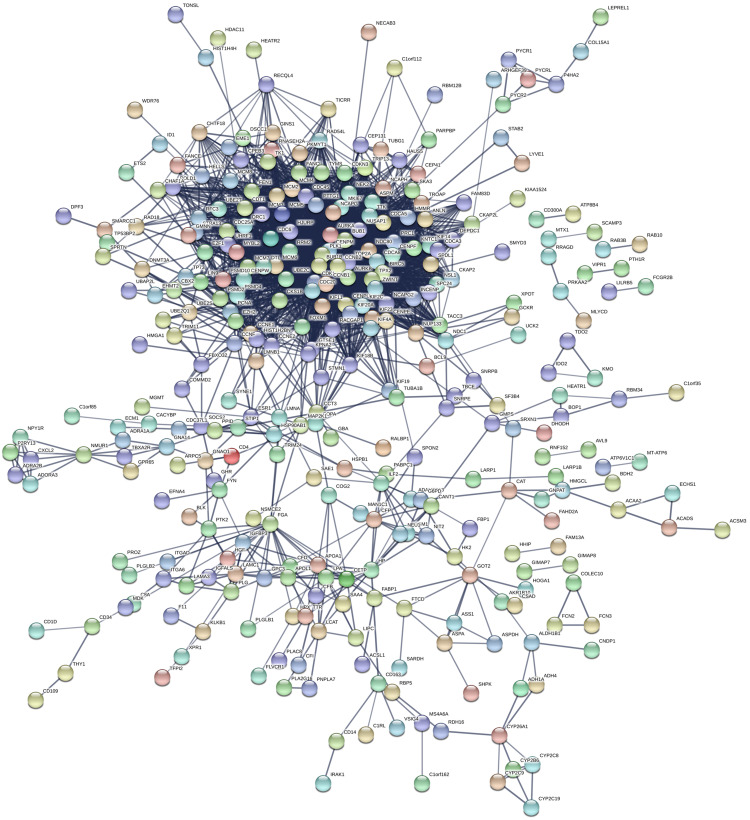
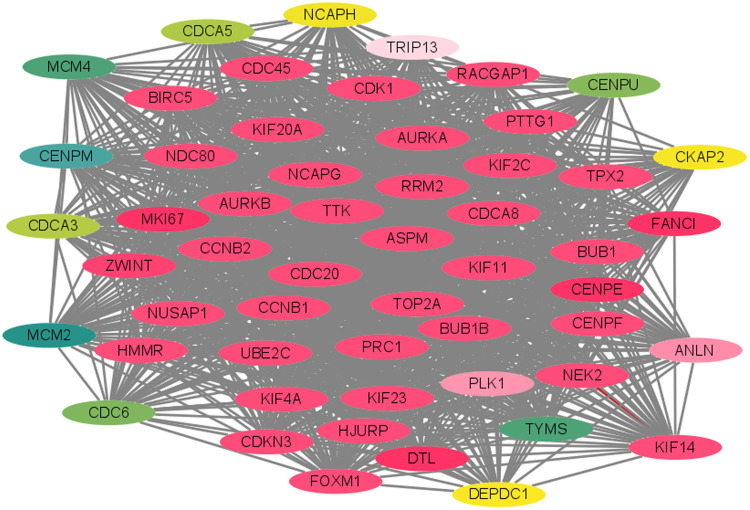
The PPI network of the DEGs was constructed using the STRING base, as shown in Figure 4. A total of 530 nodes and 3,086 edges were shown in the PPI network. Subsequently, when “score greater than 5” was defined as the cut-off criterion in MCODE, five clusters were identified from the PPI network, and the most significant clusters consisted of 55 nodes and 167 edges (Figure 5). Furthermore, the top 20 genes (CENPE, DTL, FANCI, MKI67, ZWINT, CENPF, CDC45, ASPM, TPX2, NEK2, KIF14, UBE2C, AURKB, CCNB1, KIF23, RACGAP1, BUB1, HJURP, NCAPG, CDK1) with highest MCODE score were identified as hub genes for subsequent analysis.
Figure 4.
PPI network of the common DEGs identified from GSE55048, GSE55758, and GSE56545 datasets.
Figure 5.
The most significant cluster identified based on MCODE from the PPI network.
Expression Profiles of Hub Genes in the HCC
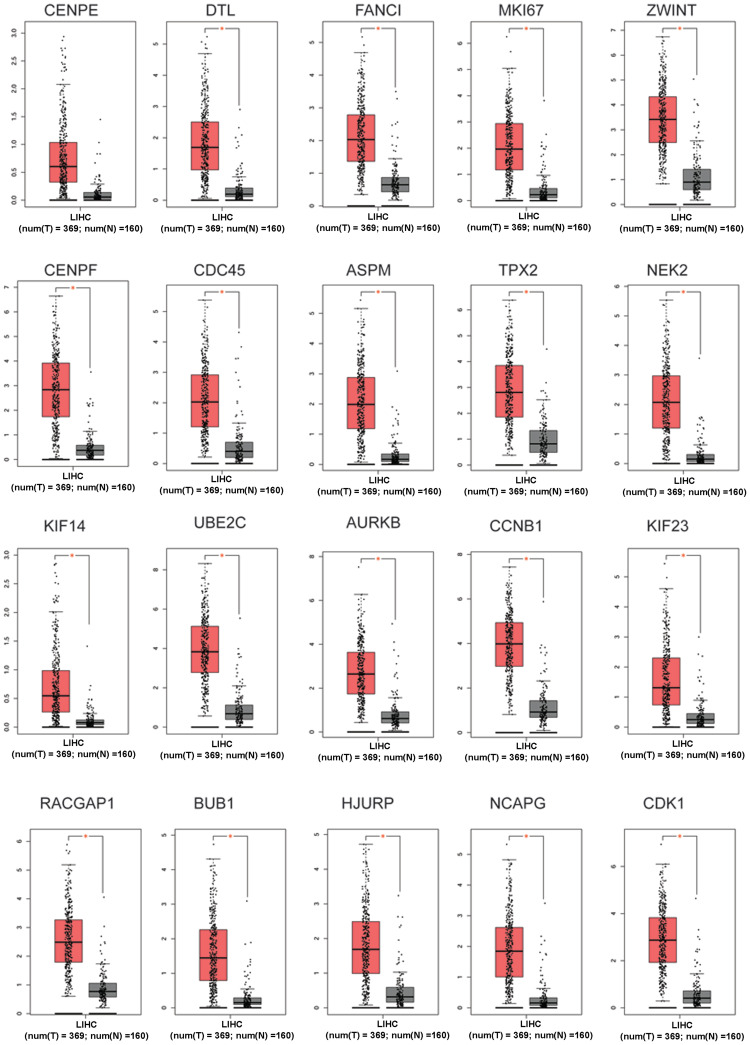
By querying the TGCA database, we evaluated the expression of these hub genes in non-tumor tissues and HCC tissues. As shown in Figure 6, CENPE gene was not significantly up-regulated in the HCC tissues when compared the non-tumor tissues; while all the other hub genes were significantly up-regulated in the HCC tissues when compared to the non-tumor tissues (Figure 6).
Figure 6.
Expression of top 20 hub genes in non-tumor tissues and HCC tissues. Red column represents tumor tissues; grey column represents normal tissues; *P<0.05.
Abbreviations: num (T), number of tumor tissues; num (N), number of normal tissues.
Association Between the Expression of Hub Genes and the Overall Survival of Patients with HCC
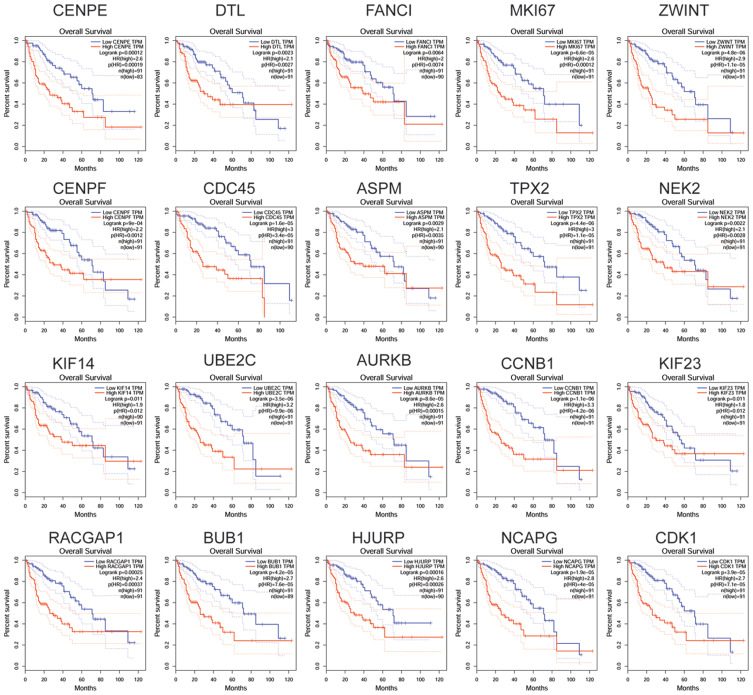
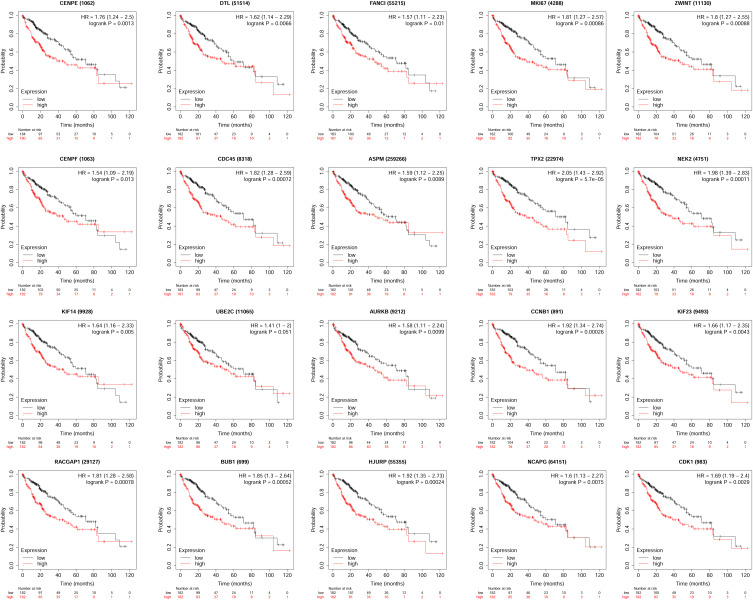
By querying the TGCA database from the GEPIA tool, we assessed the association between the expression of hub genes and the overall survival of HCC patients. As shown in Figure 7, all the hub genes showed the significant correlation with overall survival of the HCC patients. Furthermore, the analysis using the KM plotter database showed the consistent results (Figure 8). The results indicated that the high expression of these hub genes were significantly associated with the poorer overall survival of the HCC patients.
Figure 7.
Association between the expression of hub genes and the overall survival of patients with HCC was analyzed using GEPIA tool.
Figure 8.
Association between the expression of hub genes and the overall survival of patients with HCC was analyzed using KM plotter database.
KIF14 and KIF23 Knockdown Suppressed the Proliferation of HCC Cells
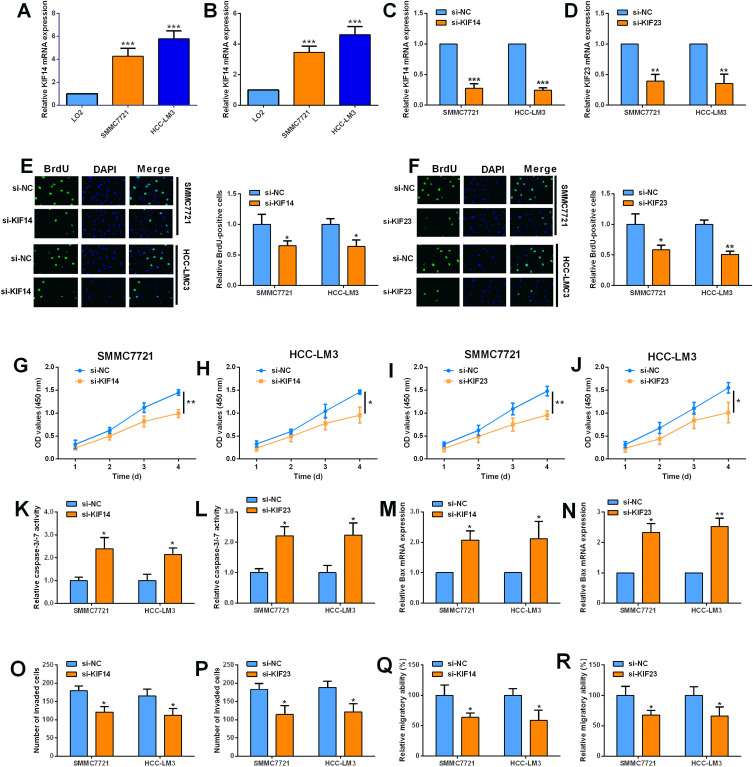
The qRT-PCR analysis showed that the mRNA expression levels of KIF14 and KIF23 were significantly up-regulated in the HCC cell lines (SMMC7721 and HCC-LM3) when compared to LO2 cells (Figure 9A and B). The knockdown of KIF14 and KIF23 in SMMC7721 and HCC-LM3 cells were achieved by transfecting the HCC cells with respective siRNAs targeting KIF14 and KIF23 (Figure 9C and D). The BrdU assay results showed that knockdown of KIF14 and KIF23 both significantly reduced the BrdU-positive SMMC7721 and HCC-LM3 cells (Figure 9E and F). The CCK-8 results showed that KIF14 and KIF23 silence both significantly suppressed the proliferative potential of SMMC7721 and HCC-LM3 cells (Figure 9G–J). In order to assess the effects of KIF14 and KIF23 on the cell apoptosis, we measured the caspase-3/-7 activity and the expression of Bax in the HCC cells. As shown in Figure 9K and L, knockdown of KIF14 and KIF23 both markedly increased the caspase-3/-7 activities of SMMC7721 and HCC-LM3 cells (Figure 9K and L). Consistently, the mRNA expression levels of Bax were elevated in these HCC cells with KIF14 or KIF23 knockdown (Figure 9M and N). Furthermore, the transwell invasion and wound healing assays showed that knockdown of KIF14 and KIF23 both remarkably suppressed the invasive and migratory abilities of SMMC7721 and HCC-LM3 cells (Figure 9O–R).
Figure 9.
KIF14 and KIF23 knockdown suppressed the proliferation of HCC cells. (A, B) The mRNA expression of KIF14 (A) and KIF23 (B) in LO2, SMMC7721, and HCC-LM3 was determined by qRT-PCR. (C) The mRNA expression of KIF14 in SMMC7721 and HCC-LM3 cells transfected with si-NC or si-KIF14 was determined by qRT-PCR. (D) The mRNA expression of KIF23 in SMMC7721 and HCC-LM3 cells transfected with si-NC or si-KIF23 was determined by qRT-PCR. (E) The cell proliferation of SMMC7721 and HCC-LM3 cells transfected with si-NC or si-KIF14 was determined by BrdU assay. (F) The cell proliferation of SMMC7721 and HCC-LM3 cells transfected with si-NC or si-KIF23 was determined by BrdU assay. (G, H) The cell viability of the SMMC7721 (G) and HCC-LM3 cells (H) transfected with si-NC or si-KIF14 was determined by CCK-8 assay. (I, J) The cell viability of the SMMC7721 (I) and HCC-LM3 cells (J) transfected with si-NC or si-KIF23 was determined by CCK-8 assay. (K, L) The caspase-3/-7 activities of the SMMC7721 (K) and HCC-LM3 cells (L) were determined by the caspase-3/-7 activity assay kit. (M, N) The mRNA expression levels of Bax in SMMC7721 (M) and HCC-LM3 cells (N) were determined by qRT-PCR. (O, P) The invasive potential of the SMMC7721 (O) and HCC-LM3 cells (P) were measured by transwell invasion assay. (Q, R) The migratory abilities of the SMMC7721 (Q) and HCC-LM3 cells (R) were assessed by transwell invasion assay. N=3; significant difference relative to si-NC groups was shown as *P<0.05, **P<0.01, and ***P<0.001.
KIF14 and KIF23 Knockdown Promoted the Chemosensitivity to Cisplatin and Sorafenib
The effects of cisplatin and sorafenib on the cell viability of HCC cells were determined by CCK-8 assay. As show in Figure 10A and B, KIF14 and KIF23 knockdown both significantly promoted the sensitivity of HCC cells to cisplatin (Figure 10A and B, Table 2). Consistently, KIF14 and KIF23 silence both also enhanced the sensitivity of HCC cells to sorafenib (Figure 10C and D, Table 2).
Figure 10.
KIF14 and KIF23 knockdown promoted the chemosensitivity to cisplatin and sorafenib. (A) The cell viability of the si-NC or si-KIF14-transfected SMMC7721 cells after being treated with different concentrations of cisplatin was determined by CCK-8 assay. (B) The cell viability of the si-NC or si-KIF23-transfected SMMC7721 cells after being treated with different concentrations of cisplatin was determined by CCK-8 assay. (C) The cell viability of the si-NC or si-KIF14-transfected SMMC7721 cells after being treated with different concentrations of sorafenib was determined by CCK-8 assay. (D) The cell viability of the si-NC or si-KIF23-transfected SMMC7721 cells after being treated with different concentrations of sorafenib was determined by CCK-8 assay. N=3.
Table 2.
IC50 Values of Cisplatin and Sorafenib in SMMC7721 Cells
| si-NC | si-KIF14 | si-NC | si-KIF23 | |
|---|---|---|---|---|
| IC50 of cisplatin (µM) | 26.03±2.734 | 17.75±2.117* | 24.20±5.575 | 13.29±1.560* |
| IC50 of sorafenib (µM) | 6.272±1.670 | 3.240±0.9836* | 6.337±0.2505 | 2.528±1.286* |
Notes: Data were presented as mean±standard deviation. N=3; *P<0.05 compared to the si-NC group.
The High Expression of KIF14 and KIF23 Predicts Worse Prognosis of Patients with HCC
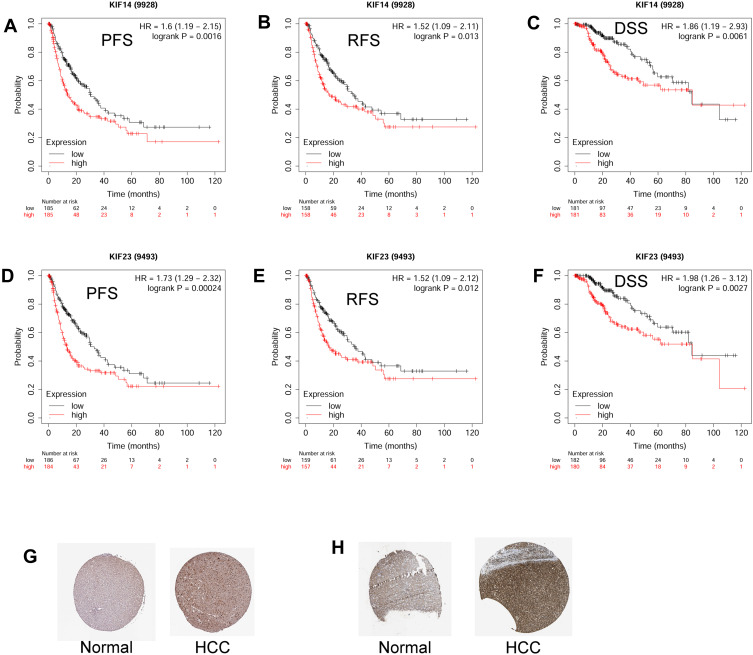
In order to further confirm the prognostic role of KIF14 and KIF23 in the HCC, we analyzed the association between KIF14/KIF23 expression and PFS/RFS/DSS of patients with HCC. As shown in Figure 11A–C, high expression of KIF14 was associated with shorter progression-free survival (PFS; Figure 11A), recurrence-free survival (RFS; Figure 11B), and disease-specific survival (DSS; Figure 11C) of patients with HCC. Consistently, high expression of KIF23 was also associated with shorter PFS (Figure 11D), RFS (Figure 11E), and DSS (Figure 11F) of patients with HCC. In addition, the protein expression levels of KIF14 and KIF23 were significantly higher in the HCC tissues than that in the normal liver tissues, as revealed by the immunohistochemistry from the Human Protein Atlas (Figure 11G and H).
Figure 11.
The high expression of KIF14 and KIF23 predicts worse prognosis of patients with HCC. (A–C) The association between the expression of KIF14 and the PFS (A), RFS (B), and DSS (C) of patients with HCC was analyzed using KM plotter database. (D–F) The association between the expression of KIF23 and the PFS (D), RFS (E), and DSS (F) of patients with HCC was analyzed using KM plotter database. (G) The protein expression of KIF14 in normal and HCC tissues was illustrated by immunohistochemistry from Human Protein Atlas. (H) The protein expression of KIF23 in normal and HCC tissues was illustrated by immunohistochemistry from Human Protein Atlas.
Discussion
The prognosis of HCC patients is still not satisfying due to lack of a sufficient diagnostic tool for early stage HCC and effective therapies for late stage HCC. Because of the complicated biological processes in the development and progression of HCC, the understanding of HCC pathophysiology is still limited. Using the high throughput techniques, researchers have been more efficiently identifying novel targets in the HCC pathophysiology. In this study, we employed three GEO datasets including GSE55048, GSE55758, and GSE5645, and identified the 544 common DEGs in these three datasets. The GO enrichment, KEGG pathway, and Reactome pathway analysis revealed key pathways of these DEGs in the biological functions. Further PPI network analysis identified 20 hub genes from these DEGs. The analysis of the TGCA database showed that the high expression of these hub genes were significantly associated with the poorer overall survival of the HCC patients. The functional assays showed that KIF14 and KIF23 silence attenuated cell proliferation and promoted chemosensitivity of HCC cells. KIF14 and KIF23 may serve as potential biomarkers for predicting the worse prognosis of patients with HCC. The newly identified hub genes in the present study may play an important role in the pathophysiology of HCC.
In the present study, by combining these large datasets, we for the first time identified 544 common DEGs, and the GO enrichment analysis showed that the DEGs were enriched in the biological process of nuclear division, mitotic nuclear division, and regulation of cell phase transition, where these biological processes are key for the progression of cancer cells. In the KEGG pathway and Reactome pathway, analysis revealed that the DEGs were enriched in “Cell cycle” and “DNA replication” pathways, suggesting that these DEGs may play a regulatory role in the cell cycle and DNA replication in HCC cells.
The PPI network analysis has been commonly used to identify the hub genes from the DEGs. Jin et al7 used the PPI network and identified sixhub genes associated with HCC progression. Zhou et al15 identify 15 hub genes related with HCC patients survival by using network analysis; by using PPI network analysis, Teng et al16 found that ten top hub genes were associated with HCC progression. In the present study, we used the MCODE method from cystoscope and identified 20 hub genes. CENPE functioned as an oncogene and promoted the progression of various types of cancers including lung cancer, esophageal adenocarcinoma, and prostate cancer.17–19 DTL was found to promote cancer progression by PDCD4 ubiquitin-dependent degradation20 and DTL depletion inhibited liver cancer cell growth, increased senescence, and reduced tumorigenesis.21 FANCI was functioned as a DNA-repair protein and has been found to be involved in the breast cancer progression.22 MKI67 functioned as an oncogene and could promote the HCC cell progression.23 ZWINT acted as an oncogene in HCC, and overexpression of ZWINT predicted poor prognosis and promoted HCC cell proliferation.24 For CENPF, frequent amplification of this gene was detected in HCC25 and CENPF functioned as an oncogene to promote HCC cell proliferation and tube formation.26 CDC45 was identified as an oncogene in other types of cancers including lung cancer.27 ASPM has been suggested as a novel marker for vascular invasion, early recurrence, and poor prognosis of hepatocellular carcinoma.28 TPX2, NEK2, UBE2C, AURKB, RACGAP1, BUB1, HJURP, and NCAPG functioned as oncogenes in HCC.29–37 CCNB1 is a key regulator in the cell cycle process and can be targeted by oncogenes, which in turn promote HCC cell progression.38,39
Among these hub genes, the kinesin-like protein family has emerged as important regulators in the tumor development and progression.40–45 In this regard, we further examined the biological actions of KIF14 and KIF23 in HCC cells. KIF14 and KIF23 belong to the kinesin-like protein family, which has been shown to play an important role in cancer biology.46 The KIF14 protein has a citron kinase binding region, an N-terminal extension for the binding of PCR1 and a C-terminal motor domain, and it functions to modulate midbody formation, cell cytokinesis, mitotic spindle formation and chromosome segregation.47 KIF14 has been found to be up-regulated in various types of tumors.47–50 Knockdown of KIF14 has been found to suppress the progression of HCC.31 KIF23 involves the regulation of cytokinesis and plays a critical role in the process of cytoplasm separation in mitosis.43 KIF23 has been identified as an oncogene in gastric cancer and glioma,43,51 and recent studies showed that KIF23 variant 1 expression may represent a novel prognostic factor in HCC patients, while the detailed molecular functions of KIF23 remain unknown.52 In the present study, we found that KIF14 and KIF23 were up-regulated in the HCC cell lines; while KIF14 and KIF23 knockdown suppressed cell proliferation, invasion, and migration, but promoted chemosensitivity to cisplatin and sorafenib in HCC cells. Moreover, mechanistic studies showed that KIF14 and KIF23 knockdown increased caspase-3/-7 activity and Bax mRNA expression level, implying that the effects of KIF14 and KIF23 on the HCC cell proliferation and chemosensitivity may be associated with the enhanced apoptosis. In addition, the high expression of KIF14 and KIF23 was associated with shorter PFS, RFS, and DSS of patients with HCC, suggesting that KIF14 and KIF23 may server as two potential biomarkers for worse prognosis of patients with HCC.
The experimental results regarding the role of KIF14 and KIF23 in the pathophysiology of HCC in the present are still at the preliminary stages, which may require further consideration. The results of the study are limited to the in vitro assays, and future studies should examine KIF14- and KIF23-mediated tumor growth and metastasis in vivo. As there are emerging GEO datasets generated by different studies, future studies may consider to analyze more GEO datasets to confirm the prognostic of KIF14 and KIF23 in HCC. In the overall survival analysis using the TCGA cohort, we were unable to access the clinical characteristics (tumor stage, etiology, cirrhosis, etc) of the HCC patients, and, in the future studies, the correlation between the expression of KIF14/23 an the clinical parameters of HCC patients should be determined by using a more detailed TCGA database. More importantly, the up-stream and down-stream mediators of KIF14 and KIF23 have not been determined in our study, which may be considered in our future plans.
Conclusion
In summary, the present study performed the integrated bioinformatics analysis and identified 20 hub genes that were closely correlated with the overall survival of the HCC patients. In addition, KIF14 and KIF23 silence attenuated cell proliferation, invasion, and migration, and promoted chemosensitivity of HCC cells. KIF14 and KIF23 may serve as potential biomarkers for predicting the worse prognosis of patients with HCC. However, more experimental studies are warranted in the future studies.
Funding Statement
There is no funding to report.
Author Contributions
All authors made substantial contributions to the conception and design, acquisition of data, or analysis and interpretation of data; took part in drafting the article or revising it critically for important intellectual content; agreed to submit to the current journal; gave final approval of the version to be published; and agree to be accountable for all aspects of the work.
Disclosure
The authors declare that they have no conflicts of interest.
References
- 1.Forner A, Reig M, Bruix J. Hepatocellular carcinoma. Lancet (London, England). 2018;391(10127):1301–1314. doi: 10.1016/S0140-6736(18)30010-2 [DOI] [PubMed] [Google Scholar]
- 2.Trepo C, Chan HL, Lok A. Hepatitis B virus infection. Lancet (London, England). 2014;384(9959):2053–2063. doi: 10.1016/S0140-6736(14)60220-8 [DOI] [PubMed] [Google Scholar]
- 3.Raoul JL, Edeline J. Systemic treatment of hepatocellular carcinoma: standard of care in China and elsewhere. Lancet Oncol. 2020;21(4):479–481. doi: 10.1016/S1470-2045(20)30082-6 [DOI] [PubMed] [Google Scholar]
- 4.Huang W, Skanderup AJ, Lee CG. Advances in genomic hepatocellular carcinoma research. GigaScience. 2018;7:11. doi: 10.1093/gigascience/giy135 [DOI] [PMC free article] [PubMed] [Google Scholar]
- 5.Ulintz PJ, Wu W, Gates CM. Bioinformatics analysis of whole exome sequencing data. Methods Mol Biol. 2019;1881:277–318. [DOI] [PubMed] [Google Scholar]
- 6.Ma X, Zhou L, Zheng S. Transcriptome analysis revealed key prognostic genes and microRNAs in hepatocellular carcinoma. PeerJ. 2020;8:e8930. doi: 10.7717/peerj.8930 [DOI] [PMC free article] [PubMed] [Google Scholar]
- 7.Yan L, Yue C, Xu Y, Jiang X, Zhang L, Wu J. Prognostic value and molecular regulatory mechanism of MSTO2P in hepatocellular carcinoma: a Comprehensive Study based on bioinformatics, clinical analysis and in vitro validation. Onco Targets Ther. 2020;13:2583–2598. doi: 10.2147/OTT.S245741 [DOI] [PMC free article] [PubMed] [Google Scholar]
- 8.Xu L, Tong T, Wang Z, Qiang Y, Ma F, Ma X. Identification of hub genes and analysis of prognostic values in hepatocellular carcinoma by bioinformatics analysis. Am J Med Sci. 2020;359(4):226–234. doi: 10.1016/j.amjms.2020.01.009 [DOI] [PubMed] [Google Scholar]
- 9.Kuleshov MV, Jones MR, Rouillard AD, et al. Enrichr: a comprehensive gene set enrichment analysis web server 2016 update. Nucleic Acids Res. 2016;44(W1):W90–97. doi: 10.1093/nar/gkw377 [DOI] [PMC free article] [PubMed] [Google Scholar]
- 10.Szklarczyk D, Morris JH, Cook H, et al. The STRING database in 2017: quality-controlled protein-protein association networks, made broadly accessible. Nucleic Acids Res. 2017;45(D1):D362–d368. doi: 10.1093/nar/gkw937 [DOI] [PMC free article] [PubMed] [Google Scholar]
- 11.Shannon P, Markiel A, Ozier O, et al. Cytoscape: a software environment for integrated models of biomolecular interaction networks. Genome Res. 2003;13(11):2498–2504. doi: 10.1101/gr.1239303 [DOI] [PMC free article] [PubMed] [Google Scholar]
- 12.Bader GD, Hogue CW. An automated method for finding molecular complexes in large protein interaction networks. BMC Bioinform. 2003;4:2. doi: 10.1186/1471-2105-4-2 [DOI] [PMC free article] [PubMed] [Google Scholar]
- 13.Tang Z, Li C, Kang B, Gao G, Li C, Zhang Z. GEPIA: a web server for cancer and normal gene expression profiling and interactive analyses. Nucleic Acids Res. 2017;45(W1):W98–w102. doi: 10.1093/nar/gkx247 [DOI] [PMC free article] [PubMed] [Google Scholar]
- 14.Menyhárt O, Nagy Á, Győrffy B. Determining consistent prognostic biomarkers of overall survival and vascular invasion in hepatocellular carcinoma. R Soc Open Sci. 2018;5(12):181006. doi: 10.1098/rsos.181006 [DOI] [PMC free article] [PubMed] [Google Scholar]
- 15.Zhou Z, Li Y, Hao H, et al. Screening hub genes as prognostic biomarkers of hepatocellular carcinoma by bioinformatics analysis. Cell Transplant. 2019;28(1_suppl):76s–86s. doi: 10.1177/0963689719893950 [DOI] [PMC free article] [PubMed] [Google Scholar]
- 16.Zhu Q, Sun Y, Zhou Q, He Q, Qian H. Identification of key genes and pathways by bioinformatics analysis with TCGA RNA sequencing data in hepatocellular carcinoma. Mol Clin Oncol. 2018;9(6):597–606. [DOI] [PMC free article] [PubMed] [Google Scholar]
- 17.Shan L, Zhao M, Lu Y, et al. CENPE promotes lung adenocarcinoma proliferation and is directly regulated by FOXM1. Int J Oncol. 2019;55(1):257–266. [DOI] [PubMed] [Google Scholar]
- 18.Zhu X, Luo X, Feng G, et al. CENPE expression is associated with its DNA methylation status in esophageal adenocarcinoma and independently predicts unfavorable overall survival. PLoS One. 2019;14(2):e0207341. doi: 10.1371/journal.pone.0207341 [DOI] [PMC free article] [PubMed] [Google Scholar]
- 19.Liang Y, Ahmed M, Guo H, et al. LSD1-mediated epigenetic reprogramming drives CENPE expression and prostate cancer progression. Cancer Res. 2017;77(20):5479–5490. doi: 10.1158/0008-5472.CAN-17-0496 [DOI] [PubMed] [Google Scholar]
- 20.Cui H, Wang Q, Lei Z, et al. DTL promotes cancer progression by PDCD4 ubiquitin-dependent degradation. J Exp Clin Cancer Res. 2019;38(1):350. doi: 10.1186/s13046-019-1358-x [DOI] [PMC free article] [PubMed] [Google Scholar]
- 21.Chen YC, Chen IS, Huang GJ, et al. Targeting DTL induces cell cycle arrest and senescence and suppresses cell growth and colony formation through TPX2 inhibition in human hepatocellular carcinoma cells. Onco Targets Ther. 2018;11:1601–1616. doi: 10.2147/OTT.S147453 [DOI] [PMC free article] [PubMed] [Google Scholar]
- 22.Hu WF, Krieger KL, Lagundzin D, et al. CTDP1 regulates breast cancer survival and DNA repair through BRCT-specific interactions with FANCI. Cell Death Discov. 2019;5:105. doi: 10.1038/s41420-019-0185-3 [DOI] [PMC free article] [PubMed] [Google Scholar]
- 23.Hou YY, Cao WW, Li L, et al. MicroRNA-519d targets MKi67 and suppresses cell growth in the hepatocellular carcinoma cell line QGY-7703. Cancer Lett. 2011;307(2):182–190. doi: 10.1016/j.canlet.2011.04.002 [DOI] [PubMed] [Google Scholar]
- 24.Ying H, Xu Z, Chen M, Zhou S, Liang X, Cai X. Overexpression of Zwint predicts poor prognosis and promotes the proliferation of hepatocellular carcinoma by regulating cell-cycle-related proteins. Onco Targets Ther. 2018;11:689–702. doi: 10.2147/OTT.S152138 [DOI] [PMC free article] [PubMed] [Google Scholar]
- 25.Kim H-E, Kim D-G, Lee KJ, et al. Frequent amplification of CENPF, GMNN and CDK13 genes in hepatocellular carcinomas. PLoS One. 2012;7(8):e43223. doi: 10.1371/journal.pone.0043223 [DOI] [PMC free article] [PubMed] [Google Scholar]
- 26.Dai Y, Liu L, Zeng T, et al. Characterization of the oncogenic function of centromere protein F in hepatocellular carcinoma. Biochem Biophys Res Commun. 2013;436(4):711–718. doi: 10.1016/j.bbrc.2013.06.021 [DOI] [PubMed] [Google Scholar]
- 27.Huang J, Li Y, Lu Z, et al. Analysis of functional hub genes identifies CDC45 as an oncogene in non-small cell lung cancer - a short report. Cellular Oncol. 2019;42(4):571–578. doi: 10.1007/s13402-019-00438-y [DOI] [PubMed] [Google Scholar]
- 28.Lin SY, Pan HW, Liu SH, et al. ASPM is a novel marker for vascular invasion, early recurrence, and poor prognosis of hepatocellular carcinoma. Clin Cancer Res. 2008;14(15):4814–4820. doi: 10.1158/1078-0432.CCR-07-5262 [DOI] [PubMed] [Google Scholar]
- 29.Hsu CW, Chen YC, Su HH, et al. Targeting TPX2 suppresses the tumorigenesis of hepatocellular carcinoma cells resulting in arrested mitotic phase progression and increased genomic instability. J Cancer. 2017;8(8):1378–1394. doi: 10.7150/jca.17478 [DOI] [PMC free article] [PubMed] [Google Scholar]
- 30.Wen S, Liu Y, Yang M, Yang K, Huang J, Feng D. Increased NEK2 in hepatocellular carcinoma promotes cancer progression and drug resistance by promoting PP1/Akt and Wnt activation. Oncol Rep. 2016;36(4):2193–2199. doi: 10.3892/or.2016.5009 [DOI] [PubMed] [Google Scholar]
- 31.Yang T, Zhang X-B, Zheng Z-M. Suppression of KIF14 expression inhibits hepatocellular carcinoma progression and predicts favorable outcome. Cancer Sci. 2013;104(5):552–557. doi: 10.1111/cas.12128 [DOI] [PMC free article] [PubMed] [Google Scholar]
- 32.Xiong Y, Lu J, Fang Q, et al. UBE2C functions as a potential oncogene by enhancing cell proliferation, migration, invasion, and drug resistance in hepatocellular carcinoma cells. Biosci Rep. 2019;39:4. doi: 10.1042/BSR20182384 [DOI] [PMC free article] [PubMed] [Google Scholar]
- 33.Benten D, Keller G, Quaas A, et al. Aurora kinase inhibitor PHA-739358 suppresses growth of hepatocellular carcinoma in vitro and in a xenograft mouse model. Neoplasia. 2009;11(9):934–944. doi: 10.1593/neo.09664 [DOI] [PMC free article] [PubMed] [Google Scholar]
- 34.Yang XM, Cao XY, He P, et al. Overexpression of Rac GTPase activating protein 1 contributes to proliferation of cancer cells by reducing hippo signaling to promote cytokinesis. Gastroenterology. 2018;155(4):1233–1249.e1222. doi: 10.1053/j.gastro.2018.07.010 [DOI] [PubMed] [Google Scholar]
- 35.Xu B, Xu T, Liu H, Min Q, Wang S, Song Q. MiR-490-5p suppresses cell proliferation and invasion by targeting BUB1 in hepatocellular carcinoma cells. Pharmacology. 2017;100(5–6):269–282. doi: 10.1159/000477667 [DOI] [PubMed] [Google Scholar]
- 36.Chen T, Huang H, Zhou Y, et al. HJURP promotes hepatocellular carcinoma proliferation by destabilizing p21 via the MAPK/ERK1/2 and AKT/GSK3beta signaling pathways. J Exp Clin Cancer Res. 2018;37(1):193. [DOI] [PMC free article] [PubMed] [Google Scholar]
- 37.Gong C, Ai J, Fan Y, et al. NCAPG promotes the proliferation of hepatocellular carcinoma through PI3K/AKT signaling. Onco Targets Ther. 2019;12:8537–8552. doi: 10.2147/OTT.S217916 [DOI] [PMC free article] [PubMed] [Google Scholar]
- 38.Wu J, Zhou X, Fan Y, Cheng X, Lu B, Chen Z. Long non-coding RNA 00312 downregulates cyclin B1 and inhibits hepatocellular carcinoma cell proliferation in vitro and in vivo. Biochem Biophys Res Commun. 2018;497(1):173–180. doi: 10.1016/j.bbrc.2018.02.049 [DOI] [PubMed] [Google Scholar]
- 39.Liu JS, Huo CY, Cao HH, et al. Aloperine induces apoptosis and G2/M cell cycle arrest in hepatocellular carcinoma cells through the PI3K/Akt signaling pathway. Phytomedicine. 2019;61:152843. doi: 10.1016/j.phymed.2019.152843 [DOI] [PubMed] [Google Scholar]
- 40.Cho SY, Kim S, Kim G, Singh P, Kim DW. Integrative analysis of KIF4A, 9, 18A, and 23 and their clinical significance in low-grade glioma and glioblastoma. Sci Rep. 2019;9(1):4599. doi: 10.1038/s41598-018-37622-3 [DOI] [PMC free article] [PubMed] [Google Scholar]
- 41.Jungwirth G, Yu T, Moustafa M, et al. Identification of KIF11 as a novel target in meningioma. Cancers. 2019;11:4. [DOI] [PMC free article] [PubMed] [Google Scholar]
- 42.Li X, Shu K, Wang Z, Ding D. Prognostic significance of KIF2A and KIF20A expression in human cancer: a systematic review and meta-analysis. Medicine. 2019;98(46):e18040. doi: 10.1097/MD.0000000000018040 [DOI] [PMC free article] [PubMed] [Google Scholar]
- 43.Li XL, Ji YM, Song R, Li XN, Guo LS. KIF23 promotes gastric cancer by stimulating cell proliferation. Dis Markers. 2019;2019:9751923. doi: 10.1155/2019/9751923 [DOI] [PMC free article] [PubMed] [Google Scholar] [Retracted]
- 44.Lucanus AJ, Yip GW. Kinesin superfamily: roles in breast cancer, patient prognosis and therapeutics. Oncogene. 2018;37(7):833–838. doi: 10.1038/onc.2017.406 [DOI] [PubMed] [Google Scholar]
- 45.Zhou J, Chen WR, Yang LC, et al. KIF11 functions as an oncogene and is associated with poor outcomes from breast cancer. Cancer Res Treat. 2019;51(3):1207–1221. doi: 10.4143/crt.2018.460 [DOI] [PMC free article] [PubMed] [Google Scholar]
- 46.Katayama H, Brinkley WR, Sen S. The aurora kinases: role in cell transformation and tumorigenesis. Cancer Metastasis Rev. 2003;22(4):451–464. doi: 10.1023/A:1023789416385 [DOI] [PubMed] [Google Scholar]
- 47.Yang Z, Li C, Yan C, et al. KIF14 promotes tumor progression and metastasis and is an independent predictor of poor prognosis in human gastric cancer. Biochim Biophys Acta Mol Basis Dis. 2019;1865(1):181–192. doi: 10.1016/j.bbadis.2018.10.039 [DOI] [PubMed] [Google Scholar]
- 48.Singel SM, Cornelius C, Zaganjor E, et al. KIF14 promotes AKT phosphorylation and contributes to chemoresistance in triple-negative breast cancer. Neoplasia. 2014;16(3):247–256, 256.e242. [DOI] [PMC free article] [PubMed] [Google Scholar]
- 49.Wang ZZ, Yang J, Jiang BH, et al. KIF14 promotes cell proliferation via activation of Akt and is directly targeted by miR-200c in colorectal cancer. Int J Oncol. 2018;53(5):1939–1952. [DOI] [PMC free article] [PubMed] [Google Scholar]
- 50.Zhang Y, Yuan Y, Liang P, et al. Overexpression of a novel candidate oncogene KIF14 correlates with tumor progression and poor prognosis in prostate cancer. Oncotarget. 2017;8(28):45459–45469. doi: 10.18632/oncotarget.17564 [DOI] [PMC free article] [PubMed] [Google Scholar]
- 51.Takahashi S, Fusaki N, Ohta S, et al. Downregulation of KIF23 suppresses glioma proliferation. J Neurooncol. 2012;106(3):519–529. [DOI] [PubMed] [Google Scholar]
- 52.Sun X, Jin Z, Song X, et al. Evaluation of KIF23 variant 1 expression and relevance as a novel prognostic factor in patients with hepatocellular carcinoma. BMC Cancer. 2015;15:961. doi: 10.1186/s12885-015-1987-1 [DOI] [PMC free article] [PubMed] [Google Scholar]


