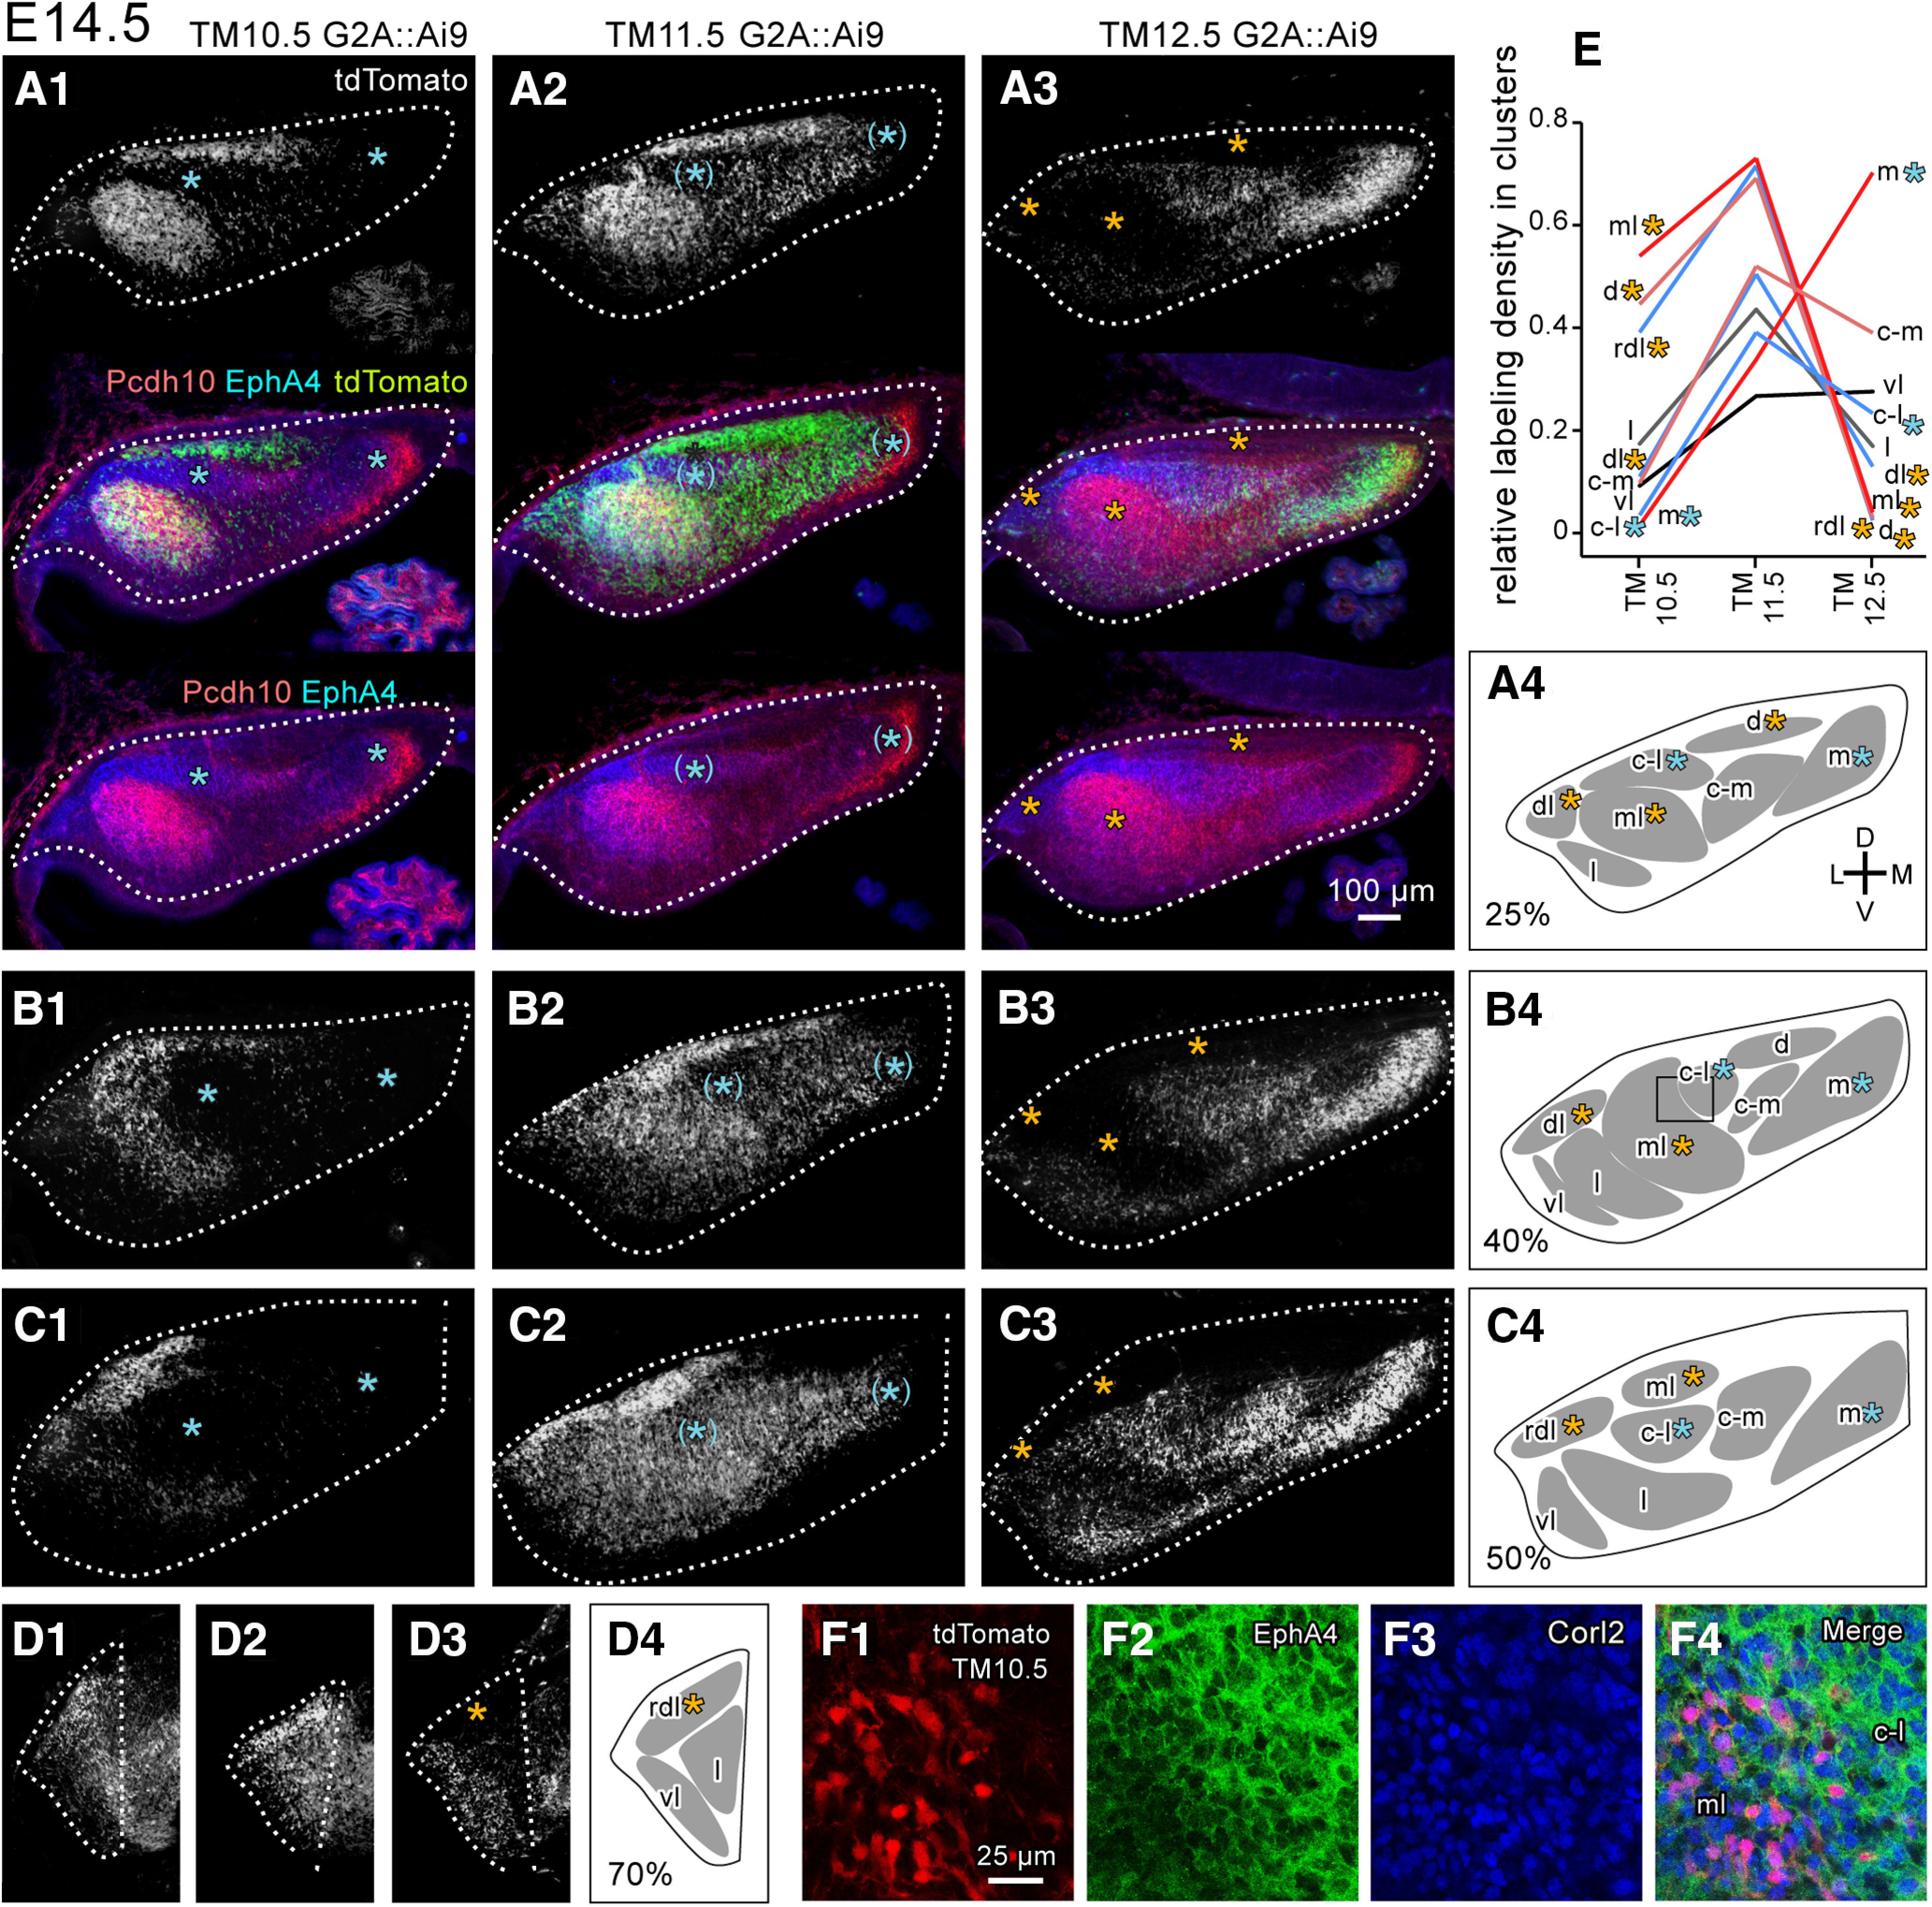
Figure 6.

Spatial distribution of E10.5-, E11.5-, and E12.5-born PCs in the E14.5 cerebellum. A–D, Images of coronal sections of the left cerebellum of G2A::Ai9 embryos which had tamoxifen injection at E10.5 (subpanel 1), E11.5 (subpanel 2) and E12.5 (subpanel 3) at different rostrocaudal levels. The top, center and bottom panels show images of the tdTomato fluorescence signal (top), three signals merged, and signals of tdTomato fluorescence (green) and immunostaining signals of Pcd10 (red) and EphA4 (blue) in (A), while only the tdTomato fluorescence signal is shown in B–D. The tdTomato signal indicates neurons (mostly PCs) that expressed Neurog2-CreER at the time of tamoxifen injection. White dashed lines indicate the coutour of the cerebellum. Subpanel 4 shows schematic drawings of identified clusters. Blue and Orange asterisks indicate (position of) the E10.5-PC-sparse and E12.5-PC-sparse clusters, respectively. E, Relative labeling density in nine E14.5 clusters. The plotted data were the average of the tdTomato fluorescence signal in the digital file (0-255) measured in 9-18 square areas of 900 μm2 located inside the identified cluster in 3-6 sections. The same brightness and contrast adjustment was done in all sections. F, Confocal high-magnification image of immunostaining and tdTomato expression at the junction between the ml and c-l clusters in the AM10.5 G2A::Ai9 embryo, showing expression of tdTomato (E10.5-born neurons) colocalized exactly with Corl2 (PC marker) at the cellular level in the ml cluster. The area of this image is indicated in B4 with a square. Abbreviations, c-l, c-m, d, dl, l, m, ml, rdl, vl, names of E14.5 clusters; C, caudal; D, dorsal; L, lateral; M, medial; R, rostral.V, ventral.
