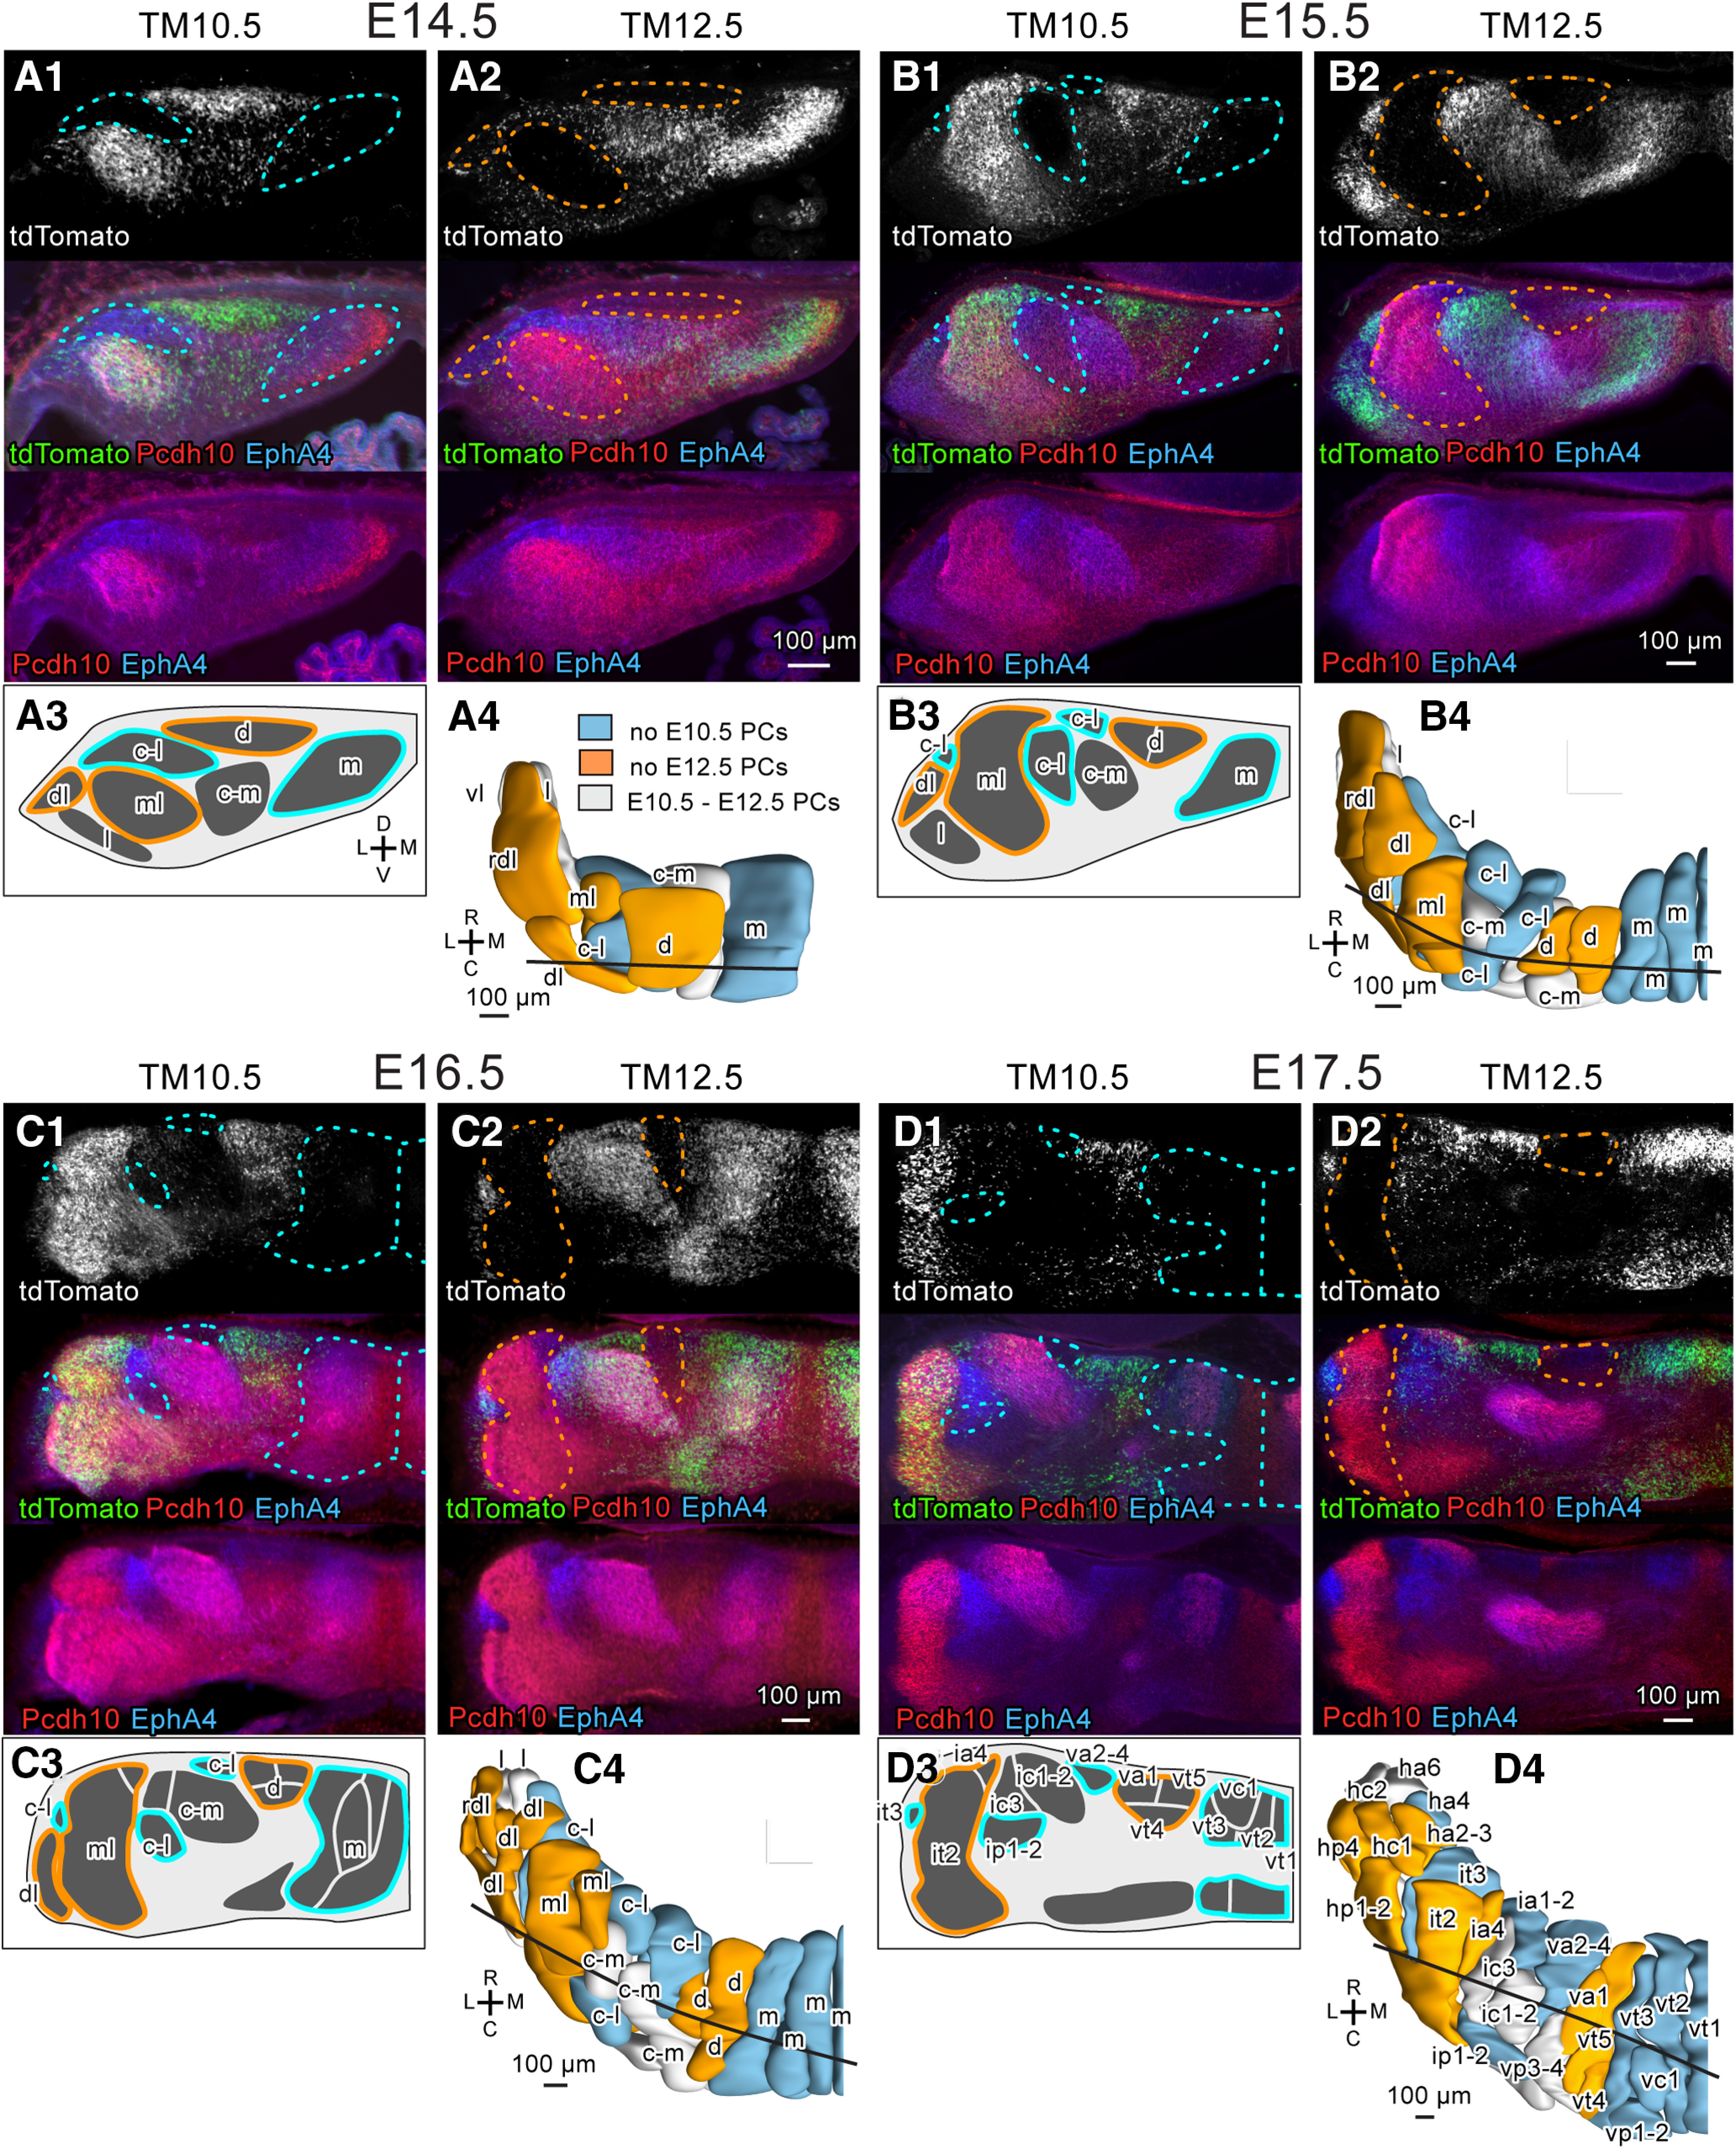
Figure 7.

Identification of E10.5-PC-sparse and E12.5-PC-sparse clusters in the E14.5-E17.5 cerebellums. A–D, Images of coronal sections of the left TM10.5 and TM12.5 cerebellums at nearly the same level (subpanel 1 and 2, respectively) and schematic drawing of clusters (subpanel 3) and dorsal view of the 3D scheme (subpanel 4) of the E14.5 (A), E15.5 (B), E16.5 (C), and E17.5 (D) cerebellums. In subpanels 1 and 2, the tdTomato fluorescence signal (top), three signals merged, and signals of tdTomato fluorescence (green) and immunostaining signals of Pcd10 (red) and EphA4 (blue) are shown from the top to the bottom. Blue and orange colors in dashed lines (in subpanels in 1 and 2), circumscribing lines (in subpanels 3), and clusters in the 3D schemes (in subpanels 4) indicate E10.5-PC-sparse and E12.5-PC-sparse clusters. Black line in the 3D scheme indicates the position of the coronal section in subpanels 1-3. Abbreviations, c-l, c-m, d, dl, l, m, ml, rdl, vl, names of E14.5 clusters; ha2-3, ha4, ha6, hc1, hc2, hp1-2, hp4, ia1-2, ia4, ic1-2, ic3, ip1-2, it2, it3, va1, va2-4, vc1, vp1-2, vp3-4, vt1, vt2, vt3, vt4, vt5, names of E17.5 clusters; C, caudal; D, dorsal; L, lateral; M, medial; R, rostral.V, ventral.
