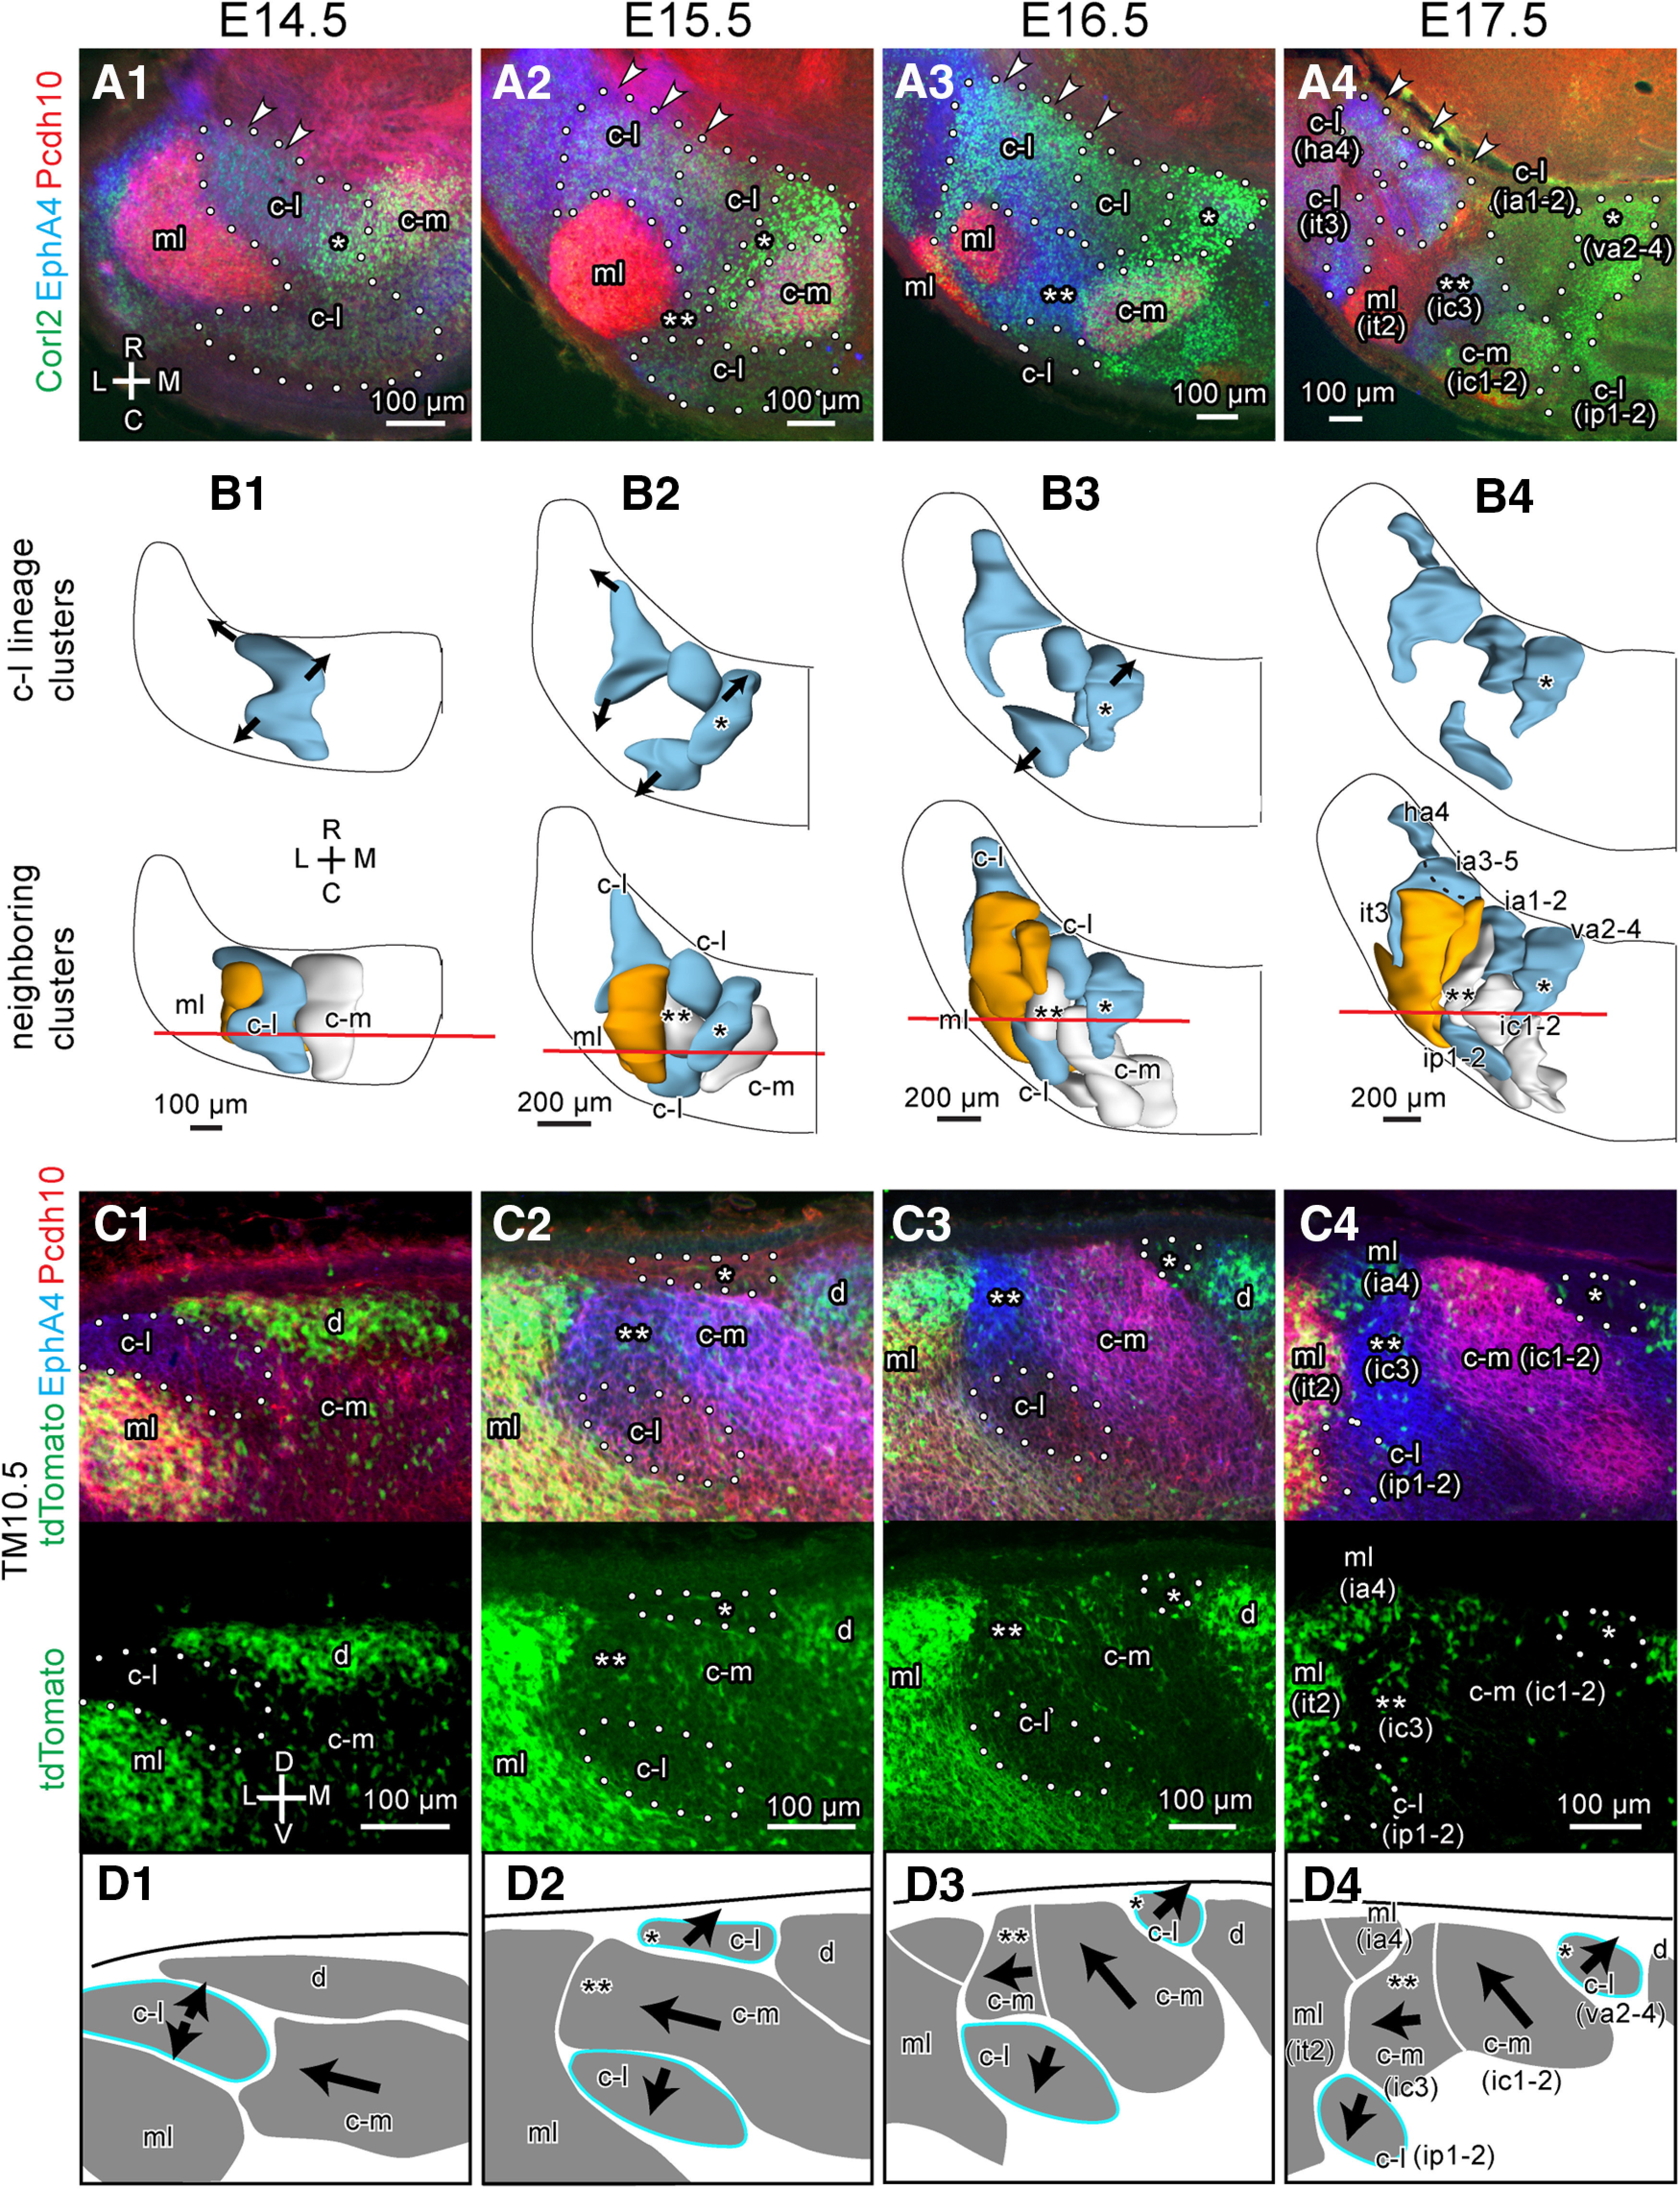
Figure 9.

Separation and migration of the c-l lineage cluster from E14.5 to E17.5. A, Horizontal sections of the left paravermal and hemispheric cerebellum at around the central level. Sections were immunostained for Corl2 (green channel), EphA4 (blue channel), and Pcdh10 (red channel). Dashed lines circumscribe c-l lineage clusters. Arrowheads indicate the lateral migration of the rostral c-l lineage clusters. B, Dorsal view of the three-dimensional scheme of reconstructed c-l lineage clusters (blue). In the bottom panel, ml and c-m lineage clusters (orange and white) are added. Red transversal line indicate the position of the coronal section shown in (B). Black dashed line indicate the contour of the ia3-5 cluster which is located ventral to the it3 cluster in (B4). C, Images of a part of the left cerebellum at the junction between the c-l and c-m lineage clusters in coronal sections. The top image shows merged signals of tdTomato expression, which indicates E10.5-born PCs (green) and immunostaining for EphA4 (blue) and Pcdh10 (red). The bottom subpanel shows only the image of only tdTomato labeling. D, Schematic drawing of clusters shown in C. In A–D, columns of subpanels 1-4 are from E14.5, E15.5, E16.5 and E17.5 cerebellums. Dashed lines indicate c-l lineage clusters that are E10.5-PC-sparse and weak in Pcdh10 expression in A and C. Single asterisks indicate the most medial part of the c-l cluster or the most medial c-l lineage cluster which had higher expression of Corl2 than the rest of the c-l lineage clusters in A–D. Double asterisks indicate the most lateral part of the c-m cluster or the most lateral c-m lineage cluster which intercalated the c-l lineage clusters in A–D. Arrows indicate the direction of cluster migration. Scale bar in C1 (100 μm) applies to C1–C4. Abbreviations, c-l, c-m, d, ml, names of E14.5 clusters; ha4, ia1-2, ia3-5, ia4, ic1-2, ic3, ip1-2, it2, it3, va2-4, names of E17.5 clusters; C, caudal; D, dorsal; L, lateral; M, medial; R, rostral.V, ventral.
