Abstract
The study of protein self-interactions (SIPs) can not only reveal the function of proteins at the molecular level, but is also crucial to understand activities such as growth, development, differentiation, and apoptosis, providing an important theoretical basis for exploring the mechanism of major diseases. With the rapid advances in biotechnology, a large number of SIPs have been discovered. However, due to the long period and high cost inherent to biological experiments, the gap between the identification of SIPs and the accumulation of data is growing. Therefore, fast and accurate computational methods are needed to effectively predict SIPs. In this study, we designed a new method, NLPEI, for predicting SIPs based on natural language understanding theory and evolutionary information. Specifically, we first understand the protein sequence as natural language and use natural language processing algorithms to extract its features. Then, we use the Position-Specific Scoring Matrix (PSSM) to represent the evolutionary information of the protein and extract its features through the Stacked Auto-Encoder (SAE) algorithm of deep learning. Finally, we fuse the natural language features of proteins with evolutionary features and make accurate predictions by Extreme Learning Machine (ELM) classifier. In the SIPs gold standard data sets of human and yeast, NLPEI achieved 94.19% and 91.29% prediction accuracy. Compared with different classifier models, different feature models, and other existing methods, NLPEI obtained the best results. These experimental results indicated that NLPEI is an effective tool for predicting SIPs and can provide reliable candidates for biological experiments.
Keywords: Self-interacting protein, natural language processing, evolutionary information, stacked auto-encoder
Introduction
Proteins are products expressed in organisms after gene transcription and translation, and are an important part of organisms. There are many kinds and functions of proteins, including almost all life activities such as growth, development, movement, inheritance, and reproduction are completed by proteins. There is no doubt that protein is the executor of the physiological function of the organism and the direct embodiment of life phenomena. The study of protein-protein interactions (PPIs) will directly clarify the changing mechanism of organisms under physiological or pathological conditions, which is of great significance for research and development in the fields of disease prevention and drug development.1-3
As a special PPI, a self-interacting protein (SIP) is 1 where different copies of the same protein interact and play an important role in the cell system. Emerging researches show that SIP can expand the diversity of proteins without increasing the size of the genome, and help increase stability and prevent protein denaturation and reduce its surface area. In addition, SIPs play a significant role in a wide range of biological processes such as immune response, signal transduction, enzyme activation, and gene expression regulation. For example, research by Pérez-Bercoff et al4 at the genome-wide level indicated that the genes of SIPs may have higher repeatability than other genes. Ispolatov et al5 found that the self-interaction of proteins is an important factor of protein function and has great potential for interaction with other proteins, which indicated that SIPs play an important role in the protein interaction networks (PINs). Hashimoto et al6 proposed several self-interacting molecular mechanisms including insertions, domain swapping, deletions, and ligand-induced to study SIPs.
So far, many valuable achievements have been made in the study of protein interaction, such as the establishment of international proteome databases including UniProt,7 PDB,8 and SwissProt,9 and the establishment of protein interaction databases such as DIP,10 BioGRID,11 and STRING.12 However, with the continuous development of sequencing technology, the growth rate of protein sequences is accelerating.13 Only relying on biological experiment methods to identify SIPs will lead to an increasing gap between protein sequence information and interaction information. To improve the measurement efficiency of SIPs and reduce costs, people began to pay attention to the study of protein interaction prediction based on computational methods. For example, Li et al14 proposed an ensemble learning method PSPEL to predict self-interacting proteins. This method extracts PSSM features from known protein sequences and sends them to an ensemble classifier to predict self-interacting and non-self-interacting proteins. On Saccharomyces cerevisiae and Human SIPs data sets, PSPEL achieved 86.86% and 91.30% prediction accuracy, respectively. Chen et al15 combined protein sequence information with wavelet transform, and predicted self-interacting proteins accurately through deep forest predictor. Wang et al16 proposed a prediction model for SIPs based on machine learning algorithms, which combines the Zernike Moments (ZMs) descriptor on protein sequences with the Probabilistic Classification Vector Machines (PCVM) and Stacked Sparse Auto-Encoder (SSAE), and classifies the self-interaction of proteins by Probabilistic Classification Vector Machine (PCVM).
In this study, we propose a novel SIPs prediction model NLPEI based on natural language understanding theory and protein sequence evolutionary information. Specifically, we first interpret protein sequence information as natural language and extract its abstract features through natural language processing algorithm. Then, we use the Position-Specific Scoring Matrix (PSSM) to describe the evolutionary information of the protein and use the deep learning Stacked Auto-Encoder (SAE) algorithm to extract their hidden features. Finally, we fuse the above features and feed them into the Extreme Learning Machine (ELM) classifier to predict the protein self-interaction accurately. On SIPs benchmark data sets Human and yeast, NLPEI achieved the prediction accuracy of 94.19% and 91.29%, respectively. To further verify the performance of the NLPEI model, we compared it with different feature descriptor models, different classifier models and other existing models. Competitive experimental results show that the NLPEI model has high reliability and can effectively predict potential self-interactions between proteins. The flowchart of NLPEI model is shown in Figure 1.
Figure 1.
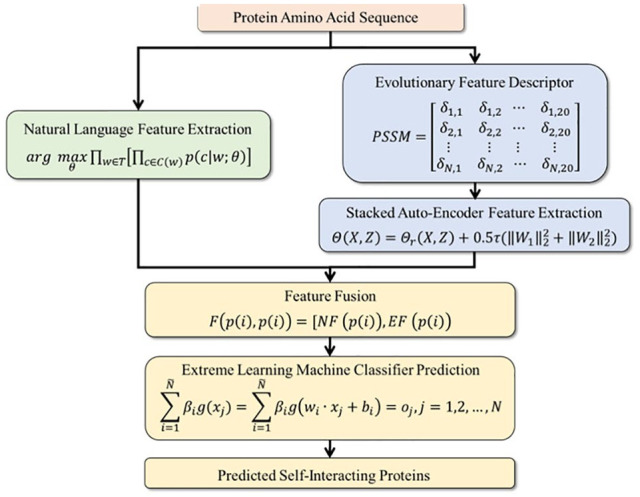
The flowchart of NLPEI model.
Materials and Methods
Gold standard data sets
The data we used were downloaded from 20199 human protein sequences provided by UniProt database.7 These high-quality data are integrated from different databases including DIP,10 InnateDB,17 MINT,18 PDB,8 BioGRID,19 MatrixDB,20 and IntAct.21 In the experiment, we only select those PPIs whose interaction type is marked as “direct interaction” and the 2 interaction partners are the same. Thus, 2994 human protein sequences were determined.
We followed the method of Liu et al22 to construct the gold standard data set from 2994 SIPs to measure the performance of NLPEI. The steps are as follows: (1) we first remove protein sequences less than 50 residues and greater than 5000 residues from all human proteomes; (2) The positive data set used to construct the gold standard must meet 1 of the following conditions: (a) the protein declared as homo-oligomer (containing homodimer and homotrimer) in UniProt; (b) having been verified by more than 1 small-scale experiment or more than 2 large-scale experiments; (c) At least 2 published studies have reported the self-interaction; (3) The negative data used to construct the gold standard were all the proteins with known self-interaction removed from the human proteome and UniProt database. Finally, 1441 human SIPs and 15936 human non-SIPs were selected as the gold standard positive and negative data sets. Furthermore, to further evaluate the model, we used the same strategy to create yeast data set containing 710 positive SIPs and 5511 negative non-SIPs.
Natural language feature
Protein sequences are composed of amino acids arranged and combined according to certain rules, which contain a wealth of information.23 In this study, we regard amino acid fragments as words in natural language, and protein sequences as sentences, and analyze the protein sequence through natural language understanding theory to obtain the effective features. Specifically, we first perform word segmentation in the way of k-mers,24 converting amino acid fragments in protein sequences into words in natural language. For example, 4-mers of protein sequences can be represented as . Since there are 20 kinds of amino acids in the protein sequence, words can be generated in this way. Taking the sequence as an example, it can be converted into the form of after the word segmentation through 4-mers.
After word segmentation, protein sequences are converted into sentences that can be processed by natural language processing algorithms. We then use the skip-gram in word2vec algorithm to learn the distributed representation of protein sentences. Word2vec is a shallow neural network, which can express words from the context information of neighboring words through the optimized training model according to a given corpus, thus expressing a word into a vector form quickly and effectively. Given a word sequence , skip-gram uses the co-occurrence information of the words in the context window to learn the word representation and calculates the parameter set θ to maximize the product of the following conditional probabilities.
| (1) |
Here w represents the word, T represents the text set, c represents the word included in the context, represents the word set included in the context, and represents the conditional probability, which is calculated as follows:
| (2) |
Here c represents the set of words in all contexts, equivalent to v; ; and represent the column vector of c and w, respectively; θ represents the specific value of each dimension in and . For example, given a sentence “I love natural language processing,” suppose the dictionary library is {“I,” “love,” “natural,” “language,” “processing”}, these words are encoded in advance. If the center word “natural” is used as the input and the window value is 2, then what the skip-gram algorithm does is to predict that the context of the center word “natural” is “I,” “love,” “language” and “processing.” Therefore, skip-gram needs to maximize the probability . Since words are independent of each other, the probability formula can be converted to .
Evolutionary feature
Position-specific scoring matrix
We use PSSM to describe the evolutionary information of protein sequences in the experiment, and extract their features through the Stacked Auto-Encoder algorithm of deep learning. PSSM is a sequence matrix proposed by Gribskov et al25 for effectively discovering similar proteins of distantly related species or new members of a protein family.1,13 By using the Position Specific Iterated BLAST (PSI-BLAST) tool, we compare the given protein sequence with the homologous protein in SwissProt database to extract its evolutionary information and generate the PSSM matrix of , which can be described as follows:
| (3) |
Here represents the probability that the ith residue being mutated into the jth naive amino acid during the evolutionary process of protein multiple sequence alignment. To obtain homologous sequences effectively, we set the iteration number of PSI-BLAST to 3 and its parameter e to 0.001. The PSI-BLAST tool and the SwissProt database can be gained at http://blast.ncbi.nlm.nih.gov/Blast.cgi/.
Stacked auto-encoder
The evolutionary information generated by the PSSM matrix contains some noise, so we use the deep learning SAE algorithm to reduce noise and extract their features. SAE is a deep neural network constructed by multiple Auto-encoders (AE).26,27 It automatically learns features from the data in an unsupervised way and can give a better description of features than the original data. AE, the basic component of SAE, can be regarded as a shallow neural network with 1 input layer, 1 hidden layer, and 1 output layer. Its structure is shown in figure 2.
Figure 2.
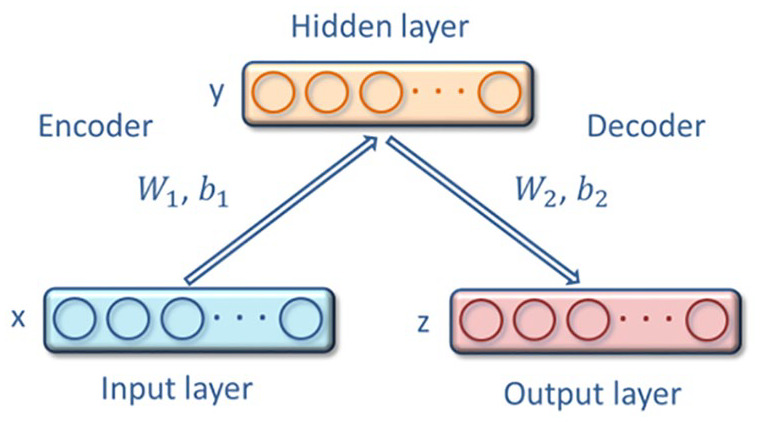
Structure of auto-encoder.
Suppose a training sample is input, AE first encodes it as the representation of hidden layer through the mapping function :
| (4) |
Here, represents the activation function of encoder, and and represent the set of weights and the set of bias, respectively. Then the decoder uses the mapping function maps the representation of hidden layer Ymath46-11769 to output layer .
| (5) |
Here, represents the activation function of decoder, and and represent the set of weights and the set of bias, respectively. By minimizing the loss function, and using backpropagation to adjust the above parameters.
| (6) |
Here, τ represents the weight decay cost and represents the reconstruction error. To minimize the reconstruction error, it is necessary to describe the original input data in the hidden layer as much as possible. Thus, the hidden layer can learn the features of the original input to the maximum.
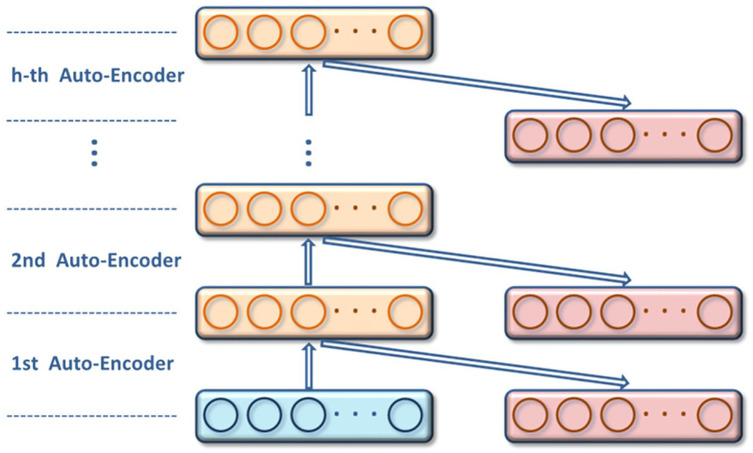
The complete SAE is constructed by combining multiple AEs, and its structure is shown in figure 3. SAE learns from the bottom up in a hierarchical form. The detailed steps are as follows: The original data is first fed into the first layer of SAE and sent to the hidden layer through learning; then the second layer of SAE receives the data from the first layer and then sends it to the hidden layer through learning. In this way, SAE learns the depth features of the original data in a layer-by-layer iterative manner. After all layers of SAE have learned the features of the data, the entire neural network fine-tunes the parameters of each layer by minimizing the loss function to effectively extract advanced features.
Figure 3.
Structure of stacked auto-encoders.
Feature fusion
In this study, we constructed the natural language feature based on natural language understanding theory and the evolutionary feature based on protein evolutionary information. To fully describe protein self-interaction and accurately predict them, we need to fuse these 2 types of features. The fused features have the advantage of being able to fully reflect the properties of proteins from different aspects, helping to dig deep into potential protein self-interaction and effectively improve model performance. Since the dimensions of the natural language features and evolutionary features we extracted are different, we use the additional rules that can adapt to different dimensions to fuse them. The formula is described as follows:
| (7) |
Here represents the fusion feature of the self-interaction of protein , represents the natural language feature of protein and represents the evolutionary feature of protein .
Extreme learning machine classifier
In the experiment, we use the Extreme Learning Machine (ELM) classifier to classify the fused features to accurately predict whether there is self-interaction between proteins. ELM is a single hidden layer feed forward neural network algorithm proposed by Huang et al28 The core advantage of ELM lies in the ability to randomly set the hidden layer parameters for network initialization settings, without the need for continuous adjustment by humans, and has nothing to do with the training sample data, therefore, greatly reducing the network training time.
For N arbitrarily different samples , where and , the number of hidden layer nodes is and the activation function is , the ELM can be modeled as:
| (8) |
Here represents the weight vector connecting the hidden layer node and the input layer node, represents the weight vector connecting the hidden layer node and the output layer node, and represents the threshold value of the hidden layer node. The learning goal of ELM is to fit the given n samples with zero error:
| (9) |
That is, there is , and , which makes:
| (10) |
The above equation can also be expressed as:
| (11) |
Here,
| (12) |
| (13) |
H is the output of the hidden layer node, β is the output weight, and T is the expected output. When training the ELM network, the input weights and offsets are first randomly set, and the determined hidden layer output matrix H can be obtained according to equation 12, Thus, the learning and training problem of ELM is transformed into a least-square norm problem of solving the output weight matrix β, that is, solving the least-square norm solution of formula 11.
| (14) |
Here is the Moore-Penrose generalized inverse matrix of the hidden layer response matrix H.
Results
Evaluation criteria
To verify the ability of the model to predict SIPs, we use the evaluation criteria accuracy (Acc.), specificity (Spe.), negative predictive value (NPV), and area under the receiver operating characteristic curve (AUC) to evaluate the model performance.27,29-31 These evaluation criteria can be described by formulas as follows:
| (15) |
| (16) |
| (17) |
| (18) |
Here TP represents the number of proteins with self-interactions that are correctly predicted, TN represents the number of proteins with self-interactions that are erroneously predicted, FP represents the number of proteins without self-interactions that are correctly predicted, and FN represents the number of proteins without self-interactions that are erroneously predicted.
To get a reliable and stable model, we use the five-fold cross-validation method to perform the experiments.32,33 Specifically, we first divide the initial protein self-interaction data set into 5 independent and disjoint subsets on average. Then use a separate subset to verify the model, and the other 4subsets are used for training. This process is repeated 5 times until each subset is used as the verification set only once. Finally, the average of the 5 experimental results and the standard deviation are used as the evaluation criteria of the model.
Performance on gold standard data sets
We verify the ability of the NLPEI model to predict SIPs on gold standard data sets human and yeast. Table 1 lists the results of five-fold cross-validation obtained by NLPEI on human data set. As can be seen from the table, NLPEI achieved prediction accuracy of 94.25%, 94.02%, 94.42%, 94.45%, and 93.82% in 5 experiments, and its average accuracy and standard deviation reached 94.19% and 0.27%, respectively. Among the evaluation criteria specificity, negative predictive value and AUC, the average values of NLPEI were 99.42%, 94.56%, and 67.46%, and the standard deviations of NLPEI were 1.24%, 1.27%, and 5.34%, respectively. Table 2 summarizes the five-fold cross-validation experimental results of NLPEI on yeast data set. We can see from the table that NLPEI achieved 91.29%, 99.19%, 91.67%, and 66.55% of average accuracy, specificity, NPV, and AUC in the experiment, and their standard deviations were 0.28%, 0.66%, 0.74%, and 5.83%, respectively. The AUC curves generated by NLPEI on human and yeast data sets are shown in Figures 4 and 5.
Table 1.
The five-fold cross-validation results performed by NLPEI on human data set.
| Testing set | First fold (%) | Second fold (%) | Third fold (%) | Fourth fold (%) | Fifth fold (%) | Average (%) |
|---|---|---|---|---|---|---|
| Acc. | 94.25 | 94.02 | 94.42 | 94.45 | 93.82 | 94.19 ± 0.27 |
| Spe. | 100.00 | 99.97 | 97.20 | 99.94 | 100.00 | 99.42 ± 1.24 |
| NPV | 94.11 | 93.90 | 96.78 | 94.34 | 93.66 | 94.56 ± 1.27 |
| AUC | 63.22 | 65.39 | 74.63 | 71.51 | 62.55 | 67.46 ± 5.34 |
Table 2.
The five-fold cross-validation results performed by NLPEI on yeast data set.
| Testing set | First fold (%) | Second fold (%) | Third fold (%) | Fourth fold (%) | Fifth fold (%) | Average (%) |
|---|---|---|---|---|---|---|
| Acc. | 91.24 | 91.64 | 91.48 | 91.16 | 90.92 | 91.29 ± 0.28 |
| Spe. | 99.64 | 99.44 | 98.12 | 99.02 | 99.73 | 99.19 ± 0.66 |
| NPV | 91.23 | 91.64 | 92.81 | 91.80 | 90.86 | 91.67 ± 0.74 |
| AUC | 68.44 | 75.27 | 65.15 | 64.39 | 59.49 | 66.55 ± 5.83 |
Figure 4.
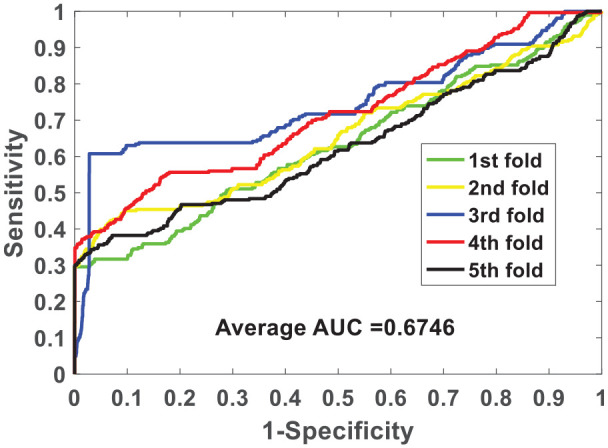
ROC curves of five-fold cross-validated performed by NLPEI on human data set.
Figure 5.
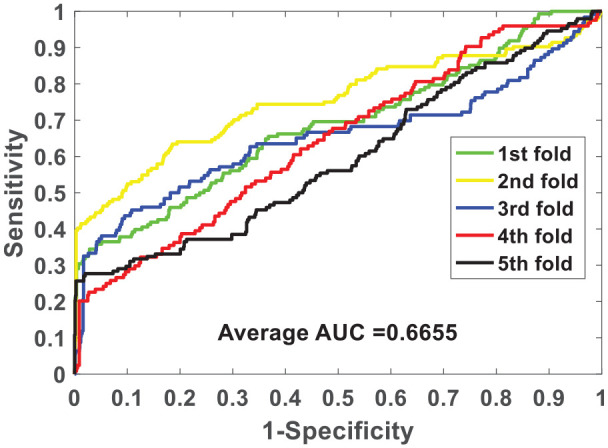
ROC curves of five-fold cross-validated performed by NLPEI on yeast data set.
Comparison with different classifier models
In the experiment, we use ELM as classifier to construct the NLPEI model. To verify whether the ELM classifier can help improve the performance of the model, we use K-Nearest Neighbor (KNN) and Random Forest (RF) classifiers to replace it to build new models and implement them on human and yeast data sets. Table 3 summarizes the five-fold cross-validation results of the KNN and RF classifier models on human data set. It can be seen from the table that KNN classifier model achieves 91.35%, 99.05%, 92.12%, and 52.49% accuracy, specificity, NPV, and AUC. And the RF classifier model achieved 89.58%, 96.83%, 92.21%, and 52.99% accuracy, specificity, NPV, and AUC. For the convenience of comparison, we show the results obtained by different classifier models in the form of histograms. As can be seen from Figure 6, the NLPEI model achieved the best performance and obtained the highest experimental results among all evaluation criteria.
Table 3.
The five-fold cross-validation results performed by KNN and RF classifier models on human data set.
| Model | Testing set | First fold (%) | Second fold (%) | Third fold (%) | Fourth fold (%) | Fifth fold (%) | Average (%) |
|---|---|---|---|---|---|---|---|
| KNN | Acc. | 91.26 | 91.55 | 91.12 | 91.75 | 91.09 | 91.35 ± 0.29 |
| Spe. | 98.87 | 99.00 | 98.96 | 99.28 | 99.12 | 99.05 ± 0.16 | |
| NPV | 92.18 | 92.36 | 91.95 | 92.33 | 91.78 | 92.12 ± 0.25 | |
| AUC | 56.57 | 51.70 | 50.28 | 49.65 | 54.25 | 52.49 ± 2.89 | |
| RF | Acc. | 89.65 | 89.91 | 89.34 | 89.62 | 89.40 | 89.58 ± 0.23 |
| Spe. | 97.09 | 96.90 | 96.67 | 96.50 | 96.98 | 96.83 ± 0.24 | |
| NPV | 92.07 | 92.48 | 92.08 | 92.54 | 91.86 | 92.21 ± 0.29 | |
| AUC | 56.27 | 52.24 | 51.67 | 50.98 | 53.76 | 52.99 ± 2.10 |
Figure 6.
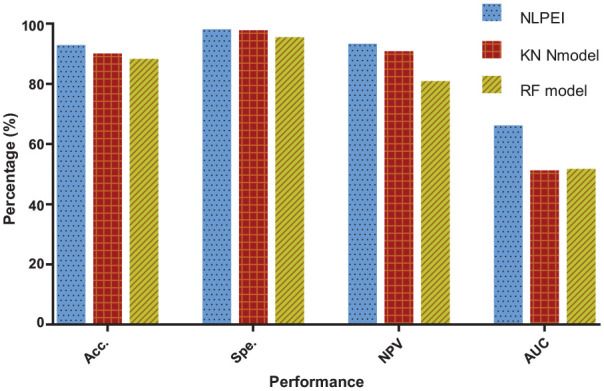
Comparison of different classifier models on human dataset.
The results generated by the KNN and RF classifier models on yeast data set are listed in Table 4. It can be seen from the table that the KNN classifier model obtained 87.57%, 97.70%, 89.29%, 55.10% accuracy, specificity, NPV, and AUC. The RF classifier model achieved values of 85.44%, 94.85%, 89.37%, and 55.12% among these evaluation criteria. Figure 7 shows the comparison results of different classifier models on yeast data set. It can be seen from the figure that the NLPEI model also achieved the best results among all evaluation criteria. Through the experimental results on 2 gold standard SIPs data sets, we can see that the proposed model achieved the best results among all the evaluation criteria and showed the best performance. This result indicated that the ELM classifier we introduced is very suitable for the proposed model and can help to significantly improve the model performance.
Table 4.
The five-fold cross-validation results performed by KNN and RF classifier models on yeast data set.
| Model | Testing set | First fold (%) | Second fold (%) | Third fold (%) | Fourth fold (%) | Fifth fold (%) | Average (%) |
|---|---|---|---|---|---|---|---|
| KNN | Acc. | 88.02 | 88.26 | 87.06 | 86.74 | 87.79 | 87.57 ± 0.65 |
| Spe. | 97.48 | 98.19 | 97.28 | 98.07 | 97.47 | 97.70 ± 0.41 | |
| NPV | 89.93 | 89.60 | 89.13 | 88.10 | 89.68 | 89.29 ± 0.73 | |
| AUC | 63.71 | 49.41 | 50.08 | 54.83 | 57.48 | 55.10 ± 5.86 | |
| RF | Acc. | 85.85 | 85.77 | 86.09 | 84.24 | 85.22 | 85.44 ± 0.74 |
| Spe. | 94.41 | 94.94 | 95.65 | 94.66 | 94.57 | 94.85 ± 0.49 | |
| NPV | 90.18 | 89.67 | 89.42 | 88.17 | 89.39 | 89.37 ± 0.74 | |
| AUC | 62.88 | 50.20 | 50.36 | 55.05 | 57.10 | 55.12 ± 5.27 |
Figure 7.
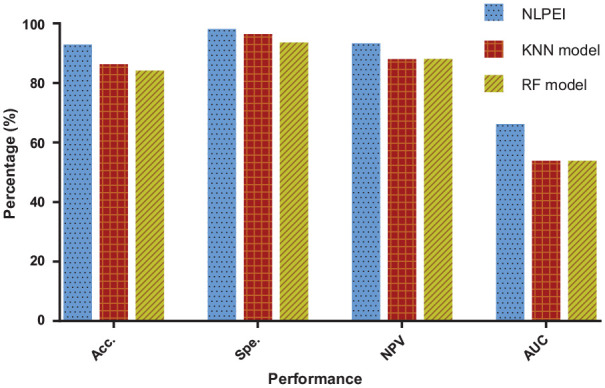
Comparison of different classifier models on yeast dataset.
Comparison with different feature descriptor models
In the experiment, we fused natural language features and evolutionary features to construct the NLPEI model. To verify whether the fused features can help improve the performance of the model, we conducted experiments using Auto Covariance (AC), Discrete Cosine Transform (DCT), and separate natural language (NL) feature models. Table 5 summarizes the five-fold cross-validation results generated by the different feature descriptor models on human data set. It can be seen from the table that the AC, DCT, and NL feature models have achieved 91.81%, 91.05%, and 91.68% prediction accuracy, respectively. Table 6 lists the five-fold cross-validation results generated by different feature descriptor models on yeast data set. Among them, the AC, DCT, and NL feature descriptor models achieved 87.64%, 88.31%, and 88.41% prediction accuracy, respectively.
Table 5.
The five-fold cross-validation results performed by AC, DCT, and NL feature descriptor models on human data set.
| Model | Testing set | First fold (%) | Second fold (%) | Third fold (%) | Fourth fold (%) | Fifth fold (%) | Average (%) |
|---|---|---|---|---|---|---|---|
| AC | Acc. | 91.86 | 91.22 | 92.17 | 91.68 | 92.12 | 91.81 ± 0.38 |
| Spe. | 99.94 | 99.94 | 99.91 | 99.84 | 99.97 | 99.92 ± 0.05 | |
| NPV | 91.89 | 91.26 | 92.25 | 91.80 | 92.13 | 91.87 ± 0.38 | |
| AUC | 52.02 | 51.05 | 46.55 | 47.87 | 48.93 | 49.28 ± 2.25 | |
| DCT | Acc. | 90.19 | 91.31 | 91.02 | 91.40 | 91.32 | 91.05 ± 0.50 |
| Spe. | 98.70 | 99.02 | 98.78 | 98.14 | 98.75 | 98.68 ± 0.33 | |
| NPV | 91.22 | 92.07 | 92.02 | 92.97 | 92.33 | 92.12 ± 0.63 | |
| AUC | 49.69 | 52.79 | 50.51 | 49.88 | 49.78 | 50.53 ± 1.30 | |
| NL | Acc. | 91.02 | 91.51 | 92.43 | 91.71 | 91.72 | 91.68 ± 0.51 |
| Spe. | 99.97 | 99.94 | 100.00 | 99.97 | 99.97 | 99.97 ± 0.02 | |
| NPV | 91.05 | 91.56 | 92.43 | 91.74 | 91.75 | 91.71 ± 0.50 | |
| AUC | 48.13 | 52.56 | 51.69 | 49.42 | 48.88 | 50.14 ± 1.90 |
Table 6.
The five-fold cross-validation results performed by AC, DCT, and NL feature descriptor models on yeast data set.
| Model | Testing set | First fold (%) | Second fold (%) | Third fold (%) | Fourth fold (%) | Fifth fold (%) | Average (%) |
|---|---|---|---|---|---|---|---|
| AC | Acc. | 87.06 | 88.50 | 87.70 | 87.78 | 87.15 | 87.64 ± 0.58 |
| Spe. | 98.17 | 98.20 | 98.27 | 97.48 | 97.45 | 97.91 ± 0.41 | |
| NPV | 88.40 | 89.86 | 88.94 | 89.72 | 89.03 | 89.19 ± 0.60 | |
| AUC | 51.67 | 54.92 | 54.69 | 51.27 | 53.59 | 53.23 ± 1.69 | |
| DCT | Acc. | 88.91 | 88.59 | 88.67 | 87.62 | 87.79 | 88.31 ± 0.57 |
| Spe. | 99.19 | 99.46 | 99.19 | 99.09 | 99.45 | 99.27 ± 0.17 | |
| NPV | 89.52 | 88.98 | 89.27 | 88.26 | 88.19 | 88.84 ± 0.60 | |
| AUC | 53.34 | 52.17 | 52.21 | 55.97 | 52.33 | 53.20 ± 1.60 | |
| NL | Acc. | 87.62 | 88.18 | 88.99 | 89.07 | 88.19 | 88.41 ± 0.61 |
| Spe. | 99.63 | 99.82 | 99.91 | 99.91 | 99.73 | 99.80 ± 0.12 | |
| NPV | 87.90 | 88.33 | 89.06 | 89.14 | 88.41 | 88.57 ± 0.52 | |
| AUC | 55.35 | 50.19 | 55.54 | 52.49 | 51.45 | 53.00 ± 2.37 |
Figures 8 and 9 show the comparison results of the evaluation criteria by different feature descriptor models on human and yeast data sets, respectively. From these 2 figures, we can see that the NLPEI model has achieved the best results in accuracy, NPC and AUC. In general, NLPEI is the most competitive among all feature descriptor model comparisons. This result shows that the feature we use that combines natural language information and evolutionary information can better describe the distribution law inside the protein, which is of great help to improve the overall performance of the model. In addition, we also see that the NL feature descriptor model achieved the best results compared to the AC and DCT feature descriptor models. This shows that treating protein sequences as features extracted from natural language has great potential and can effectively describe protein information.
Figure 8.
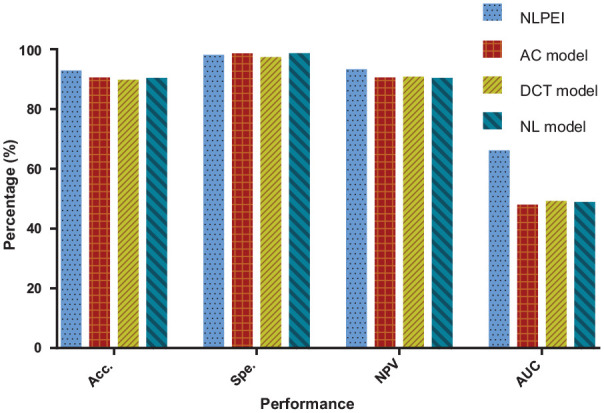
Comparison of different feature descriptor models on human dataset.
Figure 9.
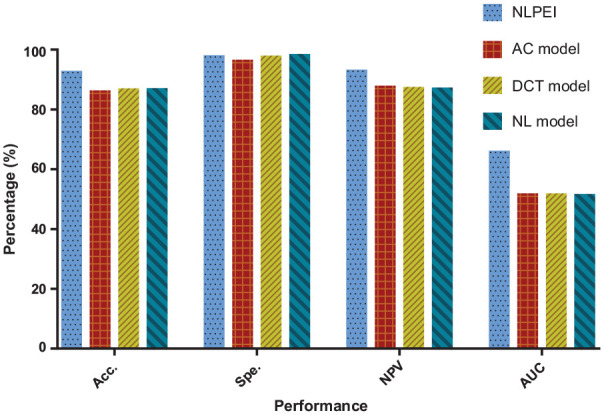
Comparison of different feature descriptor models on yeast dataset.
Comparison with other existing methods
To evaluate the performance of NLPEI model more comprehensively, we compare it with the existing methods including SPAR,22 PSPEL,14 SLIPPER,34 LocFuse,35 and PPIevo.36 These methods are implemented on SIPs data sets human and yeast, and use five-fold cross-validation. Table 7 summarizes the accuracy of the above methods and the proposed model. As can be seen from the table, NLPEI achieved the highest accuracy on human data set, which is 2.1% higher than the second-highest SPAR method and 7.55% higher than the average. On yeast data set, NLPEI also achieved the highest accuracy, 4.43% higher than the second-highest PSPEL method, and 17.56% higher than the average. This comparison result indicates that NLPEI can more accurately predict whether there is self-interaction between proteins compared with other methods.
Table 7.
Comparison of accuracy between NLPEI and other existing methods.
| Data Set | NLPEI (%) | SPAR (%) | PSPEL (%) | SLIPPER (%) | LocFuse (%) | PPIevo (%) |
|---|---|---|---|---|---|---|
| human | 94.19 | 92.09 | 91.30 | 91.10 | 80.66 | 78.04 |
| yeast | 91.29 | 76.96 | 86.86 | 71.90 | 66.66 | 66.28 |
Independent data set assessment
To evaluate the performance of NLPEI model on independent data sets, we conducted independent data set experiments. Specifically, we first train NLPEI with yeast data as training set, and then implement the trained model on human data to evaluate its performance. Similarly, we also use human data as the training set, but the test evaluates the model performance on the yeast data set. The results of the independent data set experiments are summarized in Table 8. As can be seen from the table, NLPEI achieved 90.73% and 88.18% accuracy, 99.65% and 99.82% Spe., 91.02% and 88.33% NPV, 47.96% and 50.24% AUC on human and yeast data sets respectively. The experimental results show that NLPEI has high accuracy in independent data sets and can accurately predict the potential protein self-interaction.
Table 8.
Performance of NLPEI on independent data sets.
| Data Set | Acc. (%) | Spe. (%) | NPV. (%) | AUC. (%) |
|---|---|---|---|---|
| human | 90.73 | 99.65 | 91.02 | 47.96 |
| yeast | 88.18 | 99.82 | 88.33 | 50.24 |
Conclusion
As a major component of cell biochemical reaction network, protein self-interaction plays an important role in regulating cell and their signals. In this study, we designed a computational model NLPEI based on protein sequence to accurately predict SIPs. The model treats protein sequences as natural language, extracts its features through natural language processing algorithms, and fuses with protein evolutionary information to effectively predict whether there is protein self-interaction. In comparison with different classifier models, different feature descriptor models, and other existing methods, NLPEI has shown strong competitiveness. These experimental results indicated that NLPEI was very suitable for predicting potential SIPs and can provide highly reliable candidates for biological experiments.
Acknowledgments
The authors would like to thank all the editors and anonymous reviewers for their constructive advice.
Footnotes
Funding:The author(s) disclosed receipt of the following financial support for the research, authorship, and/or publication of this article: This work is supported in part by the National Natural Science Foundation of China, under Grant 61702444 and 61722212, in part by the Chinese Postdoctoral Science Foundation, under Grant 2019M653804, in part by the West Light Foundation of The Chinese Academy of Sciences, under Grant 2018-XBQNXZ-B-008, in part by the Tianshan youth - Excellent Youth, under Grant 2019Q029, in part by the Qingtan scholar talent project of Zaozhuang University.
Declaration of conflicting interests:The author(s) declared no potential conflicts of interest with respect to the research, authorship, and/or publication of this article.
Author Contributions: Conceptualization, LW and XZ; Data curation, L-PL; Funding acquisition, Z-HY; Methodology, K-JS; Project administration, XY; Writing—original draft, L-NJ.
ORCID iD: Lei Wang  https://orcid.org/0000-0003-0184-307X
References
- 1. Wang L, Wang H-F, Liu S-R, Yan X, Song K-J. Predicting protein-protein interactions from matrix-based protein sequence using convolution neural network and feature-selective rotation forest. Sci Rep. 2019;9:9848. [DOI] [PMC free article] [PubMed] [Google Scholar]
- 2. Zheng K, Wang L, You Z-H. CGMDA: an approach to predict and validate MicroRNA-disease associations by utilizing chaos game representation and LightGBM. IEEE Access. 2019;7:133314-133323. [Google Scholar]
- 3. Li Y, Li L-P, Wang L, Yu C-Q, Wang Z, You Z-H. An ensemble classifier to predict protein-protein interactions by combining PSSM-based evolutionary information with local binary pattern model. Int J Mol Sci. 2019;20:3511. [DOI] [PMC free article] [PubMed] [Google Scholar]
- 4. Pérez-Bercoff Å, Makino T, McLysaght A. Duplicability of self-interacting human genes. BMC Evol Biol. 2010;10:160. [DOI] [PMC free article] [PubMed] [Google Scholar]
- 5. Ispolatov I, Yuryev A, Mazo I, Maslov S. Binding properties and evolution of homodimers in protein-protein interaction networks. Nucleic Acids Res. 2005;33:3629-3635. [DOI] [PMC free article] [PubMed] [Google Scholar]
- 6. Hashimoto K, Nishi H, Bryant S, Panchenko AR. Caught in self-interaction: evolutionary and functional mechanisms of protein homooligomerization. Phys Biol. 2011;8:035007. [DOI] [PMC free article] [PubMed] [Google Scholar]
- 7. UniProt Consortium. UniProt: a hub for protein information. Nucleic Acids Res. 2015;43:D204-D212. [DOI] [PMC free article] [PubMed] [Google Scholar]
- 8. Berman HM, Westbrook J, Feng Z, et al. The protein data bank. Nucleic Acids Res. 2000;28:235-242. [DOI] [PMC free article] [PubMed] [Google Scholar]
- 9. Schneider M, Tognolli M, Bairoch A. The Swiss-Prot protein knowledgebase and ExPASy: providing the plant community with high quality proteomic data and tools. Plant Physiol Biochem. 2004;42:1013-1021. [DOI] [PubMed] [Google Scholar]
- 10. Salwinski L, Miller CS, Smith AJ, Pettit FK, Bowie JU, Eisenberg D. The database of interacting proteins: 2004 update. Nucleic Acids Res. 2004;32:D449-D451. [DOI] [PMC free article] [PubMed] [Google Scholar]
- 11. Oughtred R, Stark C, Breitkreutz B-J, et al. The BioGRID interaction database: 2019 update. Nucleic Acids Res. 2019;47:D529-D541. [DOI] [PMC free article] [PubMed] [Google Scholar]
- 12. Franceschini A, Szklarczyk D, Frankild S, et al. STRING v9. 1: protein-protein interaction networks, with increased coverage and integration. Nucleic Acids Res. 2012;41:D808-D815. [DOI] [PMC free article] [PubMed] [Google Scholar]
- 13. Wang L, Yan X, Liu M-L, Song K-J, Sun X-F, Pan W-W. Prediction of RNA-protein interactions by combining deep convolutional neural network with feature selection ensemble method. J Theor Biol. 2019;461:230-238. [DOI] [PubMed] [Google Scholar]
- 14. Li J-Q, You Z-H, Li X, Ming Z, Chen X. PSPEL: in silico prediction of self-interacting proteins from amino acids sequences using ensemble learning. IEEE/ACM Trans Comput Biol Bioinform. 2017;14:1165-1172. [DOI] [PubMed] [Google Scholar]
- 15. Chen Z-H, Li L-P, He Z, Zhou J-R, Li Y, Wong L. An improved deep forest model for predicting self-interacting proteins from protein sequence using wavelet transformation. Front Genet. 2019;10:90. [DOI] [PMC free article] [PubMed] [Google Scholar]
- 16. Wang Y-B, You Z-H, Li L-P, Huang D-S, Zhou F-F, Yang S. Improving prediction of self-interacting proteins using stacked sparse auto-encoder with PSSM profiles. Int J Biol Sci. 2018;14:983. [DOI] [PMC free article] [PubMed] [Google Scholar]
- 17. Breuer K, Foroushani AK, Laird MR, et al. InnateDB: systems biology of innate immunity and beyond-recent updates and continuing curation. Nucleic Acids Res. 2013;41:D1228-D1233. [DOI] [PMC free article] [PubMed] [Google Scholar]
- 18. Licata L, Briganti L, Peluso D, et al. MINT, the molecular interaction database: 2012 update. Nucleic Acids Res. 2012;40:D857-D861. [DOI] [PMC free article] [PubMed] [Google Scholar]
- 19. Chatr-Aryamontri A, Oughtred R, Boucher L, et al. The BioGRID interaction database: 2017 update. Nucleic Acids Res. 2017;45:D369-D379. [DOI] [PMC free article] [PubMed] [Google Scholar]
- 20. Launay G, Salza R, Multedo D, Thierry-Mieg N, Ricard-Blum S. MatrixDB, the extracellular matrix interaction database: updated content, a new navigator and expanded functionalities. Nucleic Acids Res. 2015;43:D321-D327. [DOI] [PMC free article] [PubMed] [Google Scholar]
- 21. Orchard S, Ammari M, Aranda B, et al. The MIntAct project-IntAct as a common curation platform for 11 molecular interaction databases. Nucleic Acids Res. 2014;42:D358-D363. [DOI] [PMC free article] [PubMed] [Google Scholar]
- 22. Liu X, Yang S, Li C, Zhang Z, Song J. SPAR: a random forest-based predictor for self-interacting proteins with fine-grained domain information. Amino Acids. 2016;48:1655-1665. [DOI] [PubMed] [Google Scholar]
- 23. Zheng K, You Z-H, Wang L, Zhou Y, Li L-P, Li Z-W. Dbmda: a unified embedding for sequence-based mirna similarity measure with applications to predict and validate mirna-disease associations. Mol Ther Nucleic Acids. 2020;19:602-611. [DOI] [PMC free article] [PubMed] [Google Scholar]
- 24. Pan X, Shen H-B. Learning distributed representations of RNA sequences and its application for predicting RNA-protein binding sites with a convolutional neural network. Neurocomputing. 2018;305:51-58. [Google Scholar]
- 25. Gribskov M, McLachlan AD, Eisenberg D. Profile analysis: detection of distantly related proteins. Proc Natl Acad Sci U S A. 1987;84:4355-4358. [DOI] [PMC free article] [PubMed] [Google Scholar]
- 26. Wang L, You Z-H, Chen X, et al. Computational methods for the prediction of drug-target interactions from drug fingerprints and protein sequences by stacked auto-encoder deep neural network. In: Cai Z, Daescu O, Li M, eds. International Symposium on Bioinformatics Research and Applications, Honolulu, HI, 29 May-2 June 2017 Springer; 2017:46-58. [Google Scholar]
- 27. Wang L, You Z-H, Huang D-S, Zhou F. Combining high speed ELM learning with a deep convolutional neural network feature encoding for predicting protein-RNA interactions. IEEE/ACM Trans Comput Biol Bioinform. 2020;17:972-980. [DOI] [PubMed] [Google Scholar]
- 28. Huang GB, Wang DH, Lan Y. Extreme learning machines: a survey. Int J Mach Learn Cybern. 2011;2:107-122. [Google Scholar]
- 29. Wang L, You Z-H, Li Y-M, Zheng K, Huang Y-A. GCNCDA: a new method for predicting circRNA-disease associations based on Graph Convolutional Network Algorithm. PLoS Comput Biol. 2020;16:e1007568. [DOI] [PMC free article] [PubMed] [Google Scholar]
- 30. Wang M-N, You Z-H, Wang L, Li L-P, Zheng K. LDGRNMF: LncRNA-disease associations prediction based on graph regularized non-negative matrix factorization. Neurocomputing. Published online February 24, 2020. doi: 10.1016/j.neucom.2020.02.062 [DOI] [Google Scholar]
- 31. Wang L, You Z-H, Xia S-X, et al. An improved efficient rotation forest algorithm to predict the interactions among proteins. Soft Comput. 2018;22:3373-3381. [Google Scholar]
- 32. Zheng K, You Z-H, Li J-Q, Wang L, Guo Z-H, Huang Y-A. iCDA-CGR: identification of CircRNA-disease associations based on Chaos Game Representation. PLoS Comput Biol. 2020;16:e1007872. [DOI] [PMC free article] [PubMed] [Google Scholar]
- 33. Wang L, You Z-H, Li L-P, Yan X, Zhang W. Incorporating chemical sub-structures and protein evolutionary information for inferring drug-target interactions. Sci Rep. 2020;10:1-11. [DOI] [PMC free article] [PubMed] [Google Scholar]
- 34. Liu Z, Guo F, Zhang J, et al. Proteome-wide prediction of self-interacting proteins based on multiple properties. Mol Cell Proteomics. 2013;12:1689-1700. [DOI] [PMC free article] [PubMed] [Google Scholar]
- 35. Zahiri J, Mohammad-Noori M, Ebrahimpour R, et al. LocFuse: human protein-protein interaction prediction via classifier fusion using protein localization information. Genomics. 2014;104:496-503. [DOI] [PubMed] [Google Scholar]
- 36. Zahiri J, Yaghoubi O, Mohammad-Noori M, Ebrahimpour R, Masoudi-Nejad A. PPIevo: protein-protein interaction prediction from PSSM based evolutionary information. Genomics. 2013;102:237-242. [DOI] [PubMed] [Google Scholar]


