Abstract
Ovarian carcinoma (OC) is one of the 3 most common gynecological malignancies, and the prognosis of patients with lung metastasis was the worst. SEER documented OC patients, diagnosed between 2010 and 2016, were included in the study. Univariable and multivariable logistic regression analyses were performed to identify associated factors for lung metastases (LM) development. Kaplan–Meier analysis was used to estimate the overall survival for OC patients with LM. A total of 10146 eligible serous ovarian cancer (SOC) patients were included, the prevalence of LM was 3.77% (N = 378). Patients with T4 stage (χ2 = 128.515; P = 0.000), N1 stage (χ2 = 49.536; P = 0.000), right laterality (χ2 = 18.756; P = 0.000) (compared with left side), undifferentiated grade (χ2 = 36.174; P = 0.000), bone metastasis (χ2 = 183.529); P = 0.000), brain metastasis (χ2 = 117.539; P = 0.000), liver metastasis (χ2 = 442.472; P = 0.000) had a larger probability of LM than other groups. Results showed that T3/N1 stage, bone metastases, liver metastases, chemotherapy, surgery were positively correlated with LM. Multivariable cox analysis showed that age, bone metastasis, no chemotherapy, no surgery were independent risk factors in SOC-LM patients. This study provided new research insights on the prevalent LM in patients with SOC. The factors associated with LM development and prognosis can be potentially used for LM early screening and professional care.
Keywords: lung metastases, serous ovarian cancer, SEER, nomogram, prognostic factor
Introduction
Ovarian carcinoma (OC) is one of the 3 most common gynecological malignancies.1 Although its incidence is lower than cervical and endometrial cancer, its mortality rate is higher than the former 2. In recent years, the incidence of OC has gradually increased. In 2018, there were approximately 295,000 ovarian cancer cases and 185,000 deaths worldwide.2
Due to late detection, 70% of patients present with advanced cancer with distant metastasis upon diagnosis, and ovarian carcinoma is the leading cause of death among malignant gynecological tumors.3 OC can be transferred by intraperitoneal route, lymphatic route and blood-borne route.4 Deng et al included 1481 patients with OC and found that the most common distant metastatic site was the liver (37.49%), followed by distant lymph nodes (29.36%), lung (28.42%), bone (3.74%), and brain (0.99%). The survival prognosis of patients with lung metastasis was the worst.5 Gardner et al analyzed the 1276 patients with Stage IV OC and found that the proportion of lung metastases was 38%, of liver metastases 57%, of bone metastases 4%, of brain metastases 1%, which the distribution patterns were basically consistent with the Kui Deng’s researches. Among cervical and endometrial cancers, lung metastasis has the highest probability, with both around 60%.6
Currently, surgical resection is mostly used for the lung metastasis of OC,7,8 which is more conductive to long-term survival than radiotherapy and chemotherapy. In addition, for the single lung metastasis, pneumonectomy can not only provide a better prognosis for patients with longer recurrence free intervals, but also provide a better prognosis for patients with chemotherapy-resistant or recurrent tumors.9
Among the various OC types, epithelial OC accounts for about 90%,10 and the most common histological type is serous ovarian carcinoma (SOC). According to the different tissue sources, it can be divided into the high-grade serous carcinoma (HGSOC)11 and the low-grade serous carcinoma.12 At present, there are guidelines for screening for routine lung metastases (LM) in patients with SOC, nor are epidemiological and characteristic data of SOC with LM.
In order to improve the recognition rate of SOC with LM and provide early screening, in this study, based on the Surveillance, Epidemiology, and End Results (SEER) database, the logical regression was used to construct a predicative model for SOC with LM, to evaluate the probability of LM in SOC. The univariate multivariate Cox regression analysis was applied to assess the risk factors and independent prognostic factors for SOC with LM.
Methods and Materials
Data Source
The data was downloaded from SEER database, and we have been allowed to access them for only research using the private SEER ID (17087-Nov 2018). In this study, the patients were from the SEER population-based cancer Registries (2010–2016 dataset). The patients’ age of diagnosis, race, sex, marital status, T stage, N stage, grade, laterality, insurance, histology, survival time, survival status, chemotherapy, radiation, surgery were downloaded.
Inclusion and Exclusion Criteria
Patients were diagnosed with SOC according to the following criteria: (1) patients whose ovarian cancer was defined using the Site recode ICD-0-3 / WHO 2008 (International Classification of Diseases for Oncology, 3 rd edition) was ovary; (2) patients with ovarian cancer diagnosed as the only primary cancer without multiple primary cancer elsewhere; (3) patients aged 18 years or older who were diagnosed; (4) patients with cancer diagnosed by positive histology. Individuals who had unclear T / N stage record, unknown survival time, missing cause of death, unknown tumor grade record, no information concerning laterality, unknown race recode, unknown marital status, unknown positive lymph nodes, or unknown diagnostic confirmation by histology were subsequently excluded.
Statistical Analysis
The demographic and clinical characteristics of patients were defined as follows: age, ethnicity (white, black, and others), marital status (married and unmarried), insurance status (insured, unknown and uninsured), lateral (left, right and bilateral), primary tumor staging (T1, T2, T3 and T4), regional lymph node stage (N0, N1 and NX), tumor grade (well, moderately, poorly and undifferentiated), and whether there were bone metastases, liver metastases, brain metastases, chemotherapy, radiation and surgery. Quantitative data were described as mean ± standard deviation (SD), and differences between groups were analyzed by student’s t-test. Categorical data was expressed as quantity and percentage (N %), and differences were tested by Pearson chi-square test. The risk factors of patients with ovarian serous carcinoma with lung metastasis were determined by univariate and multivariate logistic regression. Overall survival was estimated by the Kaplan–Meier (KM) method, and differences between different groups were compared using a log-rank test. Univariate and multivariate cox regression models were used to analyze the independent prognostic factors of SOC-LM. All statistical analyses were performed using SPSS 23.0 (IBM Corporation, Armonk, NY). In all analyses, a 2-tailed P value of <0.05 was considered statistically significant.
Results
Characteristics of Samples
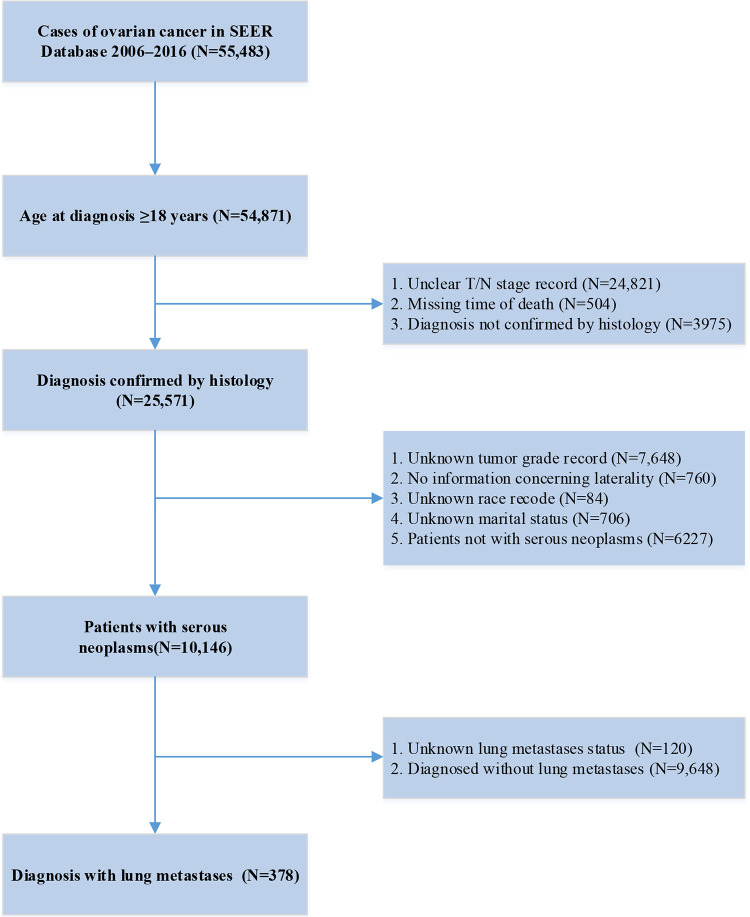
10,146 patients were identified from the SEER database, with a median age of 61 years. 378 had lung metastases and 9648 did not (Table 1). Detailed flow chart for patient selection was shown in Figure 1.
Table 1.
Demographic and Clinical Characteristics for SOC With and Without LM.
| Characteristics | N | |||
|---|---|---|---|---|
| Without LM (N = 9648, 96.23%) |
With LM (N = 378, 3.77%) |
χ2 | p | |
| Race | 7.315 | 0.026 | ||
| Black | 684(95.40%) | 33(4.60%) | ||
| Others | 843(94.82%) | 46(5.18%) | ||
| White | 8121(96.45%) | 299(3.55%) | ||
| Age | 7.228 | 0.007 | ||
| <median | 4777(96.76%) | 160(3.24%) | ||
| ≥median | 4871(95.72%) | 218(4.28%) | ||
| Marital status | 0.516 | 0.472 | ||
| Married | 5396(96.10%) | 219(3.90%) | ||
| Unmarried | 4252(96.40%) | 159(3.60%) | ||
| Insurance | 0.171 | 0.918 | ||
| Insured | 9248(96.22%) | 363(3.88%) | ||
| Uninsured | 335(96.54%) | 12(3.46%) | ||
| Unknown | 65(95.59%) | 3(4.41%) | ||
| T stage | 128.515 | 0.000 | ||
| T0 | 3(60.00%) | 2(40.00%) | ||
| T1 | 1862(99.63%) | 7(0.37%) | ||
| T2 | 1268(97.92%) | 27(2.18% | ||
| T3 | 6456(95.10%) | 333(4.90%) | ||
| T4 | 59(86.76%) | 9(13.24%) | ||
| N stage | 49.536 | 0.000 | ||
| N0 | 6607(97.02%) | 203(2.98%) | ||
| N1 | 2671(95.02%) | 140(4.98%) | ||
| NX | 370(91.36%) | 35(9.64%) | ||
| Laterality | 18.756 | 0.000 | ||
| Left | 2221(97.28%) | 62(2.72%) | ||
| Right | 2331(96.92%) | 74(3.08%) | ||
| Unspecial | 5096(95.47%) | 242(4.53%) | ||
| Grade | 36.174 | 0.000 | ||
| Well differentiated | 778(99.11%) | 7(0.89%) | ||
| Moderately differentiated | 1285(97.94%) | 27(2.06%) | ||
| Poorly differentiated | 3964(95.82%) | 173(4.18%) | ||
| Undifferentiated | 3621(95.49%) | 171(4.51%) | ||
| Bone Met | 183.529 | 0.000 | ||
| No | 9608(96.43%) | 356(3.57%) | ||
| Unknown | 15(55.56%) | 12(44.44%) | ||
| Yes | 25(71.43%) | 10(29.57%) | ||
| Brain Met | 117.539 | 0.000 | ||
| No | 9621(96.35%) | 364(3.65%) | ||
| Unknown | 20(60.61%) | 13(39.39%) | ||
| Yes | 7(87.50%) | 1(22.50%) | ||
| Liver Met | 442.472 | 0.000 | ||
| No | 9241(96.70%) | 286(3.30%) | ||
| Unknown | 11(40.74%) | 16(59.26%) | ||
| Yes | 396(83.90%) | 76(16.10%) | ||
| Chemotherapy | 28.935 | 0.000 | ||
| Yes | 8894(96.51%) | 321(3.49%) | ||
| No/Unknown | 754(92.97%) | 57(7.03%) | ||
| Radiation-therapy | 0.475 | 0.491 | ||
| Yes | 833(95.75%) | 37(4.25%) | ||
| No/Unknown | 8815(96.28%) | 341(3.72%) | ||
| Surgery | 18.816 | 0.000 | ||
| Yes | 9490(96.35%) | 360(3.65%) | ||
| No/Unknown | 158(89.77%) | 18(10.23%) | ||
Figure 1.
Flow chart.
Prevalence of LM
378 cases of SOC were diagnosed with LM (3.77%), and there were significantly between different clinical features. For example, the group of over 61 years old had a greater-probability of LM than the group under 61 years old (χ2 = 7.228; P = 0.007); Patients with T4 stage (χ2 = 128.515; P = 0.000), N1 stage (χ2 = 49.536; P = 0.000), right laterality (χ2 = 18.756; P = 0.000)(compared with left side), undifferentiated grade (χ2 = 36.174; P = 0.000), bone metastasis (χ2 = 183.529; P = 0.000), brain metastasis (χ2 = 117.539; P = 0.000), liver metastasis (χ2 = 442.472; P = 0.000), chemotherapy (χ2 = 28.935; P = 0.000), surgery(χ2 = 18.816; P = 0.000) had a larger probability of LM than other groups.
Logistic Regression Analysis on Risk Factors of SOC-LM
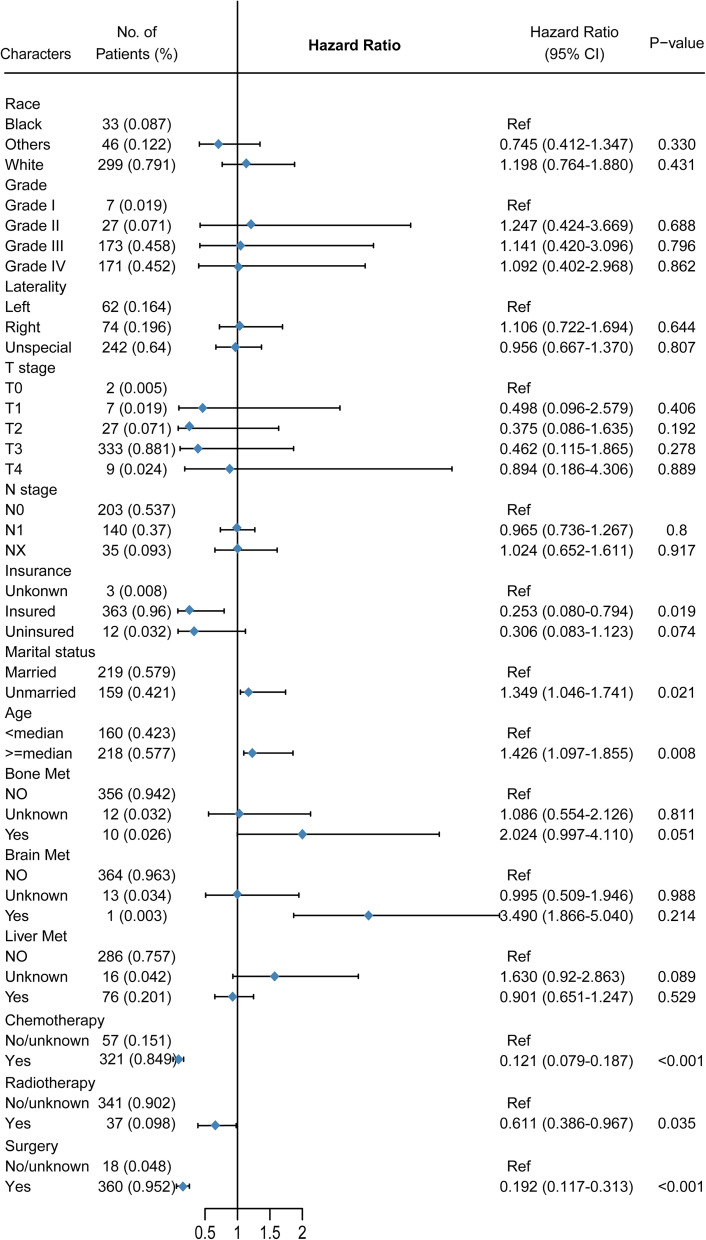
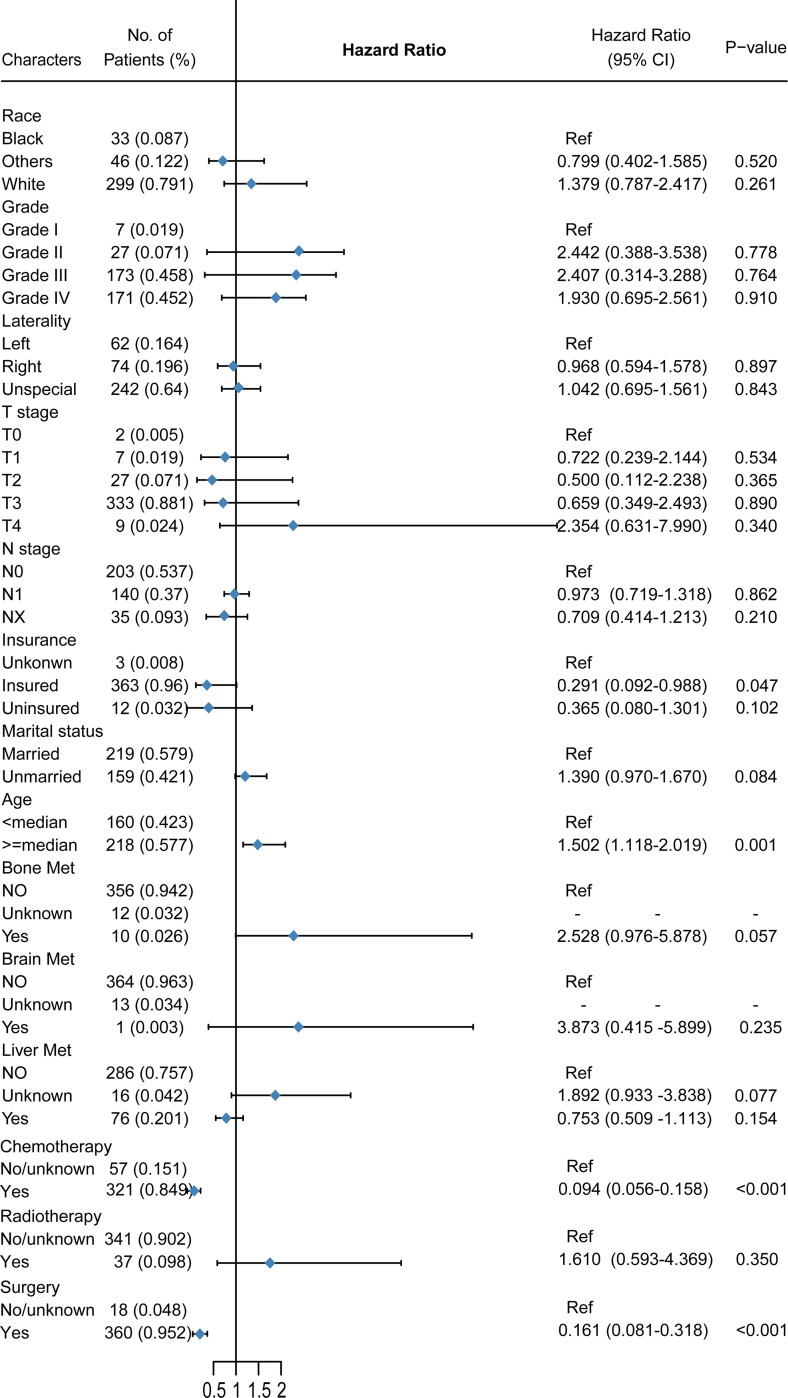
Univariate and multivariate logistic regression showed that many factors were related to the occurrence of LM (Table 2). Univariate logistic regression showed that age greater than 61, higher T stage, N1 stage, unspecified laterality, undifferentiated grade, bone metastasis (compared with none-met), liver metastasis (compared with none-met), chemotherapy(compared with none-chemotherapy), no surgery(compared with surgery) were positively related with SOC-LM (Figures 2 and 3, Tables 2 and 3).
Table 2.
Univariable and Multivariable Logistic Regression for Analyzing the Associated Factors for Developing Lung Metastases in Serous Ovarian Cancer Patients.
| Variable | Univariable | Multivariable | ||||
|---|---|---|---|---|---|---|
| OR | 95% CI | p | OR | 95% CI | p | |
| Race | ||||||
| Black | Reference | Reference | ||||
| Others | 1.13 | 0.72-1.79 | 0.599 | 1.42 | 0.85-2.38 | 0.186 |
| White | 0.76 | 0.53-1.10 | 0.150 | 0.9 | 0.59-1.38 | 0.628 |
| Age | ||||||
| <median | Reference | Reference | ||||
| ≥median | 1.34 | 1.09-1.64 | 0.006 | 1.26 | 1-1.6 | 0.048 |
| Marital status | ||||||
| Married | Reference | Reference | ||||
| Unmarried | 0.92 | 0.75-1.13 | 0.441 | 0.91 | 0.72-1.15 | 0.429 |
| Insurance | ||||||
| Unkonwn | Reference | Reference | ||||
| Uninsured | 0.78 | 0.21-2.83 | 0.701 | 0.95 | 0.24-3.73 | 0.94 |
| Insured | 0.85 | 0.27-2.72 | 0.785 | 0.81 | 0.24-2.77 | 0.742 |
| T stage | ||||||
| T0 | Reference | Reference | ||||
| T1 | 1.37 | 1.05-3.67 | < 0.001 | 1.58 | 1.02-4.05 | < 0.001 |
| T2 | 5.66 | 2.46-13.05 | < 0.001 | 4.24 | 1.80-9.97 | < 0.001 |
| T3 | 13.72 | 6.48-29.05 | < 0.001 | 8.26 | 3.87-18.41 | < 0.001 |
| Tx | 40.58 | 14.61-112.66 | < 0.001 | 13.83 | 4.57-43.28 | < 0.001 |
| N stage | ||||||
| N0 | Reference | Reference | ||||
| N1 | 1.71 | 1.37-2.13 | < 0.001 | 1.18 | 0.93-1.5 | 0.181 |
| NX | 3.08 | 2.12-4.47 | < 0.001 | 1.64 | 1.07-2.51 | 0.024 |
| Laterality | ||||||
| Left | Reference | Reference | ||||
| Right | 1.14 | 0.81-1.6 | 0.462 | 1.01 | 0.69-1.47 | 0.969 |
| Unspecial | 1.7 | 1.28-2.26 | < 0.001 | 1.00 | 0.73-1.38 | 0.98 |
| Grade | ||||||
| Well differentiated | Reference | Reference | ||||
| Moderately differentiated | 2.34 | 1.01-5.39 | 0.047 | 1.57 | 0.61-4.04 | 0.349 |
| Poorly differentiated | 4.85 | 2.27-10.37 | < 0.001 | 1.95 | 0.82-4.65 | 0.13 |
| Undifferentiated | 5.25 | 2.46-11.22 | < 0.001 | 2.16 | 0.91-5.14 | 0.082 |
| Bone Met | ||||||
| No | Reference | Reference | ||||
| Unkonwn | 21.59 | 10.03-46.47 | < 0.001 | 2.18 | 0.33-14.32 | 0.418 |
| Yes | 10.8 | 5.15-22.65 | < 0.001 | 4.6 | 1.92-11.04 | < 0.001 |
| Brain Met | ||||||
| No | Reference | Reference | ||||
| Unkonwn | 17.18 | 8.48-34.81 | <0.001 | 3.18 | 0.56-17.94 | 0.19 |
| Yes | 3.78 | 0.46-30.77 | 0.215 | 1.25 | 0.1-15.15 | 0.861 |
| Liver Met | ||||||
| No | Reference | Reference | ||||
| Unkonwn | 47 | 21.62-102.18 | <0.001 | 22.73 | 9.05-57.06 | < 0.001 |
| Yes | 6.2 | 4.72-8.14 | <0.001 | 3.81 | 2.8-5.18 | < 0.001 |
| Chemotherapy | ||||||
| No/Unknown | Reference | Reference | ||||
| Yes | 2.92 | 1.95-4.37 | <0.001 | 2.11 | 1.37-3.27 | < 0.001 |
| Radiation-therapy | ||||||
| No/Unknown | Reference | Reference | ||||
| Yes | 1.15 | 0.81-1.62 | 0.434 | 1.45 | 0.58-3.58 | 0.426 |
| Surgery | ||||||
| No/unknown | Reference | Reference | ||||
| Yes | 0.33 | 0.2,0.55 | <0.001 | 0.55 | 0.3-1 | 0.063 |
Figure 2.
Forest map of univariate analysis.
Figure 3.
Forest map of multivariate analysis.
Table 3.
Univariable and Multivariable analysis of prognostic factors for overall survival in SOC-LM.
| Variable | Univariable | Multivariable | ||||
|---|---|---|---|---|---|---|
| HR | 95% CI | p | HR | 95% CI | p | |
| Race | ||||||
| Black | Reference | Reference | ||||
| Others | 0.745 | 0.412-1.347 | 0.330 | 0.799 | 0.402-1.585 | 0.520 |
| White | 1.198 | 0.764-1.880 | 0.431 | 1.379 | 0.787-2.417 | 0.261 |
| Age | ||||||
| <median | Reference | Reference | ||||
| ≥median | 1.426 | 1.097-1.855 | 0.008 | 1.502 | 1.118-2.019 | 0.001 |
| Marital status | ||||||
| Married | Reference | Reference | ||||
| Unmarried | 1.349 | 1.046-1.741 | 0.021 | 1.390 | 0.970-1.670 | 0.084 |
| Insurance | ||||||
| Unknown | Reference | Reference | ||||
| Uninsured | 0.278 | 0.074-1.036 | 0.056 | 0.365 | 0.080-1.301 | 0.102 |
| Insured | 0.253 | 0.080-0.793 | 0.018 | 0.291 | 0.092-0.988 | 0.047 |
| T stage | ||||||
| T0 | Reference | Reference | ||||
| T1 | 0.498 | 0.096-2.579 | 0.406 | 0.722 | 0.239-2.144 | 0.534 |
| T2 | 0.375 | 0.086-1.635 | 0.192 | 0.500 | 0.112-2.238 | 0.365 |
| T3 | 0.462 | 0.115-1.865 | 0.278 | 0.659 | 0.349-2.493 | 0.890 |
| Tx | 0.894 | 0.186-4.306 | 0.889 | 2.354 | 0.631-7.990 | 0.340 |
| N stage | ||||||
| N0 | Reference | Reference | ||||
| N1 | 0.965 | 0.736-1.267 | 0.799 | 0.973 | 0.719-1.318 | 0.862 |
| NX | 1.024 | 0.652-1.611 | 0.917 | 0.709 | 0.414-1.213 | 0.210 |
| Laterality | ||||||
| Left | Reference | Reference | ||||
| Right | 1.106 | 0.722-1.694 | 0.644 | 0.968 | 0.594-1.578 | 0.897 |
| Unspecial | 0.956 | 0.667-1.370 | 0.807 | 1.042 | 0.695-1.561 | 0.843 |
| Grade | ||||||
| Well differentiated | Reference | Reference | ||||
| Moderately differentiated | 1.247 | 0.424-3.669 | 0.688 | 2.442 | 0.388-3.538 | 0.778 |
| Poorly differentiated | 1.141 | 0.420-3.096 | 0.796 | 2.407 | 0.314-3.288 | 0.764 |
| Undifferentiated | 1.092 | 0.402-2.968 | 0.862 | 1.930 | 0.695-2.561 | 0.910 |
| Bone Met | ||||||
| No | Reference | Reference | ||||
| Unknown | 1.086 | 0.554-2.126 | 0.811 | NA | NA | NA |
| Yes | 2.024 | 0.997-4.110 | 0.051 | 2.528 | 0.976-5.878 | 0.057 |
| Brain Met | ||||||
| No | Reference | Reference | ||||
| Unknown | 0.995 | 0.509-1.946 | 0.988 | NA | NA | NA |
| Yes | 3.490 | 0.489-25.201 | 0.214 | 3.873 | 0.415-5.899 | 0.235 |
| Liver Met | ||||||
| No | Reference | Reference | ||||
| Unknown | 1.630 | 0.928-2.863 | 0.089 | 1.892 | 0.933-3.838 | 0.077 |
| Yes | 0.901 | 0.651-1.247 | 0.529 | 0.753 | 0.509-1.113 | 0.154 |
| Chemotherapy | ||||||
| No/Unknown | Reference | |||||
| Yes | 0.121 | 0.079-0.187 | <0.001 | 0.094 | 0.056-0.158 | <0.001 |
| Radiation-therapy | ||||||
| No/Unknown | Reference | |||||
| Yes | 0.611 | 0.386-0.967 | 0.035 | 1.610 | 0.593-4.369 | 0.350 |
| Surgery | ||||||
| No/unknown | Reference | |||||
| Yes | 0.192 | 0.117-0.313 | <0.001 | 0.161 | 0.081-0.318 | <0.001 |
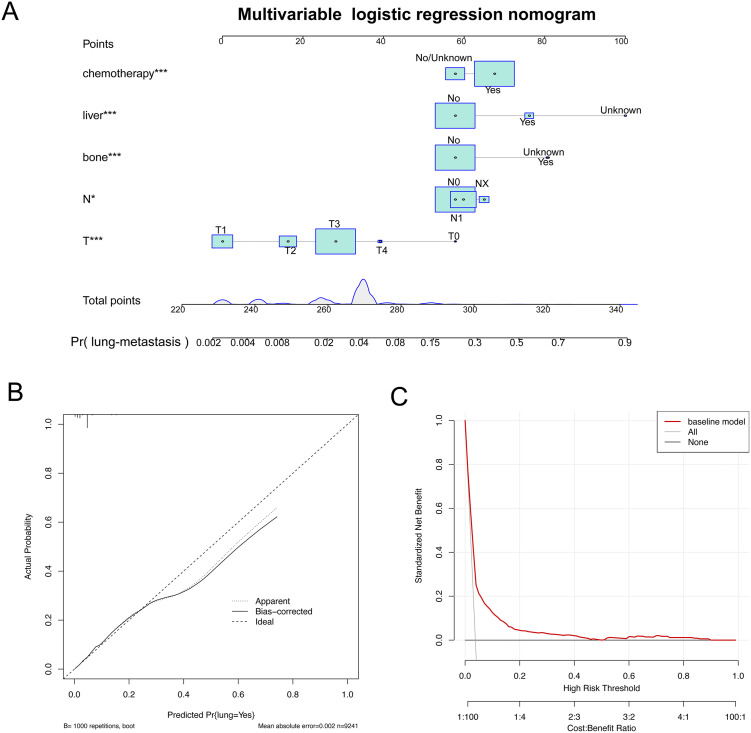
To control confounding factors, multivariate logistic analysis was performed, and the results showed that T/N stage, bone metastases, liver metastases, chemotherapy were positively correlated with LM. Based on the results, a nomogram model to evaluate the probability of LM was constructed, and drew the correction curve and decision curve analysis (DCA) of this model (Figure 4). The results showed that that if the patients has bone metastases, liver metastases, he has a greater probability of lung metastasis. The correction curve showed that this model had a good fitting effect. The DCA curve showed that the logistic regression model had a good net benefit.
Figure 4.
The nomogram of the multivariate logistic regression model. A. Multivariable Logistic Regression nomogram for analyzing the associated factors for developing SOC-LM. B. Calibration plots of SOC-LM associated nomograms in seer datasets. C. Decision curve analysis of the nomograms for SOC-LM in seer datasets.
Univariable and Multivariable Cox Analysis
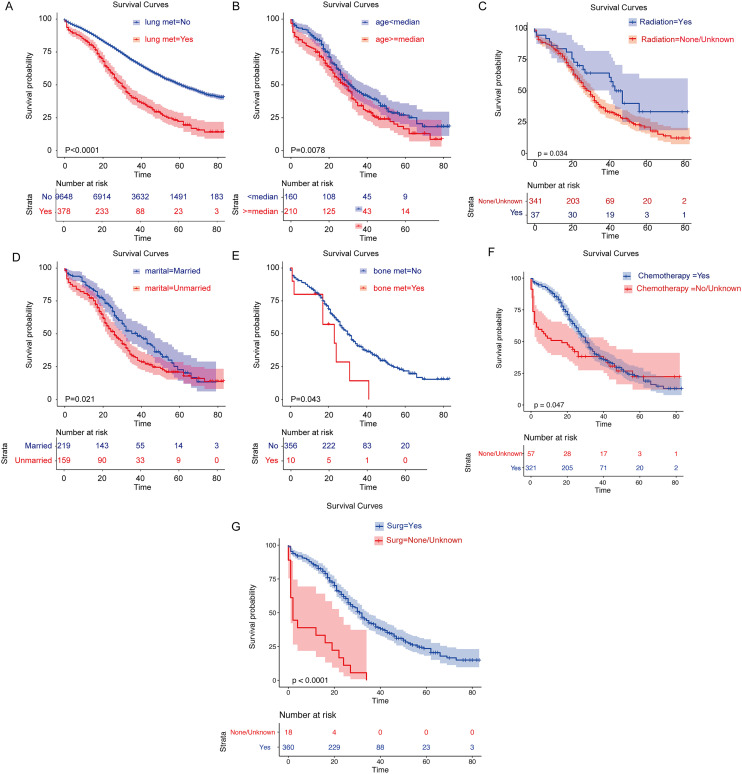
First, based on whether or not LM occurred, survival analysis was performed on SOC, and the results showed that those without LM had higher overall survival (Figure 5A, P < 0.001). Then, stratified overall survival analysis of significant univariable variable based on SCO-LM was performed. KM curves showed that younger age, married status, patients with radiation therapy, patients with chemotherapy, patients with surgery and patients without bone metastases had higher overall survival (Figure 5B-G, P < 0.05). Multivariate cox regression analysis showed that older age (HR = 1.502, p = 0.001) and bone metastasis (HR = 2.528, P = 0.057, marginal significant) were independent risk factors for SOC-LM, chemotherapy (HR = 0.94, P < 0.001), surgery (HR = 0.161, P < 0.001) were independent favorable factors for SOC-LM (Table 3).
Figure 5.
The survival curve of SOC-LM patients
Multivariate Cox analysis focused on the impact of different variables on the survival of patients with SOC-LM.
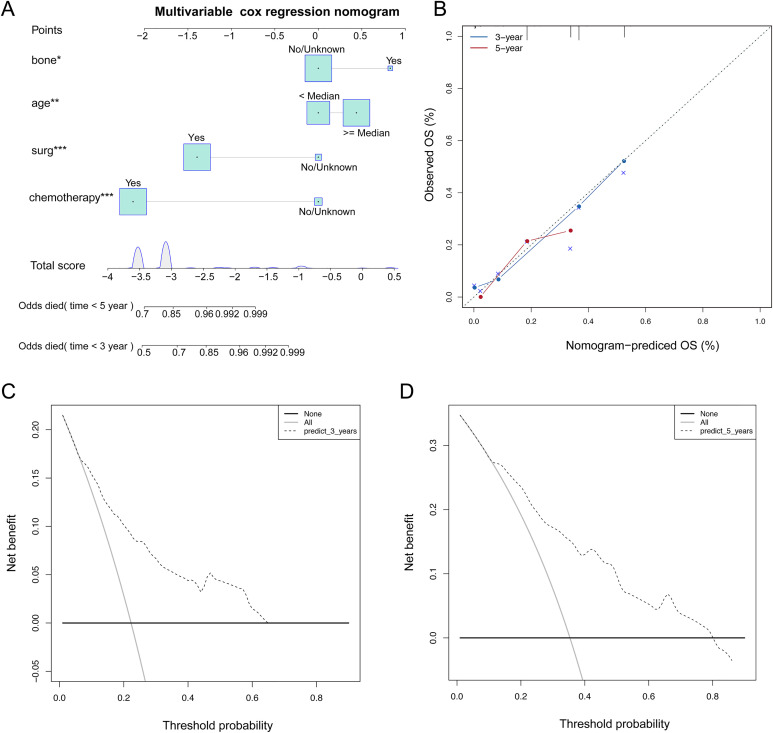
It showed that age ≥ median (HR = 1.502, p = 0.001) and bone metastasis (HR = 2.528, P = 0.057, marginal significant) were independent risk factors for SOC-LM, chemotherapy (HR = 0.94, P < 0.001), surgery (HR = 0.161, P < 0.001) were independent favorable factors for SOC-LM (Table 3). Based on the results, a nomogram model to evaluate the overall survival of SOC-LM was constructed(Figure 6A). “Odds died (time)” stands for the probability of death. According to the “Total points” projected to the corresponding “Odds died (time)” scale, the specific death probability of this patient can be calculated. If the SOC-LM patients has bone metastases, older age, he has a greater higher mortality rate, if he has received chemotherapy or surgery, he will have a lower mortality rate.
Figure 6.
The nomogram of the multivariate cox regression model. A. The nomogram is applied by adding up the points identified on the points scale for each variable. The total points projected on the bottom scales indicate the probability of 3y and 5y OS.B: The calibration curve for predicting 3y and 5y OS for patients with SOC-LM;C-D: The DCA curves can intuitively evaluate the clinical benefit of the nomograms and the scope of application of the nomograms to obtain clinical benefits. The net benefits (Y-axis) as calculated are plotted against the threshold probabilities of patients having 3y and 5y survival on the X-axis.
Calibration plots were used to visualize the performances of the nomograms. The 45°line represented the best prediction. Calibration plots showed that the nomogram performed well (Figure 6B). DCA (Decision Curve Analysis) is a method for evaluating clinical predictive models, diagnostic tests, and molecular markers. In order to prove the advantage of the nomogram. We compared the 3-year and 5-year DCA curves and found that the nomogram showed the good net benefit (Figure 6 C-D).
In short, the predictive nomogram we developed will enable patients with SOC-LM to be managed more accurately in clinical practice
Discussion
This population-based study explored the relationship between SOC with LM, overall survival, and risk factors, which is essential for designing of effective treatment strategies. This study is the first to investigate the risk factors and prognostic factors associated with SOC with LM.
According to our cohort analysis, 3.77% of patients with SOC were diagnosed with LM, which is inconsistent with LM data by others,5,6 because we mainly analyze the subtype of SOC. This indicates to some extent that SOC with LM are rare. We performed the univariate logistic regression analysis to further discover that age, T4 stage, N1 stage, undifferentiated tissue, bone metastases, and brain metastases were related to SOC with LM, which indicates patients with many of above factors should be vigilant during the clinical diagnosis.
A nomogram study of SOC had great significance to clinicians.13,14 At present, there are a considerable number of various types of nomogram models for specialized ovarian cancer research. For example, Rose et al.15 established a nomogram model to predict the prognostic factors that affect the overall survival of advanced ovarian peritoneal cancer after recurrence. Gerestein et al.16 established a predictive model to finally determine the predictors of progress-free survival and overall survival of ovarian cancer patient with platinum-based chemotherapy. The identification of high-risk factors played an important role in guiding clinical diagnosis, however, there are no studies to evaluate the risk factors of SOC-LM. In our research, we included more clinicopathological information, as well as more patients, in order to obtain a wide range of applicability under existing conditions. Based on the clinical information provided by the SEER database, the diagnostic age, marital status, insurance status, primary tumor classification, whether with bone, liver and brain metastasis were included. Multivariate logistic regression analysis was performed, and a nomogram was constructed to evaluate the probability of SOC with LM. The results showed that the probability of lung metastasis could be assessed based on whether the patient had liver metastases, bone metastases, specific N /T stages and chemotherapy.
The identification of prognostic risk factors is also important to guide the clinical precision treatment. Previous studies had shown that LM could significantly worsen the prognosis of cancer patients.17 In our research, the overall survival of the non-LM group is significantly better than that of the LM group in SOC. The stratified analysis of patients in the LM group suggested that older, unmarried status, patients combined bone metastases, patients without receiving chemotherapy and patients without receiving operation had worse overall survival.
Plett et al.18 found that lifetime non-fertile women were twice as likely to have ovarian cancer as married women, and infertility was also a risk factor for ovarian cancer. Chen et al.19 reported that bone metastasis, as a symptom of ovarian cancer in the early stage, had a certain correlation with the occurrence of LM, and could be used as an independent factor to predict LM in ovarian cancer. Zhuang et al.20 proved that patients with bone metastases were more likely to develop lung metastasis by affecting the WNT signaling pathway. This explains the poor prognosis of lung metastasis with bone metastasis to some extent. But we also found that in the LM group, there was no difference in overall survival, whether with or without metastasis in liver or brain.
The study also had some limitations. Firstly, the SOC patients analyzed were limited to those who were identified as SOC at the initial diagnosis,21 and those patients with LM were found in the advanced stages were not included in the study. Secondly, the SEER database lacked comprehensive information of patients,22 such as disease history, smoking dose events, and it only provided four types data about cancer metastasis including brain metastasis, liver metastasis, bone metastasis and lung metastasis, and did not contained adrenal metastasis and other parts metastasis of the body, What’s more, because of a lack of data support from another database, our nomogram may not be validated. This might affect the accuracy of judging patients with lung metastasis. Thus, more databases and hospital data may be needed to further support our conclusion. However, our research has laid the theoretical basis for the occurrence of lung metastasis in serous ovarian cancer to a certain extent.
Conclusions
This study provided new research insights on the prevalent LM in patients with SOC. Logistic regression analysis and nomograms were used to accurately assess the probability of SOC with LM, and multivariable cox analysis were used to identify age and bone metastasis as independent risk factors, chemotherapy and surgery were independent favorable factors for SOC-LM. At the same time, further prospective clinical studies were needed to complement the predictive model established in this study, which could guide preventive treatment and professional care to promote its prognosis.
Acknowledgment
Chengcheng Cao was in charge of designing, planning, conducting, data analysis. Xianghong Yang was in charge of manuscript writing.
Footnotes
Author Contributions: Chengcheng Cao contributed to the planning of the study, drafted the manuscript and revised the manuscript. Xianghong Yang contributed to interpretation of data and review of the manuscript. All the authors reviewed and approved the final manuscript. The manuscript was submitted by Chengcheng Cao.
Declaration of Conflicting Interests: The author(s) declared no potential conflicts of interest with respect to the research, authorship, and/or publication of this article.
Funding: The author(s) received no financial support for the research, authorship, and/or publication of this article.
ORCID iD: Chengcheng Cao  https://orcid.org/0000-0001-8787-4816
References
- 1. Baba K, Hattori T, Koishikawa I, et al. Cavitary pulmonary metastases of gallbladder cancer. Respiration. 1998;65(3):219–222. [DOI] [PubMed] [Google Scholar]
- 2. Ha M, Kim J, Park SM, et al. Prognostic role of zinc finger homeobox 4 in ovarian serous cystadenocarcinoma. Genet Test Mol Biomarkers. 2020;24(3):145–149. [DOI] [PubMed] [Google Scholar]
- 3. Zheng M-J, Li X, H-u YX, et al. Identification of molecular marker associated with ovarian cancer prognosis using bioinformatics analysis and experiments. J Cell Physiol. 2019;234(7):11023–11036. [DOI] [PubMed] [Google Scholar]
- 4. Rose PG, Piver MS, Tsukada Y, Lau TS. Metastatic patterns in histologic variants of ovarian cancer. An autopsy study. Cancer. 1989;64(7):1508–1513. [DOI] [PubMed] [Google Scholar]
- 5. Deng K, Yang C, Tan Q, et al. Sites of distant metastases and overall survival in ovarian cancer: a study of 1481 patients. Gynecol Oncol. 2018;150(3):460–465. [DOI] [PubMed] [Google Scholar]
- 6. Gardner AB, Charo LM, Mann AK, Kapp DS, Eskander RN, Chan JK. Ovarian, uterine, and cervical cancer patients with distant metastases at diagnosis: most common locations and outcomes. Clin Exp Metastasis. 2020;37(1):107–113. [DOI] [PubMed] [Google Scholar]
- 7. Monteiro A, Arce N, Bernardo J, Eugenio L, Antunes MJ. Surgical resection of lung metastases from epithelial tumors. Ann Thorac Surg. 2004;77(2):431–437. [DOI] [PubMed] [Google Scholar]
- 8. Clavero JM, Deschamps C, Cassivi SD, et al. Gynecologic cancers: factors affecting survival after pulmonary metastasectomy. Ann Thorac Surg. 2006;81(6):2004–2007. [DOI] [PubMed] [Google Scholar]
- 9. Adachi M, Mizuno M, Mitsui H, et al. The prognostic impact of pulmonary metastasectomy in recurrent gynecologic cancers: a retrospective single-institution study. Nagoya J Med Sci. 2015;77(3):363–372. [PMC free article] [PubMed] [Google Scholar]
- 10. Armbruster S, Coleman RL, Rauh-Hain JA. Management and treatment of recurrent epithelial ovarian cancer. Hematol Oncol Clin North Am. 2018;32(6):965–982. [DOI] [PubMed] [Google Scholar]
- 11. Freimund AE, Beach JA, Christie EL, Bowtell DDL. Mechanisms of drug resistance in high-grade serous ovarian cancer. Hematol Oncol Clin North Am. 2018;32(6):983–996. [DOI] [PubMed] [Google Scholar]
- 12. Cheng H, Gao C, Zhang R, Yang Z, Zhang G. Two independent incidences of skin metastases in the umbilicus and abdominal wall in ovarian serous adenocarcinoma: a case report and review of the literature. Medicine (Baltimore). 2017;96(49):e9118. [DOI] [PMC free article] [PubMed] [Google Scholar]
- 13. Shim SH, Lee SJ, Kim SO, et al. Nomogram for predicting incomplete cytoreduction in advanced ovarian cancer patients. Gynecol Oncol. 2015;136(1):30–36. [DOI] [PubMed] [Google Scholar]
- 14. Xu XL, Cheng H, Tang MS, et al. A novel nomogram based on LODDS to predict the prognosis of epithelial ovarian cancer. Oncotarget. 2017;8(5):8120–8130. [DOI] [PMC free article] [PubMed] [Google Scholar]
- 15. Rose PG, Java JJ, Salani R, Geller MA, et al. Nomogram for predicting individual survival after recurrence of advanced-stage, high-grade ovarian carcinoma. Obstet Gynecol. 2019;133(2):245–254. [DOI] [PMC free article] [PubMed] [Google Scholar]
- 16. Gerestein CG, Eijkemans MJ, de Jong D, et al. The prediction of progression-free and overall survival in women with an advanced stage of epithelial ovarian carcinoma. BJOG. 2009;116(3):372–380. [DOI] [PubMed] [Google Scholar]
- 17. Graumann J, Finkernagel F, Reinartz S, et al. Multi-platform affinity proteomics identify proteins linked to metastasis and immune suppression in ovarian cancer plasma. Front Oncol. 2019;9:1150. [DOI] [PMC free article] [PubMed] [Google Scholar]
- 18. Plett H, Harter P, Ataseven B, et al. Fertility-sparing surgery and reproductive-outcomes in patients with borderline ovarian tumors. Gynecol Oncol. 2020;157(2):411–417. [DOI] [PubMed] [Google Scholar]
- 19. Chen YL, Hsiao SM, Lin MC, Lin HH. Bone metastasis as the initial presentation in one case of ovarian cancer with two components of endometrioid adenocarcinoma and adenosarcoma. Taiwan J Obstet Gynecol. 2009;48(3):298–301. [DOI] [PubMed] [Google Scholar]
- 20. Zhuang X, Zhang H, Li X, et al. Differential effects on lung and bone metastasis of breast cancer by Wnt signalling inhibitor DKK1. Nat Cell Biol. 2017;19(10):1274–1285. [DOI] [PubMed] [Google Scholar]
- 21. Parikh ND, Marshall VD, Green M, et al. Effectiveness and cost of radiofrequency ablation and stereotactic body radiotherapy for treatment of early-stage hepatocellular carcinoma: An analysis of SEER-Medicare. J Med Imaging Radiat Oncol. 2018;62(5):673–681. [DOI] [PubMed] [Google Scholar]
- 22. Noone AM, Lund JL, Mariotto A, et al. Comparison of SEER treatment data with Medicare claims. Med Care. 2016;54(9):e55–64. [DOI] [PMC free article] [PubMed] [Google Scholar]


