

Abstract
This case series examines the spectrum of imaging findings at chest radiography, US, CT, and MRI in 35 children admitted to a tertiary pediatric hospital in April and May 2020 with a post–coronavirus disease 2019 inflammatory condition known as multisystem inflammatory syndrome in children. The constellation of findings includes airway inflammation and rapid development of pulmonary edema on thoracic images, coronary artery aneurysms, and extensive right iliac fossa inflammatory changes on abdominal images. Awareness of this emerging condition and the expected multi-organ imaging findings will aid radiologists in the assessment of these complex cases.
© RSNA, 2020
Summary
There is a spectrum of imaging findings with a post–coronavirus 2019 inflammatory condition known as multisystem inflammatory syndrome in children; awareness of this emerging condition and the expected multi-organ findings will aid assessment of these complex cases.
Introduction
In April 2020, our tertiary pediatric hospital experienced a surge in the number of children with a multisystem hyperinflammatory syndrome. Presentation included fever, headaches, abdominal symptoms, rash, and conjunctivitis. It was recognized that clinical and laboratory features were similar to those of Kawasaki disease, Kawasaki disease shock syndrome, or toxic shock syndrome (1), although atypical and more severe. Herein we present the spectrum of imaging findings in 35 children with what has been termed multisystem inflammatory syndrome in children (MIS-C) (2) in the United States and pediatric inflammatory multisystem syndrome temporally associated with severe acute respiratory syndrome coronavirus 2 (SARS-CoV-2) infection (3) in the United Kingdom and European Union.
Materials and Methods
Local institutional ethical regulatory approval was not required for this retrospective review of anonymized clinical data. The requirement for informed consent was waived. All images were acquired as standard of care.
Patients
We performed a retrospective review of clinical, laboratory, and imaging findings from the first 35 children younger than 17 years in a clinical database who were admitted to our institution, a tertiary pediatric hospital, and met the case definition for MIS-C (Table 1). The children were admitted from April 14 to May 9, 2020. Another recent article described clinical findings, management strategy, and outcomes for eight of the 35 children (1). That article included some description of coronary artery abnormalities and abdominal imaging findings but was not detailed or exhaustive. Our current article focuses on and presents the imaging findings in these children in more detail and postulates possible mechanisms for these findings.
Table 1:
Case Definitions for Pediatric Post–COVID-19 Hyperinflammatory Syndrome from the Centers for Disease Control and Prevention, Royal College of Pediatrics and Child Health, and World Health Organization

Imaging Protocols
All imaging studies were reported by pediatric radiologists with 4–12 years of experience. For the purposes of this review, two pediatric radiologists reviewed the images in consensus (S.H. and K.H.J., with 5 and 10 years of postfellowship experience, respectively).
US (Epiq 7G and Affiniti 70; Philips, Amsterdam, the Netherlands) was performed by consultant pediatric radiologists or by radiologists-in-training with consultant review. With regard to abdominal US, we considered lymph node enlargement to be a short-axis diameter of greater than 8 mm (7) and bowel wall thickening to be greater than 2 mm (8) from the serosa and/or muscularis propria to the mucosa and/or lumen interface.
CT of the chest was performed with intravenous contrast material by using a Somatom Force scanner (Siemens Healthineers, Erlangen Germany; 384 [2 × 192] slices) optimized for visualization of pulmonary arteries and lung parenchyma.
The standard protocol for cardiac CT was a prospectively electrocardiographically gated, dual-source, high-pitch acquisition with intravenous iodinated contrast material (no beta blockers were used). Coronary artery dimensions were indexed according to current available echocardiographic data (9).
A descriptive analysis is presented.
Results
Patient Characteristics
Thirty-five children (27 boys) with a median age of 11 years (interquartile range, 6–14 years; four of 35 children were younger than 5 years) were admitted with MIS-C. The most common clinical presentation was fever (33 of 35 children, 94%); gastrointestinal symptoms (30 of 35 children, 86%), including abdominal pain, vomiting, and diarrhea; rash (13 of 35 children, 37%; variable distribution including limbs, face, generalized); and conjunctivitis (nine of 35 children, 26%). Twenty-one of the 35 children (60%) presented in shock, with 18 (86%) requiring aggressive fluid resuscitation, and 15 of the 35 children (43%) showed features of pancarditis at echocardiography. Clinical status was severe enough to warrant management in the pediatric intensive care unit in 24 of the 35 children (69%); seven of the 35 patients (20%) required mechanical ventilation and 20 (57%) required inotropic support. Two children required extracorporeal membrane oxygenation due to severe myocardial dysfunction.
All of the children had an abnormal white blood cell count showing a pattern of neutrophilia with lymphopenia. High C-reactive protein, ferritin, d-dimer, troponin, and fibrinogen levels, along with thrombocytopenia and low albumin level, were also common features. Laboratory data are presented in Table 2. All children tested negative for SARS-CoV-2 at reverse-transcription polymerase chain reaction (RT-PCR) assay (AusDiagnostics, Auckland, Australia) on nasopharyngeal and oropharyngeal swabs and/or bronchoalveolar lavage, although one child subsequently tested positive on an oral postmortem sample. Five children had negative stool samples; however, stool samples were not obtained in all children as it was believed to be an unreliable differentiator of acute from convalescent infection due to the recognized longevity of viral shedding in the feces. Thirty children underwent serologic testing for SARS-CoV-2 immunoglobulin G and immunoglobulin M (Epitope Diagnostics, San Diego, Calif) at the time of writing, of whom 27 (90%) were positive (21 for immunoglobulin M and immunoglobulin G, two for immunoglobulin M only, and four for immunoglobulin G only), implying prior exposure or infection.
Table 2:
Laboratory Results of 35 Patients Presenting with Clinical and Laboratory Findings Fitting the Case Definition for MIS-C

Tests for other microbial causes of shock, including Staphylococcus and Streptococcus species, were all negative, as were respiratory viral panel screening in all but two children. One of those two children was positive for entero-rhinovirus and adenovirus at bronchoalveolar lavage, and the other was positive for cytomegalovirus. They were believed to be colonization rather than active infections.
A specialized multidisciplinary approach was required for all children, with supportive and pharmacologic management including ventilatory and inotropic support, intravenous immunoglobulin (2 g/kg), methylprednisolone (10–30 mg/kg; maximum, 1 g), and biologics. All of these children have been discharged, with one death as a result of an extensive right cerebral infarct while on extracorporeal membrane oxygenation.
Imaging findings are described below according to body system (Table 3).
Table 3:
Comparison of Clinical and Radiologic Findings in Children with Acute COVID-19 Respiratory Infection, Kawasaki Disease, and MIS-C Associated with COVID-19

Chest Radiography Findings
All 35 children underwent chest radiography at presentation due to fever, sepsis, or features of multisystem inflammation; 16 of 35 radiographs (46%) were normal. For abnormal radiographs, the most common finding was peribronchial cuffing and perihilar interstitial thickening (12 of 35 patients, 34%) (Figs 1a, 2a). In 11 of the 35 patients (31%) this progressed rapidly to perihilar airspace opacification (Figs 1b, 2b); all of these children had cardiac dysfunction, shock, and underwent fluid resuscitation. Five of the 35 children (14%) had focal perihilar consolidation at admission and four (11%) had small bilateral pleural effusions. Seven of the 35 children (20%) showed atelectatic change, most frequently within the left lower lobe (Fig 3a) but often changing from site to site within days.
Figure 1a:

Thoracic findings in a 15-year-old girl with multisystem inflammatory syndrome in children. (a) Chest radiograph obtained at admission shows mild perihilar bronchial wall cuffing. (b) Chest radiograph obtained on the 3rd day of admission demonstrates extensive airspace opacification with a middle and lower zone predominance. (c, d) Contrast-enhanced axial CT scans of the thorax at day 3 show areas of ground-glass opacification and dense airspace consolidation with air bronchograms (c). This conformed to a mosaic pattern with a bronchocentric distribution to the ground-glass opacification (white arrow in d) involving both central and peripheral lung parenchyma with pleural effusions (black arrow in d).
Figure 2a:

Thoracic findings in a 5-year-old boy with multisystem inflammatory syndrome in children. (a) Initial chest radiograph shows mild perihilar bronchial wall cuffing (arrows). (b) Chest radiograph obtained 4 days later shows worsening perihilar bronchial wall cuffing and interstitial thickening with hazy surrounding airspace consolidation extending toward the peripheries. (c) Coronal and (d) axial contrast-enhanced chest CT scans obtained 1 day after b show diffuse bilateral airspace consolidation with an anteroposterior gradient suggestive of acute respiratory distress syndrome.
Figure 1b:

Thoracic findings in a 15-year-old girl with multisystem inflammatory syndrome in children. (a) Chest radiograph obtained at admission shows mild perihilar bronchial wall cuffing. (b) Chest radiograph obtained on the 3rd day of admission demonstrates extensive airspace opacification with a middle and lower zone predominance. (c, d) Contrast-enhanced axial CT scans of the thorax at day 3 show areas of ground-glass opacification and dense airspace consolidation with air bronchograms (c). This conformed to a mosaic pattern with a bronchocentric distribution to the ground-glass opacification (white arrow in d) involving both central and peripheral lung parenchyma with pleural effusions (black arrow in d).
Figure 2b:

Thoracic findings in a 5-year-old boy with multisystem inflammatory syndrome in children. (a) Initial chest radiograph shows mild perihilar bronchial wall cuffing (arrows). (b) Chest radiograph obtained 4 days later shows worsening perihilar bronchial wall cuffing and interstitial thickening with hazy surrounding airspace consolidation extending toward the peripheries. (c) Coronal and (d) axial contrast-enhanced chest CT scans obtained 1 day after b show diffuse bilateral airspace consolidation with an anteroposterior gradient suggestive of acute respiratory distress syndrome.
Figure 3a:

Range of cardiothoracic imaging findings in multisystem inflammatory syndrome in children (MIS-C). (a) Chest radiograph and (b) axial contrast-enhanced chest CT scan in a 4-year-old boy who presented with fever, rash, abdominal pain, and diarrhea show features of pulmonary edema including perihilar interstitial thickening (arrow in a), septal lines (arrows in b), and pleural effusions (arrowhead in b). Left lower lobe collapse and consolidation (arrowhead in a) was also confirmed at CT (b). (c) Contrast-enhanced cardiac CT scan in an 8-year-old boy with MIS-C noted to have impaired cardiac function and coronary artery aneurysms at echocardiography. Image demonstrates an axial view of the left main stem (black arrow) and left anterior descending (white arrow) coronary arteries. There is medium-sized aneurysmal dilation of the left main stem artery (4.7 × 5.3 mm; z score, +5.8) and a large aneurysm in the proximal left anterior descending artery (6.5 × 7.7 mm; z score, +13.9). (d) Sagittal oblique reconstruction shows the dilatation of the left anterior descending artery (black arrow). In addition, there was a medium-sized aneurysm of the proximal right coronary artery (white arrow) (4.8 x 5.5 mm; z score, +6.7).
Chest CT Findings
Cross-sectional thoracic imaging was performed in three of the 35 children (8%) in the form of contrast material–enhanced volumetric chest CT. The indications for these three CT examinations included clinical features of sepsis and fever of unknown cause (two of three children) and suspicion for pulmonary embolus due to increasing d-dimer level (one of three children).
However, because cardiac CT examinations performed at our institute include the chest (with only omission of the extreme apices and extreme bases), we have included these in our chest findings analysis below (total CT chest images analyzed, 33).
The predominant findings at chest CT were basal consolidation with collapse (13 of 33 children, 39%) and pleural effusions (10 of 33 children, 30%). Three of 33 children (9%) showed diffuse bilateral ground-glass opacification in combination with patchy dense consolidation. In one child this was predominantly bronchocentric with a mosaic pattern affecting all lobes, with a central and peripheral distribution (Fig 1c, 1d). In the second child, this was diffuse airspace consolidation throughout both lungs (Fig 2c, 2d) and in the third child this was basal consolidation (Fig 3b); the latter two both showed an anteroposterior gradient.
Figure 1c:

Thoracic findings in a 15-year-old girl with multisystem inflammatory syndrome in children. (a) Chest radiograph obtained at admission shows mild perihilar bronchial wall cuffing. (b) Chest radiograph obtained on the 3rd day of admission demonstrates extensive airspace opacification with a middle and lower zone predominance. (c, d) Contrast-enhanced axial CT scans of the thorax at day 3 show areas of ground-glass opacification and dense airspace consolidation with air bronchograms (c). This conformed to a mosaic pattern with a bronchocentric distribution to the ground-glass opacification (white arrow in d) involving both central and peripheral lung parenchyma with pleural effusions (black arrow in d).
Figure 1d:

Thoracic findings in a 15-year-old girl with multisystem inflammatory syndrome in children. (a) Chest radiograph obtained at admission shows mild perihilar bronchial wall cuffing. (b) Chest radiograph obtained on the 3rd day of admission demonstrates extensive airspace opacification with a middle and lower zone predominance. (c, d) Contrast-enhanced axial CT scans of the thorax at day 3 show areas of ground-glass opacification and dense airspace consolidation with air bronchograms (c). This conformed to a mosaic pattern with a bronchocentric distribution to the ground-glass opacification (white arrow in d) involving both central and peripheral lung parenchyma with pleural effusions (black arrow in d).
Figure 2c:

Thoracic findings in a 5-year-old boy with multisystem inflammatory syndrome in children. (a) Initial chest radiograph shows mild perihilar bronchial wall cuffing (arrows). (b) Chest radiograph obtained 4 days later shows worsening perihilar bronchial wall cuffing and interstitial thickening with hazy surrounding airspace consolidation extending toward the peripheries. (c) Coronal and (d) axial contrast-enhanced chest CT scans obtained 1 day after b show diffuse bilateral airspace consolidation with an anteroposterior gradient suggestive of acute respiratory distress syndrome.
Figure 2d:

Thoracic findings in a 5-year-old boy with multisystem inflammatory syndrome in children. (a) Initial chest radiograph shows mild perihilar bronchial wall cuffing (arrows). (b) Chest radiograph obtained 4 days later shows worsening perihilar bronchial wall cuffing and interstitial thickening with hazy surrounding airspace consolidation extending toward the peripheries. (c) Coronal and (d) axial contrast-enhanced chest CT scans obtained 1 day after b show diffuse bilateral airspace consolidation with an anteroposterior gradient suggestive of acute respiratory distress syndrome.
Figure 3b:

Range of cardiothoracic imaging findings in multisystem inflammatory syndrome in children (MIS-C). (a) Chest radiograph and (b) axial contrast-enhanced chest CT scan in a 4-year-old boy who presented with fever, rash, abdominal pain, and diarrhea show features of pulmonary edema including perihilar interstitial thickening (arrow in a), septal lines (arrows in b), and pleural effusions (arrowhead in b). Left lower lobe collapse and consolidation (arrowhead in a) was also confirmed at CT (b). (c) Contrast-enhanced cardiac CT scan in an 8-year-old boy with MIS-C noted to have impaired cardiac function and coronary artery aneurysms at echocardiography. Image demonstrates an axial view of the left main stem (black arrow) and left anterior descending (white arrow) coronary arteries. There is medium-sized aneurysmal dilation of the left main stem artery (4.7 × 5.3 mm; z score, +5.8) and a large aneurysm in the proximal left anterior descending artery (6.5 × 7.7 mm; z score, +13.9). (d) Sagittal oblique reconstruction shows the dilatation of the left anterior descending artery (black arrow). In addition, there was a medium-sized aneurysm of the proximal right coronary artery (white arrow) (4.8 x 5.5 mm; z score, +6.7).
One child had numerous foci of small, rounded consolidations with surrounding ground-glass halos (Fig 4). All 33 children who underwent CT were noted to be in a prothrombotic state (raised d-dimer and fibrinogen levels), but none had pulmonary emboli.
Figure 4:

Coronal reconstruction of a contrast-enhanced chest CT scan in a 15-year-old boy who presented with fever, sepsis, and shock. The patient also had impaired cardiac function. Image shows multiple round consolidative foci with surrounding ground-glass halos (arrow).
Other findings included mild hilar lymphadenopathy (nodes measuring 8–12 mm in short-axis diameter) in five of 33 children (15%); all had a normal size and contour of their thymus.
Cardiac CT Findings
Cardiac dysfunction was seen in 18 of the 35 children (51%), with abnormal echocardiographic findings showing deteriorating myocardial function, myocarditis, pancarditis, pericardial effusions, and coronary artery aneurysms. Cardiac CT was performed in 30 of the 35 children (80%) and showed abnormal coronary artery aneurysms in six (20%). Aneurysms ranged from very mild single coronary artery dilatation (eg, left anterior descending artery diameter of 4.3 × 4.1 mm and z score of +2.7) to large aneurysms affecting more than one coronary artery (eg, left anterior descending artery diameter of 6.5 × 7.7 mm and z score of +13.9 in one child) (Fig 3c, 3d). Two children had one coronary artery involved, and four children had two coronary artery systems involved.
Figure 3c:

Range of cardiothoracic imaging findings in multisystem inflammatory syndrome in children (MIS-C). (a) Chest radiograph and (b) axial contrast-enhanced chest CT scan in a 4-year-old boy who presented with fever, rash, abdominal pain, and diarrhea show features of pulmonary edema including perihilar interstitial thickening (arrow in a), septal lines (arrows in b), and pleural effusions (arrowhead in b). Left lower lobe collapse and consolidation (arrowhead in a) was also confirmed at CT (b). (c) Contrast-enhanced cardiac CT scan in an 8-year-old boy with MIS-C noted to have impaired cardiac function and coronary artery aneurysms at echocardiography. Image demonstrates an axial view of the left main stem (black arrow) and left anterior descending (white arrow) coronary arteries. There is medium-sized aneurysmal dilation of the left main stem artery (4.7 × 5.3 mm; z score, +5.8) and a large aneurysm in the proximal left anterior descending artery (6.5 × 7.7 mm; z score, +13.9). (d) Sagittal oblique reconstruction shows the dilatation of the left anterior descending artery (black arrow). In addition, there was a medium-sized aneurysm of the proximal right coronary artery (white arrow) (4.8 x 5.5 mm; z score, +6.7).
Figure 3d:

Range of cardiothoracic imaging findings in multisystem inflammatory syndrome in children (MIS-C). (a) Chest radiograph and (b) axial contrast-enhanced chest CT scan in a 4-year-old boy who presented with fever, rash, abdominal pain, and diarrhea show features of pulmonary edema including perihilar interstitial thickening (arrow in a), septal lines (arrows in b), and pleural effusions (arrowhead in b). Left lower lobe collapse and consolidation (arrowhead in a) was also confirmed at CT (b). (c) Contrast-enhanced cardiac CT scan in an 8-year-old boy with MIS-C noted to have impaired cardiac function and coronary artery aneurysms at echocardiography. Image demonstrates an axial view of the left main stem (black arrow) and left anterior descending (white arrow) coronary arteries. There is medium-sized aneurysmal dilation of the left main stem artery (4.7 × 5.3 mm; z score, +5.8) and a large aneurysm in the proximal left anterior descending artery (6.5 × 7.7 mm; z score, +13.9). (d) Sagittal oblique reconstruction shows the dilatation of the left anterior descending artery (black arrow). In addition, there was a medium-sized aneurysm of the proximal right coronary artery (white arrow) (4.8 x 5.5 mm; z score, +6.7).
Abdominal US Findings
Nineteen of the 35 children (54%) underwent abdominal US because of gastrointestinal symptoms (four examinations were specifically performed to exclude appendicitis), including abdominal pain in all 19 children, diarrhea in 11, and vomiting in four, or for the assessment of hepatosplenomegaly (three of 19 children) and renovascular complications (two of 19 children).
Only one scan was normal. Findings included anechoic free fluid in 10 of 19 children (53%), localized inflammatory change within the right iliac fossa in nine (47%), a combination of echogenic expanded mesenteric fat in seven (37%), and multiple mildly enlarged lymph nodes in nine (47%) (more than three nodes in a localized region; short-axis diameter range, 8–15 mm) (Fig 5a, 5b). In addition, bowel wall thickening occurred in four of the 19 children (21%) and involved the terminal ileum in three children and cecum in one child (Fig 5c, 5d, respectively). A normal appendix was seen in three of the four children in whom acute appendicitis was suspected.
Figure 5a:

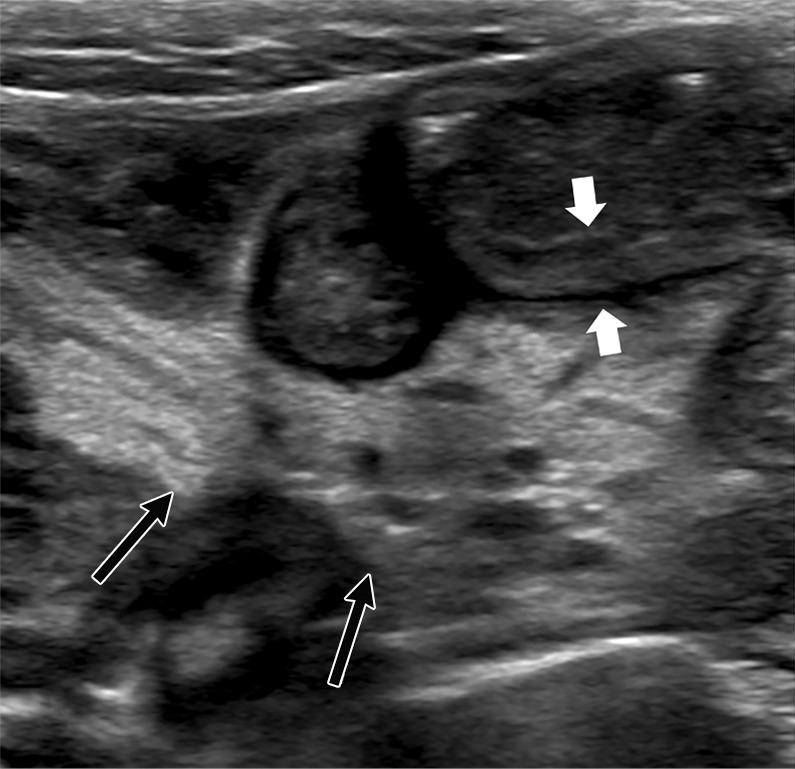
US features of right iliac fossa inflammation in four children. (a) High-frequency sonographic image in 7-year-old boy with multisystem inflammatory syndrome in children (MIS-C) and abdominal pain. Image depicts an enlarged mesenteric lymph node within the right iliac fossa (arrow), with associated hyperechoic mesenteric fat. The appendix is normal in diameter (arrowhead). (b) US scan in a 15-year-old boy with MIS-C. There are multiple mesenteric lymph nodes within the right iliac fossa, and the short-axis diameter of the largest lymph node was 13 mm (calipers). Image also shows associated hyperechoic mesenteric fat (arrow). (c) US scan in 9-year-old boy with MIS-C. Image shows loops of thickened small bowel (between white arrows) with associated hyperechoic mesenteric fat (black arrows). (d) High-frequency US scan in a 16-year-old boy with severe right iliac fossa pain shows marked cecal wall thickening (arrows).
Figure 5b:

US features of right iliac fossa inflammation in four children. (a) High-frequency sonographic image in 7-year-old boy with multisystem inflammatory syndrome in children (MIS-C) and abdominal pain. Image depicts an enlarged mesenteric lymph node within the right iliac fossa (arrow), with associated hyperechoic mesenteric fat. The appendix is normal in diameter (arrowhead). (b) US scan in a 15-year-old boy with MIS-C. There are multiple mesenteric lymph nodes within the right iliac fossa, and the short-axis diameter of the largest lymph node was 13 mm (calipers). Image also shows associated hyperechoic mesenteric fat (arrow). (c) US scan in 9-year-old boy with MIS-C. Image shows loops of thickened small bowel (between white arrows) with associated hyperechoic mesenteric fat (black arrows). (d) High-frequency US scan in a 16-year-old boy with severe right iliac fossa pain shows marked cecal wall thickening (arrows).
Figure 5c:
US features of right iliac fossa inflammation in four children. (a) High-frequency sonographic image in 7-year-old boy with multisystem inflammatory syndrome in children (MIS-C) and abdominal pain. Image depicts an enlarged mesenteric lymph node within the right iliac fossa (arrow), with associated hyperechoic mesenteric fat. The appendix is normal in diameter (arrowhead). (b) US scan in a 15-year-old boy with MIS-C. There are multiple mesenteric lymph nodes within the right iliac fossa, and the short-axis diameter of the largest lymph node was 13 mm (calipers). Image also shows associated hyperechoic mesenteric fat (arrow). (c) US scan in 9-year-old boy with MIS-C. Image shows loops of thickened small bowel (between white arrows) with associated hyperechoic mesenteric fat (black arrows). (d) High-frequency US scan in a 16-year-old boy with severe right iliac fossa pain shows marked cecal wall thickening (arrows).
Figure 5d:

US features of right iliac fossa inflammation in four children. (a) High-frequency sonographic image in 7-year-old boy with multisystem inflammatory syndrome in children (MIS-C) and abdominal pain. Image depicts an enlarged mesenteric lymph node within the right iliac fossa (arrow), with associated hyperechoic mesenteric fat. The appendix is normal in diameter (arrowhead). (b) US scan in a 15-year-old boy with MIS-C. There are multiple mesenteric lymph nodes within the right iliac fossa, and the short-axis diameter of the largest lymph node was 13 mm (calipers). Image also shows associated hyperechoic mesenteric fat (arrow). (c) US scan in 9-year-old boy with MIS-C. Image shows loops of thickened small bowel (between white arrows) with associated hyperechoic mesenteric fat (black arrows). (d) High-frequency US scan in a 16-year-old boy with severe right iliac fossa pain shows marked cecal wall thickening (arrows).
Other findings included increased periportal echogenicity (three of 19 children, 16%) (Fig 6a), pericholecystic edema and mild gallbladder wall thickening (three of 19 children, 16%) (Fig 6a), and gallbladder sludge (three of 19 children, 16%); of note, one child had these findings at initial admission, whereas the other two children demonstrated these findings while in the pediatric intensive care unit. Mild hepatomegaly and borderline enlarged spleen were seen in two children, and a further two children had subcortical, hypoechoic splenic lesions (Fig 6b). Apart from one patient in the pediatric intensive care unit with renal impairment who showed echogenic kidneys (Fig 6a), all renal images were normal.
Figure 6a:

(a) US scan in a 14 year old girl with multisystem infammatory syndrome in children (MIS-C) who presented with abdominal pain, shock, and multi-organ involvement including renal dysfunction. There is gallbladder wall thickening (black arrow) and pericholecystic fluid. Increased periportal echogenicity was noted (white arrow) throughout, and diffusely increased echogenicity of the renal parenchyma (*). (b) US scan in a 15-year-old boy with MIS-C. Image shows a well-defined subcapsular hypoechoic splenic lesion (arrow) that is believed to be an infarct as the clinical course did not conform with this being a splenic abscess, the main other differential diagnosis for this appearance.
Figure 6b:

(a) US scan in a 14 year old girl with multisystem infammatory syndrome in children (MIS-C) who presented with abdominal pain, shock, and multi-organ involvement including renal dysfunction. There is gallbladder wall thickening (black arrow) and pericholecystic fluid. Increased periportal echogenicity was noted (white arrow) throughout, and diffusely increased echogenicity of the renal parenchyma (*). (b) US scan in a 15-year-old boy with MIS-C. Image shows a well-defined subcapsular hypoechoic splenic lesion (arrow) that is believed to be an infarct as the clinical course did not conform with this being a splenic abscess, the main other differential diagnosis for this appearance.
Abdominal CT Findings
Five children underwent abdominal CT (three at outside institutions before transfer) to exclude appendicitis or collections. A normal appendix was identified on all but one CT scan. Three of the five children (60%) showed mesenteric fat stranding and lymphadenopathy within the right iliac fossa, two of which were isolated findings that were also noted on preceding US scans, and one CT scan also showed marked distal ileal and cecal bowel wall thickening (Fig 7a, 7b), making it difficult to delineate the appendix. Four children had free fluid; two of these four children also had periportal and pericholecystic edema. One child had a splenic infarct (Fig 7c).
Figure 7a:

Contrast-enhanced CT scans of the abdomen and pelvis in a 15-year-old boy who presented with abdominal pain and clinical features of sepsis and subsequently diagnosed with multisystem infl ammatory syndrome in children. (a) Coronal image of the abdomen demonstrates gallbladder wall edema (white arrow). There is extensive thickening of the cecal wall thickening (arrowhead) and free fluid within the pelvis (black arrow). (b) Axial slice through the lower abdomen shows the cecal wall thickening (arrow) with multiple adjacent mesenteric nodes (arrowhead) and surrounding fat-stranding. (c) Coronal image through the left upper quadrant shows a focal subcapsular, hypoattenuating region within the spleen in keeping with a splenic infarct (arrow).
Figure 7b:

Contrast-enhanced CT scans of the abdomen and pelvis in a 15-year-old boy who presented with abdominal pain and clinical features of sepsis and subsequently diagnosed with multisystem infl ammatory syndrome in children. (a) Coronal image of the abdomen demonstrates gallbladder wall edema (white arrow). There is extensive thickening of the cecal wall thickening (arrowhead) and free fluid within the pelvis (black arrow). (b) Axial slice through the lower abdomen shows the cecal wall thickening (arrow) with multiple adjacent mesenteric nodes (arrowhead) and surrounding fat-stranding. (c) Coronal image through the left upper quadrant shows a focal subcapsular, hypoattenuating region within the spleen in keeping with a splenic infarct (arrow).
Figure 7c:

Contrast-enhanced CT scans of the abdomen and pelvis in a 15-year-old boy who presented with abdominal pain and clinical features of sepsis and subsequently diagnosed with multisystem infl ammatory syndrome in children. (a) Coronal image of the abdomen demonstrates gallbladder wall edema (white arrow). There is extensive thickening of the cecal wall thickening (arrowhead) and free fluid within the pelvis (black arrow). (b) Axial slice through the lower abdomen shows the cecal wall thickening (arrow) with multiple adjacent mesenteric nodes (arrowhead) and surrounding fat-stranding. (c) Coronal image through the left upper quadrant shows a focal subcapsular, hypoattenuating region within the spleen in keeping with a splenic infarct (arrow).
Neurologic Imaging (CT and MRI) Findings
Six children (16%) underwent brain imaging during their acute illness. CT was performed in four and MRI was performed in three; one child underwent both CT and MRI. Indications included altered neurology and confusion. All studies were normal apart from one CT scan that showed a large anterior and middle cerebral artery infarct in a child who had been on extracorporeal membrane oxygenation for 24 hours.
Discussion
In recent months, a multisystem hyperinflammatory condition has emerged in children in association with prior exposure or infection to severe acute respiratory syndrome coronavirus 2 (1,15). These children present with a wide spectrum of clinical findings, including fever, gastrointestinal symptoms, and rash, with variable disease severity including shock and myocardial injury (16). In this case series, we identify a pattern of imaging findings in post–coronavirus disease 2019 multisystem inflammatory syndrome in children, including airway inflammation, rapidly progressive pulmonary edema, coronary artery aneurysms, and extensive abdominal inflammatory change within the right iliac fossa, with lymphadenopathy and bowel wall thickening.
There is very little in the literature regarding the radiologic findings in MIS-C. A recent prospective observational study summarized radiographic and CT findings of the chest collectively, noting ground-glass opacities, local patchy shadowing, and interstitial abnormalities in eight of 18 children (44%) (17), although the distribution is not detailed. We have noted that central bronchial wall thickening is commonly seen in these children (12 of 35 children, 34%), and with none exhibiting lower respiratory tract symptoms the findings are more likely attributable to airway inflammation. Similar appearances are also recognized in Kawasaki disease. A case series of 129 children with Kawasaki disease showed 15% to have abnormal chest radiographs; dominant features noted were interstitial shadowing (90%), peribronchial cuffing (21%), pleural effusions (16%), and atelectasis (11%). These findings are similar to ours. The authors hypothesized these to be secondary to lower respiratory tract inflammation and/or pulmonary arteritis (18). We have also identified an emerging pattern of pulmonary edema on both radiographs and CT scans; this was likely a consequence of cardiac dysfunction, hypoalbuminemia, fluid overload, or a combination thereof.
Incidental COVID-19 thoracic imaging findings have been reported in asymptomatic individuals (19). However, the extensive ground-glass opacity we have reported on two CT scans showed an atypical distribution compared with those reported in COVID-19 (20). Although this was an initial concern, our findings, along with these children’s clinical course, were more compatible with pulmonary edema. One CT scan showed round consolidations with a surrounding ground-glass halo, a finding classified as typical for COVID-19 (20) that is found more commonly in children (21). Other possibilities for this child, who was negative for SARS-CoV-2 at RT-PCR assay, include inflammatory lesions secondary to a Kawasaki-like vasculitis (22).
Cardiac involvement, although rare, is recognized in severe acute infection with SARS-CoV-2 in both adults and children where myocardial injury or heart failure were features of disease (23). We have reported coronary artery aneurysms, also known to occur in Kawasaki disease (24). However, although MIS-C shares some cardiovascular findings associated with Kawasaki disease, emerging studies indicate that it is a more aggressive form (1,15,16).
Gastrointestinal symptoms were a dominant feature in our case series. Almost half of those imaged showed features of right iliac fossa mesenteric inflammation and lymphadenopathy (nine of 19 children with US [47%] and three of five children with CT [60%]). The pathophysiology of mesenteric lymphadenitis is thought to be either direct microbial infiltration of nodes via the bowel wall, or a secondary reactive lymphoid hyperplasia (25). The right iliac fossa is most affected due to its abundant lymphatic tissue and Peyer patches in the distal ileum. Mesenteric lymphadenitis is a recognized differential diagnosis of acute appendicitis. Tullie et al (26) recently reported on a series of eight children with post–COVID-19 hyperinflammatory syndrome with symptoms mimicking acute appendicitis. Where nonspecific inflammation was seen at US, abdominal CT was performed to look further for the appendix, which was normal in all cases. The authors concluded that the appendix must always be seen. But none of the children in our case series required surgery and their symptoms improved, precluding the need for unnecessary CT. Bowel wall thickening within the right iliac fossa involving the terminal ileum and/or cecum was seen in four of 19 US scans (29%) and one of five CT scans (20%) in our series, again likely due to lymphoid-rich tissue here. This is an uncommon but recognized finding in Kawasaki disease (24). A proposed cause of the gastrointestinal symptoms is bowel wall ischemia secondary to vasculitis (17); we also postulate that cardiac dysfunction and/or shock could contribute to the ileal and cecal wall abnormality seen at imaging, the ileocolic artery being the lowest and most distant branch of the superior mesenteric artery.
In our case series, two children had splenic infarcts, a recognized finding in inflammatory vasculitis and Kawasaki disease, hypothesized to be secondary to splenic artery inflammation (24). We also saw free fluid, gallbladder wall thickening, and pericholecystic and periportal edema, all likely due to systemic inflammation, hypoalbuminemia, serositis, fluid overload, and/or cardiac failure.
Abnormal neurologic images were not a dominant feature in our case series. One child had a large hemispheric infarct, likely secondary to extracorporeal membrane oxygenation, a recognized complication (27). Given the clinical similarities of MIS-C with Kawasaki disease, however, ischemic stroke as a complication of vasculitis remains a possibility; it is also a recognized complication of severe acute respiratory syndrome in patients receiving intravenous immunoglobulin (28), which this child had received.
Our case series has some limitations. The number of children presented is limited and therefore there should be caution in the generalization of our findings to a wider population. In addition, there is recognized diagnostic overlap within the case definition of MIS-C with atypical Kawasaki disease. There is also a wide variability in clinical course within this cohort, with some children undergoing a minimal amount of imaging examinations due to a milder form of illness and others undergoing multiple imaging studies due to disease severity; this may lead to an overrepresentation of abnormal findings. Future studies should include a larger group of patients, ideally using multicenter databases to assess the radiologic findings alongside the complex clinical course of these children. This may help elucidate more specific radiologic findings and the underlying pathogenesis for these.
In conclusion, this case series examines the spectrum of imaging findings in 35 children with multisystem inflammatory syndrome in children associated with coronavirus disease 2019. With these detailed findings and our postulated mechanisms for them, we hope to raise the awareness of this emerging condition among a radiology readership.
Acknowledgments
Acknowledgments
We acknowledge Julia Kenny, PhD, and Sharif Abdullah, FRCR, for critically reviewing the manuscript for intellectual content, and the Evelina London PIMS-TS multidisciplinary clinical team and study group.
Disclosures of Conflicts of Interest: S.H. disclosed no relevant relationships. H.E. disclosed no relevant relationships. C.E.L.R. disclosed no relevant relationships. R.M.F.S. disclosed no relevant relationships. V.S. disclosed no relevant relationships. J.W. disclosed no relevant relationships. K.H.J. disclosed no relevant relationships.
Abbreviations:
- COVID-19
- coronavirus disease 2019
- MIS-C
- multisystem inflammatory syndrome in children
- SARS-CoV-2
- severe acute respiratory syndrome coronavirus 2
References
- 1.Riphagen S, Gomez X, Gonzalez-Martinez C, Wilkinson N, Theocharis P. Hyperinflammatory shock in children during COVID-19 pandemic. Lancet 2020;395(10237):1607–1608. [DOI] [PMC free article] [PubMed] [Google Scholar]
- 2.Multisystem Inflammatory Syndrome in Children (MIS-C) Associated with Coronavirus Disease 2019 (COVID-19). https://emergency.cdc.gov/han/2020/han00432.asp. Accessed May 14, 2020.
- 3.Guidance–COVID-19 paediatric multisystem inflammatory syndrome. Royal College of Paediatrics and Child Health (RCPCH) https://www.rcpch.ac.uk/sites/default/files/2020-05/COVID-19-Paediatric-multisystem-%20inflammatory%20syndrome-20200501.pdf Accessed May 1, 2020. [Google Scholar]
- 4.Centers for Disease Control and Prevention . Emergency preparedness and response: health alert network. Published May 14, 2020. https://emergency.cdc.gov/han/index.asp.
- 5.Royal College of Pediatrics and Child Health . Guidance: pediatric multisystem inflammatory syndrome temporally associated with COVID-19. Accessed May 22, 2020. https://www.rcpch.ac.uk/resources/guidance-paediatric-multisystem-inflammatory-syndrome-temporally-associated-covid-19.
- 6.World Health Organization . Multisystem inflammatory syndrome in children and adolescents with COVID-19. Published May 15, 2020.https://www.who.int/publications/i/item/multisystem-inflammatory-syndrome-in-children-and-adolescents-with-covid-19.
- 7.Karmazyn B, Werner EA, Rejaie B, Applegate KE. Mesenteric lymph nodes in children: what is normal? Pediatr Radiol 2005;35(8):774–777. [DOI] [PubMed] [Google Scholar]
- 8.van Wassenaer EA, de Voogd FAE, van Rijn RR, et al. Bowel ultrasound measurements in healthy children - systematic review and meta-analysis. Pediatr Radiol 2020;50(4):501–508. [DOI] [PMC free article] [PubMed] [Google Scholar]
- 9.Dallaire F, Dahdah N. New equations and a critical appraisal of coronary artery Z scores in healthy children. J Am Soc Echocardiogr 2011;24(1):60–74. [DOI] [PubMed] [Google Scholar]
- 10.Cao Q, Chen YC, Chen CL, Chiu CH. SARS-CoV-2 infection in children: Transmission dynamics and clinical characteristics. J Formos Med Assoc 2020;119(3):670–673. [DOI] [PMC free article] [PubMed] [Google Scholar]
- 11.Hong H, Wang Y, Chung HT, Chen CJ. Clinical characteristics of novel coronavirus disease 2019 (COVID-19) in newborns, infants and children. Pediatr Neonatol 2020;61(2):131–132. [DOI] [PMC free article] [PubMed] [Google Scholar]
- 12.De Rose DU, Piersigilli F, Ronchetti MP, et al. Novel Coronavirus disease (COVID-19) in newborns and infants: what we know so far. Ital J Pediatr 2020;46(1):56. [DOI] [PMC free article] [PubMed] [Google Scholar]
- 13.Son MBF, Newburger JW. Kawasaki Disease. Pediatr Rev 2013;34(4):151–162. [DOI] [PubMed] [Google Scholar]
- 14.Chung CJ, Stein L. Kawasaki disease: a review. Radiology 1998;208(1):25–33. [DOI] [PubMed] [Google Scholar]
- 15.Verdoni L, Mazza A, Gervasoni A, et al. An outbreak of severe Kawasaki-like disease at the Italian epicenter of the SARS-CoV-2 epidemic: an observational cohort study. Lancet 2020;395(10239):1771–1778. [DOI] [PMC free article] [PubMed] [Google Scholar]
- 16.Whittaker E, Bamford A, Kenny J, et al. Clinical Characteristics of 58 Children With a Pediatric Inflammatory Multisystem Syndrome Temporally Associated With SARS-CoV-2. JAMA 2020. 10.1001/jama.2020.10369. Published online June 8, 2020. [DOI] [PMC free article] [PubMed] [Google Scholar]
- 17.Toubiana J, Poirault C, Corsia A, et al. Kawasaki-like multisystem inflammatory syndrome in children during the covid-19 pandemic in Paris, France: prospective observational study. BMJ 2020;369:m2094. [DOI] [PMC free article] [PubMed] [Google Scholar]
- 18.Umezawa T, Saji T, Matsuo N, Odagiri K. Chest x-ray findings in the acute phase of Kawasaki disease. Pediatr Radiol 1989;20(1-2):48–51. [DOI] [PubMed] [Google Scholar]
- 19.Hossain R, Lazarus MS, Roudenko A, et al. CT Scans Obtained for Nonpulmonary Indications: Associated Respiratory Findings of COVID-19. Radiology 2020. 10.1148/radiol.2020201743. Published online May 11, 2020. [DOI] [PMC free article] [PubMed] [Google Scholar]
- 20.Simpson S, Kay FU, Abbara S. et al. Radiological Society of North America Expert Consensus Statement on Reporting Chest CT Findings Related to COVID-19. Endorsed by the Society of Thoracic Radiology, the American College of Radiology, and RSNA. Radiol Cardiothorac Imaging 2020;2(2):e200152. [DOI] [PMC free article] [PubMed] [Google Scholar]
- 21.Xia W, Shao J, Guo Y, Peng X, Li Z, Hu D. Clinical and CT features in pediatric patients with COVID-19 infection: Different points from adults. Pediatr Pulmonol 2020;55(5):1169–1174. [DOI] [PMC free article] [PubMed] [Google Scholar]
- 22.Freeman AF, Crawford SE, Finn LS, et al. Inflammatory pulmonary nodules in Kawasaki disease. Pediatr Pulmonol 2003;36(2):102–106. [DOI] [PubMed] [Google Scholar]
- 23.Blondiaux E, Parisot P, Redheuil A, et al. Cardiac MRI of Children with Multisystem Inflammatory Syndrome (MIS-C) Associated with COVID-19: Case Series. Radiology 2020. 10.1148/radiol.2020202288. Published online June 9, 2020. [DOI] [PMC free article] [PubMed] [Google Scholar]
- 24.Chung CJ, Stein L. Kawasaki disease: a review. Radiology 1998;208(1):25–33. [DOI] [PubMed] [Google Scholar]
- 25.Sivit CJ, Newman KD, Chandra RS. Visualization of enlarged mesenteric lymph nodes at US examination. Clinical significance. Pediatr Radiol 1993;23(6):471–475. [DOI] [PubMed] [Google Scholar]
- 26.Tullie L, Ford K, Bisharat M, et al. Gastrointestinal features in children with COVID-19: an observation of varied presentation in eight children. Lancet Child Adolesc Health 2020;4(7):e19–e20. [DOI] [PMC free article] [PubMed] [Google Scholar]
- 27.Nasr DM, Rabinstein AA. Neurologic Complications of Extracorporeal Membrane Oxygenation. J Clin Neurol 2015;11(4):383–389. [DOI] [PMC free article] [PubMed] [Google Scholar]
- 28.Umapathi T, Kor AC, Venketasubramanian N, et al. Large artery ischaemic stroke in severe acute respiratory syndrome (SARS). J Neurol 2004;251(10):1227–1231. [DOI] [PMC free article] [PubMed] [Google Scholar]