

Abstract
Our goal was to investigate the neuroprotective effects of galantamine in a mouse model of blast-induced indirect traumatic optic neuropathy (bITON). Galantamine is an FDA-approved acetylcholinesterase inhibitor used to treat mild-moderate Alzheimer’s disease. We exposed one eye of an anesthetized mouse to repeat bursts of over-pressurized air to induce traumatic optic neuropathy. Mice were given regular or galantamine-containing water (120 mg/L) ad libitum, beginning immediately after blast and continuing for one month. Electroretinograms and visual evoked potentials were performed just prior to endpoint collection. Histological and biochemical assessments were performed to assess activation of sterile inflammation, axon degeneration, and synaptic changes. Galantamine treatment mitigated visual function deficits induced by our bITON model via preservation of the b-wave of the electroretinogram and the N1 of the visual evoked potential. We also observed a reduction in axon degeneration in the optic nerve as well as decreased rod bipolar cell dendritic retraction. Galantamine also showed anti-inflammatory and antioxidant effects. Galantamine may be a promising treatment for blast-induced indirect traumatic optic neuropathy as well as other optic neuropathies.
Keywords: Blast injury, Galantamine, Optic nerve, Electroretinogram, Visual evoked potential, Oxidative stress, Inflammation, Neurotrauma, Indirect traumatic optic neuropathy
1. Introduction
Eye injuries affect approximately 2.4 million people every year. (Feist and Farber, 1989) Between 2000 and 2010, 186,555 eye injuries occurred worldwide in military hospitals. (Andreotti et al., 2001) Further, up to 40% of monocular blindness is due to ocular trauma. (Aghadoost, 2014) Damage to the optic nerve and retina, resulting in permanent visual deficits, occurred in > 60,000 Veterans with blast-induced traumatic brain injury (TBI) between the years of 2000–2011. (Weichel et al., 2009) Additionally, up to 5% of patients experiencing head trauma will also develop traumatic optic neuropathy (TON). (Steinsapir and Goldberg, 2011; Kumaran et al., 2014) Some of the most common ocular blast injuries include, but are not limited to, hyphema, retinal detachments, retinal edema, TON, and loss of visual field. (WHO, 2018) In cases of direct TON, anatomical disruption of the optic nerve occurs from a projectile penetrating the optic nerve or avulsion. Indirect TON (ITON) results from force transmission to the optic nerve from a distant site without overt damage to the surrounding tissue. (Warner and Eggenberger, 2010; Singman et al., 2016) Patients with ITON can experience severe vision loss, and while some experience limited recovery, they never return to baseline. (Singman et al., 2016; Burke et al., 2019) Corticosteroids or observation alone are the current standards of treatment for patients with ITON. (Volpe and Levin, 2011)
Our lab has developed a model of blast-induced ITON (bITON), utilizing a repeat blast paradigm in order to simulate repeat injuries most often seen in military populations. (Bricker-Anthony et al., 2014; Hines-Beard et al., 2012) This model induces extensive axon degeneration in the optic nerve at two weeks after injury, as well as a decrease in the amplitude and an increase in the latency of the visual evoked potential (VEP). (Bernardo-Colon et al., 2018) It causes an increase in reactive oxygen species (ROS), and secondary activation of the IL-1 pathway, both of which contribute to axon degeneration and vision loss. (Bricker-Anthony et al., 2014; Hines-Beard et al., 2012) Finally, we detected rapid loss of cells in the ganglion cell layer at two days after injury without further progression out to 30 days after injury. (Bernardo-Colón et al., 2019)
Altered levels of neurotransmitters, such as acetylcholine and GABA, occur in several neurodegenerations. (McKee and Robinson, 2014) For example, in Alzheimer’s Disease, decreased levels of acetylcholine correlates with disease progression. (Francis, 2005; Giacobini et al., 1989) Notably, we detected caspase-1 immunolabeling in the cholinergic amacrine cells after single blast injury. (Bricker-Anthony et al., 2014) One of the treatments for mild to moderate Alzheimer’s disease, as well as other myopathies and peripheral neuropathies, is the FDA-approved compound, galantamine. (Lilienfeld, 2002; Durães et al., 2018) Galantamine has multiple modes of actions: it increases acetylcholine via mild inhibition of acetylcholinesterase, it increases GABA release via allosteric modulation of the nicotinic acetylcholine receptor (α7nAChR), and it has been shown to protect neurons against glutamate-induced neurotoxicity. (Lopes et al., 2013) Previous studies have also shown that galantamine can have antioxidant properties; galantamine treatment reduced ROS and increased cell viability after exposure to hydrogen peroxide (Ezoulin et al., 2008; Romero et al., 2010) and protected rat cortical neurons against oxidative stress after exposure to synthetic amyloid β (Melo et al., 2009) It also has been shown to decrease inflammation in a stroke model of rats, by preventing an increase IL-1β levels. (Furukawa et al., 2014) Additional studies have shown that galantamine can protect retinal ganglion cells in a rat model of glaucoma. (Almasieh et al., 2013; Almasieh et al., 2010)
We hypothesized that galantamine would be protective in our model of bITON. Here, we show that oral galantamine, given after bITON, mitigates visual function deficits and axon degeneration in the optic nerve, and that it does so while modulating acetylcholine, glutamate, ROS, and IL-1 levels.
2. Methods
2.1. Mice
Anesthetized C57Bl/6 J mice (Jackson Labs, Bar Harbor, ME) were exposed to two repeat bursts (0.5 s apart) of 15 psi air directed at the left eye once a day for three days in a row. Sham mice were exposed to everything except the air pressure due to a barrier placed between the eye and the barrel of the paintball marker, as previously described. (Hines-Beard et al., 2012; Bernardo-Colon et al., 2018; Bernardo-Colón et al., 2019) Galantamine sham and blast mice were given 120 mg/L of galantamine in their water, which was changed every 72 h (TCI America, Boston, MA). Control mice were given normal water ad libitum for one month, while galantamine-treated mice drank galantamine-containing water for one-month post-injury. Average daily water intake for a laboratory mouse is 4 ml, thus we estimate that the mice consumed 480 micrograms galantamine per day for 30 days. This equates to an average dose of 15.3 mg/kg, based on the average weight of a C57Bl/6 male mouse of 31.4 g. While previous studies administered galantamine intraperitoneally at 1–5 mg/kg, (Shimizu et al., 2015; Kita et al., 2014; Noda et al., 2010) it is important to note that because galantamine is delivered orally, the dose is higher. Experimental procedures were performed in accordance with the Use of Animals in Vision and Ophthalmic research and an approved Vanderbilt University Institutional Animal Care and Use Committee protocol.
2.2. Electroretinograms (ERG) and VEPs
Mice were dark-adapted overnight, dilated with 1% tropicamide for 10 min, and anesthetized with 20/8/0.8 mg/kg ketamine/xylaxine/urethane according to previously published methodology. (Bernardo-Colon et al., 2018) Mice were placed on the heated surface of the ERG system to maintain body temperature. Corneal electrodes with integrated stimulators were placed on eyes lubricated with Genteel drops using the Celeris system (Diagnosys LLC, Lowell, MA). Subdermal platinum needle electrodes were placed in the snout and back of the head at the location of the visual cortex. A ground electrode was placed in the back of the mouse. For VEPs, mice were exposed to 50 flashes of 1 Hz, 0.5 cd.s/m2 white light. To collect ERGs, electrodes were placed on lubricated corneas were placed. Mice were then exposed to 15 flashes of 1 Hz, 1 cd.s/m2.
2.3. Western blot
Single retinas were homogenized and sonicated in lysis buffer and centrifuged. Sample buffer was added to the supernatant just prior to use. Known amounts of protein (10 to 20 μg) or protein ladder were loaded into each well of an SDS-polyacrylamide gel. The Bio-Rad mini-trans blot cell system and mini protean pre-cast gels at 4–20% were used (Hercules, CA). Loading control was GAPDH (rabbit; 1:1000; ab9485, Abcam, Cambridge, MA). The protein was transferred onto nitrocellulose using the Bio-Rad trans blot turbo transfer system (Hercules, CA), probed with anti-SOD2 (rabbit; 1:1000; ab13533; Abcam), probed with secondary antibody (alkaline phosphatase-conjugated AffiniPure Goat Anti-Rabbit IgG; 1:1000; cat #133466; Jackson ImmunoResearch Laboratories) and alkaline phosphatase was used for band detection. Band density was quantified by scanning the blot using an EPSON scanner and Adobe Photoshop to convert to grayscale and invert the image. Each band was selected with the same frame and set measurements were used to obtain the grey mean value for each. (Bernardo-Colon et al., 2018)
2.4. High-performance liquid chromatography (HPLC)
2.4.1. Tissue extraction
The brain sections were homogenized, using a tissue disruptor, in 100–750 ul of 0.1 M TCA, which contained 10−2 M sodium acetate, 10−4 M EDTA, and 10.5% methanol (pH 3.8). Ten microliters of homogenate was used. Then samples were spun in a microcentrifuge at 10,000 g for 20 min. The supernatant was removed for biogenic monoamines analysis.
2.4.2. Biogenic amine analysis using HPLC-ECD
Biogenic amine concentrations were determined in the Vanderbilt University Medical Center Hormone Assay & Analytical Core utilizing an Antec Decade II (oxidation: 0.65) electrochemical detector operated at 33 °C. Twenty microliter samples of the supernatant were injected using a Water 2707 autosampler onto a Phenomenex Kintex C18 HPLC column (100 × 4.60 mm, 2.6um). Biogenic amines were eluted with a mobile phase consisting of 89.5% 0.1 M TCA, 10−2 M sodium acetate, 10−4 M EDTA and 10.5% methanol (pH 3.8). Solvent was delivered at 0.6 ml/min using a Waters 515 HPLC pump. HPLC control and data acquisition were managed by Empower software. Isoproterenol (5 ng/mL) was included in the homogenization buffer for use as a standard to quantify the biogenic amines.
2.4.3. Biogenic amine analysis using LC/MS
Biogenic amines were determined in the Vanderbilt University Medical Center Hormone Assay & Analytical Core by a highly sensitive and specific liquid chromatography/mass spectrometry (LC/MS) methodology following derivatization of analytes with benzoyl chloride (BZC). Five microlitersμ of either tissue extract or microdialysis fluid was added to a 1.5 mL microcentrifuge tube containing 20 μL acetonitrile. Ten microliters each of 500 mM NaCO3 (aqueous) and 2% BZC in acetonitrile was added to each tube. After 2 min, the reaction was stopped by the addition of 20 μL internal standard solution (in 20% acetonitrile containing 3% sulfuric acid) and 40 μL water. The samples were then ready for LC/MS analysis. LC was performed on a 2.0 × 50 mm, 1.7 μm particle Acquity BEH C18 column (Waters Corporation, Milford, MA, USA) using a Waters Acquity UPLC. Mobile phase A was 15% aqueous formic acid and mobile phase B was acetonitrile. Samples were separated by a gradient of 98–5% of mobile phase A over 11 min at a flow rate of 600 μL/min prior to delivery to a SCIEX 6500+ QTrap mass spectrometer.
2.4.4. Protein assay
Protein concentration was determined by BCA Protein Assay Kit (Thermo Scientific). Ten microliters of tissue homogenate was distributed into 96-well plate and 200 μl of mixed BCA reagent (25 ml of Protein Reagent A is mixed with 500 μl of Protein Reagent B) was added. The plate was incubated at room temperature for two hours for the color development. A BSA standard curve was run at the same time. Absorbance was measured by the plate reader (POLARstar Omega), purchased from BMG Labtech Company.
2.5. Multiplex cytokine ELISA
We performed a mouse multiplex mouse cytokine/chemokine magnetic bead panel for IL-1α and IL-1β, loading 25 μl of sample per well. Samples were tested in duplicates and results were averaged. We performed the ELISA according to manufacturer directions (cat #: MCYTOMAG-70 K, Millipore, Burlington, MA).
2.6. Immunohistochemistry
Eyes (n = 40) were preserved in 4% paraformaldehyde, cryoprotected in 30% sucrose overnight at 4 °C and embedded in tissue freezing medium (Triangle Biomedical, Durham, NC). Ten-micron thick sections were collected in round on a cryostat (Fisher, Pittsburgh, PA). Each slide had representative sections from the entire eye. Slides were rinsed with PBS and incubated at room temperature in normal donkey serum (NDS; 0.05%) in 0.1 M phosphate buffer with 0.5% bovine serum albumin and 0.1% Triton X-100 (phosphate buffer plus Triton X-100 [PBT]) for 2 h. The slides were incubated overnight at 4 °C in primary antibody (see Table 1 below) in PBT, then rinsed with PBS and incubated with their appropriate secondary antibody (donkey anti-rabbit, donkey anti-mouse or donkey anti-goat 488 or 594; Life Technologies, Carlsbad, CA) for 2 h at room temperature. Then, slides were rinsed in PBS, mounted in Vectashield Mounting medium with DAPI (DAPI; Vector Laboratories, Burlingame, CA) or Fluoromount-G (Southern Biotech, Birmingham, AL). Slides were imaged on a Nikon Eclipse epifluorescence microscope (Nikon, Melville, NY) or an Olympus FV-1000 confocal microscope. All images were collected from the same retinal region with identical magnification, gain and exposure settings. Fluorescence intensity was quantified via ImageJ. A rectangle was selected around the region of interest, channels were split for multiple antibodies, threshold was adjusted, noise was de-speckled and fluorescence intensity was measured. Fluorescence intensity was normalized to sham mice. Each experimental group included 5 eyes.
Table 1.
Antibodies used for immunohistochemistry.
| Antibody | Concentration | Animal | Catalog number | Company |
|---|---|---|---|---|
| Anti-calbindin D | 1:200 | Mouse | 126M4810V | Sigma-Aldrich, St. Louis, MO |
| Anti-synaptophysin | 1:500 | Rabbit | GR30790220 | Abcam, Cambridge, MA |
| Anti-nitrotyrosine | 1:500 | Rabbit | 2459610 | Millipore, Burlington, MA |
| Anti-PKCα | 1:40 | Mouse | GR3164443 | Abcam, Cambridge, MA |
| Anti-NeuN | 1:200 | Rabbit | MAB377 | Millipore, Burlington, MA |
2.7. Optic nerves
Optic nerves were post-fixed in glutaraldehyde followed by embedding in Resin 812 and Araldite 502 (cat # 14900 and 10,900, Electron Microscopy sciences, Hatfield, PA) according to previous published protocols. (Hines-Beard et al., 2012; Bernardo-Colon et al., 2018; Shimizu et al., 2015; Kita et al., 2014) Leica EM-UC7 microtome was used to collect 1 μm-thick sections. Sections were then stained with 1% paraphenylenediamine and 1% toluidine blue and were imaged on a Nikon Eclipse Ni-E microscope using a 100× oil immersion objective (Nikon Instruments Inc., Melville, NY). The optic nerves were montaged into a 5 × 5 image using the Nikon Elements software. We used the Counting Array and Better Cell Counter plugins to ImageJ, which creates a grid of nine squares overtop the montaged optic nerve. We manually counted healthy and degenerating axons, which are color-coded by the plugins. The grid accounts for 20% of the optic nerve cross-sectional area to avoid bias, and we multiplied these numbers by 5 to estimate total and degenerating axons within the nerve.
2.8. Acetylcholinesterase activity assay
Activity of AChE in the retina was measured using Acetylcholinesterase Colorimetric Assay Kit according to manufacturer’s directions (ab138871, Abcam, Cambridge, MA).
2.9. Experimental design and statistical analysis
Western blot data was normalized to loading controls. Data were analyzed using GraphPad Prism (La Jolla, CA). All experimental groups were compared to each other using a one-way ANOVA and the Tukey post-hoc test. All groups are shown (mean ± SEM).
3. Results
3.1. Oral galantamine reached bioactive levels in the mouse retina
To determine if galantamine entered the retina and was active, we quantified acetylcholinesterase activity (Fig. 1A) and acetylcholine levels (Fig. 1B). Interestingly, control bITON retinas had a slight, but statistically significant increase in acetylcholinesterase activity in comparison to control shams, 0.48 ± 0.03 U/mg (mean ± SEM) and 0.42 ± 0.01 U/mg, respectively (p < .05; Fig. 1A). Acetylcholinesterase activity was decreased in both galantamine sham (0.28 ± 0.01 U/mg) and galantamine bITON (0.34 ± 0.08 U/mg) groups, as compared to its control, p < .001 for both galantamine groups (Fig. 1A). Interestingly, there is also a statistically significant increase in acetylcholinesterase activity between galantamine-sham and galantamine-bITON mice, p < .05.
Fig. 1.
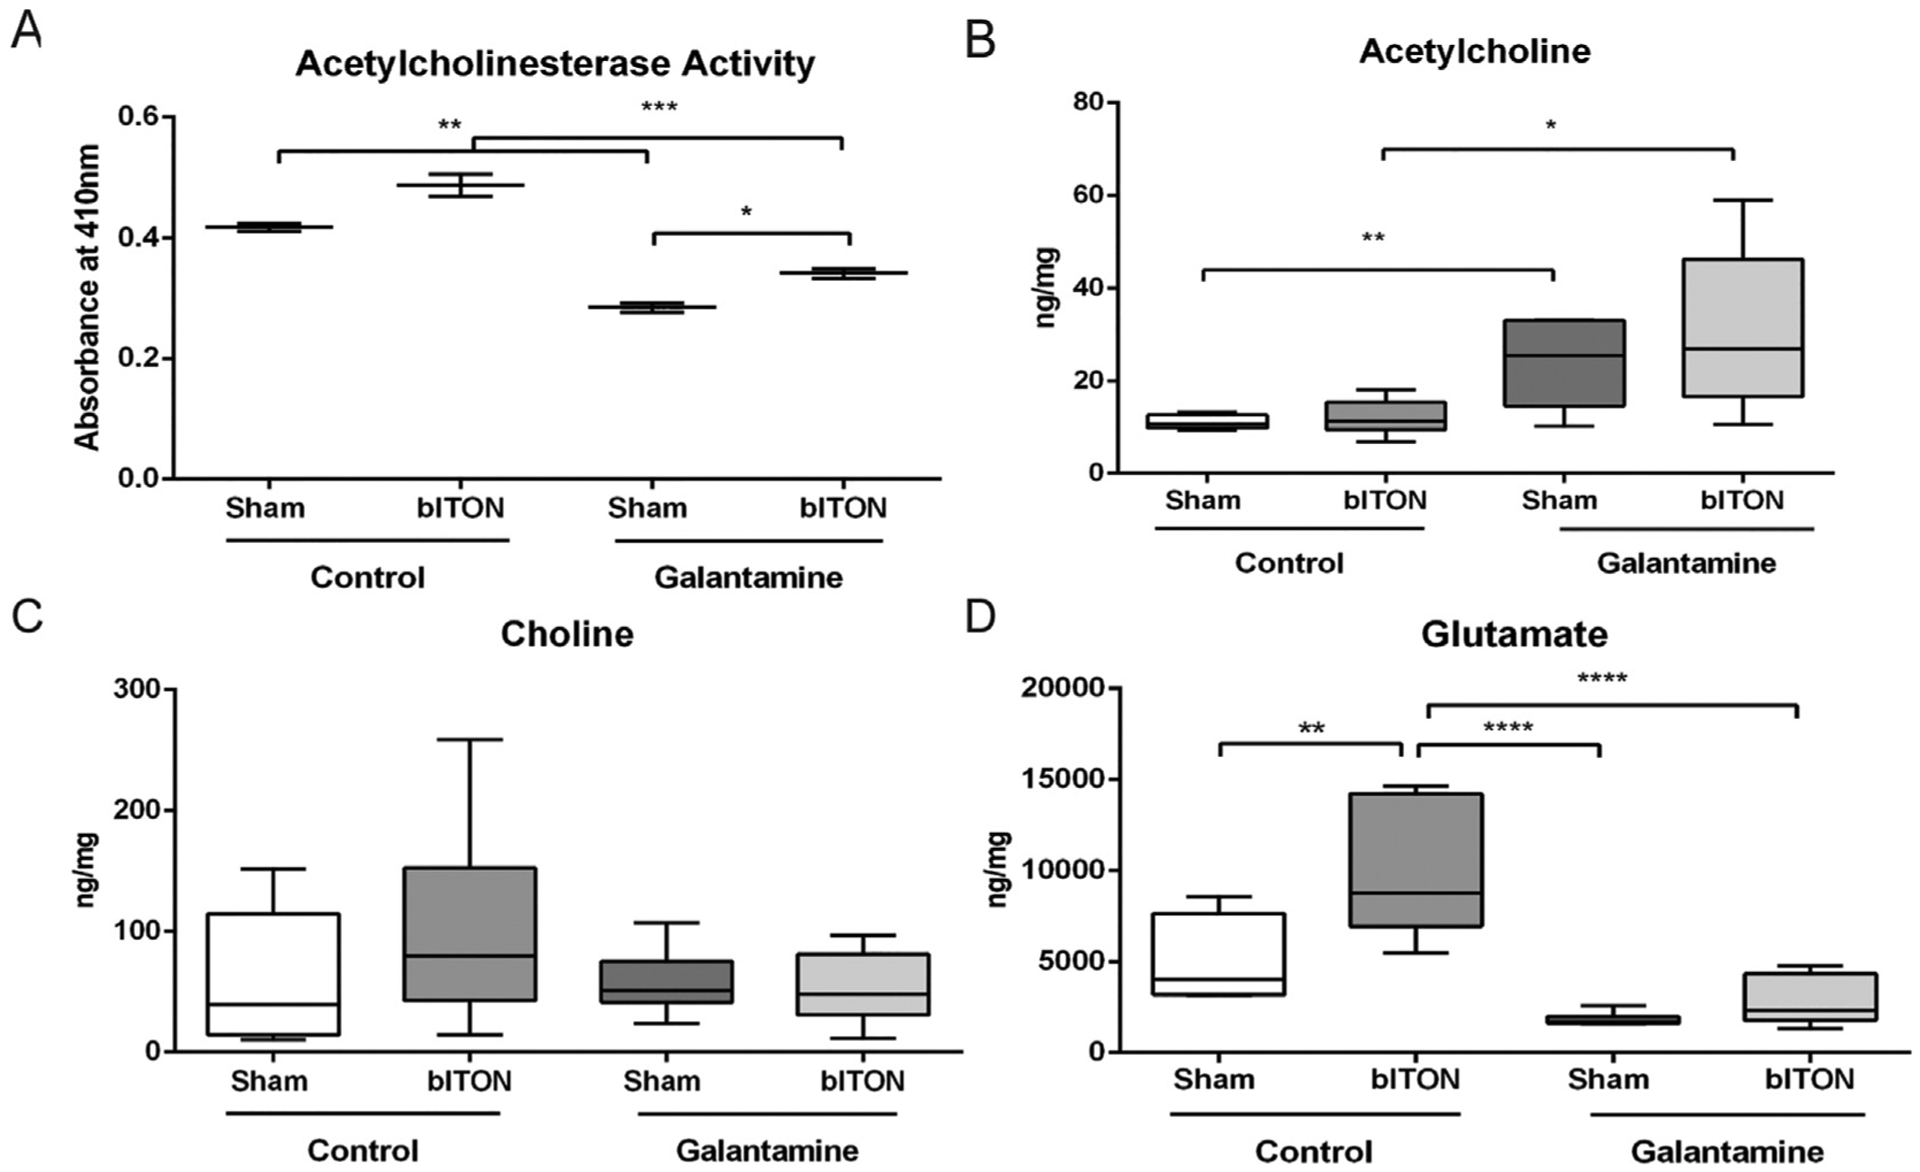
Oral galantamine inhibited retinal acetylcholinesterase activity, increased acetylcholine, and decreased glutamate. A) Acetylcholinesterase activity assay. B) Acetylcholine levels quantified with HPLC. C) Choline levels quantified with HPLC. D) Glutamate levels quantified with HPLC. N = 5 retinas for all groups. *p < .05, **p < .001, ****p < .00001.
The levels of retinal acetylcholine in mice treated with galantamine was greater than controls (Fig. 1B). Acetylcholine levels were 11.0 ± 1.2, 13.0 ± 3.6; 23.8 ± 10.0, and 30.0 ± 17.2 ng/mg respectively for sham, bITON, galantamine sham, and galantamine-bITON groups (Fig. 1B). Total choline levels remained unchanged in all four experimental groups (Fig. 1C).
Previous studies have elucidated that galantamine can modulate glutamate levels. We detected a 2.07-fold increase in glutamate levels in retinas from bITON mice as compared to those from control sham mice (p < .0001; Fig. 1D). In contrast, levels of glutamate in galantamine-treated mice were similar to control sham levels. To determine if galantamine modulated glutamate levels by affecting glutamate production or recycling, we performed immunohistochemistry and quantification of fluorescence for a marker of glutamine synthetase (GLAST) and a marker for glutamate transporter 1 (EAAT). No differences in the total fluorescence of either of these markers in the retina were detected (data not shown).
3.2. Galantamine treatment mitigates bITON-induced reduction in the ERG
We assessed retinal function by ERG, and observed no difference in the amplitude or latency of the a-wave, indicating that our model of bITON does not affect the photoreceptors (Fig. 2A,B). However, the amplitude of the b-wave (bmax) of the ERG was decreased after bITON (Fig. 2A,C). Control shams had a mean bmax of 203.3 ± 7.4 μV, while control bITON had a mean bmax of 100.6 ± 11.6 μV, p < .001. Additionally, bITON mice had a longer b-wave latency than the control sham mice: 41.3 ± 12.1 ms as compared to 54.6 ± 9.3 ms, p < .0001 (Fig. 2A, D). The b-wave is generated primarily by the rod bipolar cells, thus these data suggest that these cells are affected by bITON. Galantamine treatment after bITON partially protected the bmax and the b-wave latency (Fig. 2C, D). The mean bmax in galantamine sham and galantamine-treated bITON mice was 190.8 ± 37.7 μV and 158.8 ± 48.0 μV, respectively, with p < .05 between the galantamine-treated groups (Fig. 2C). The latencies of the b-wave in galantamine sham and bITON mice were 40.5 ± 8.2 ms and 45.2 ± 10.2 ms, respectively, with no statistically significant difference between them (Fig. 2D). Importantly, there was a statistically significant difference between the control bITON group and the galantamine-treated bITON groups for both b wave amplitude and latency (p < .0001 and p < .00001, respectively).
Fig. 2.
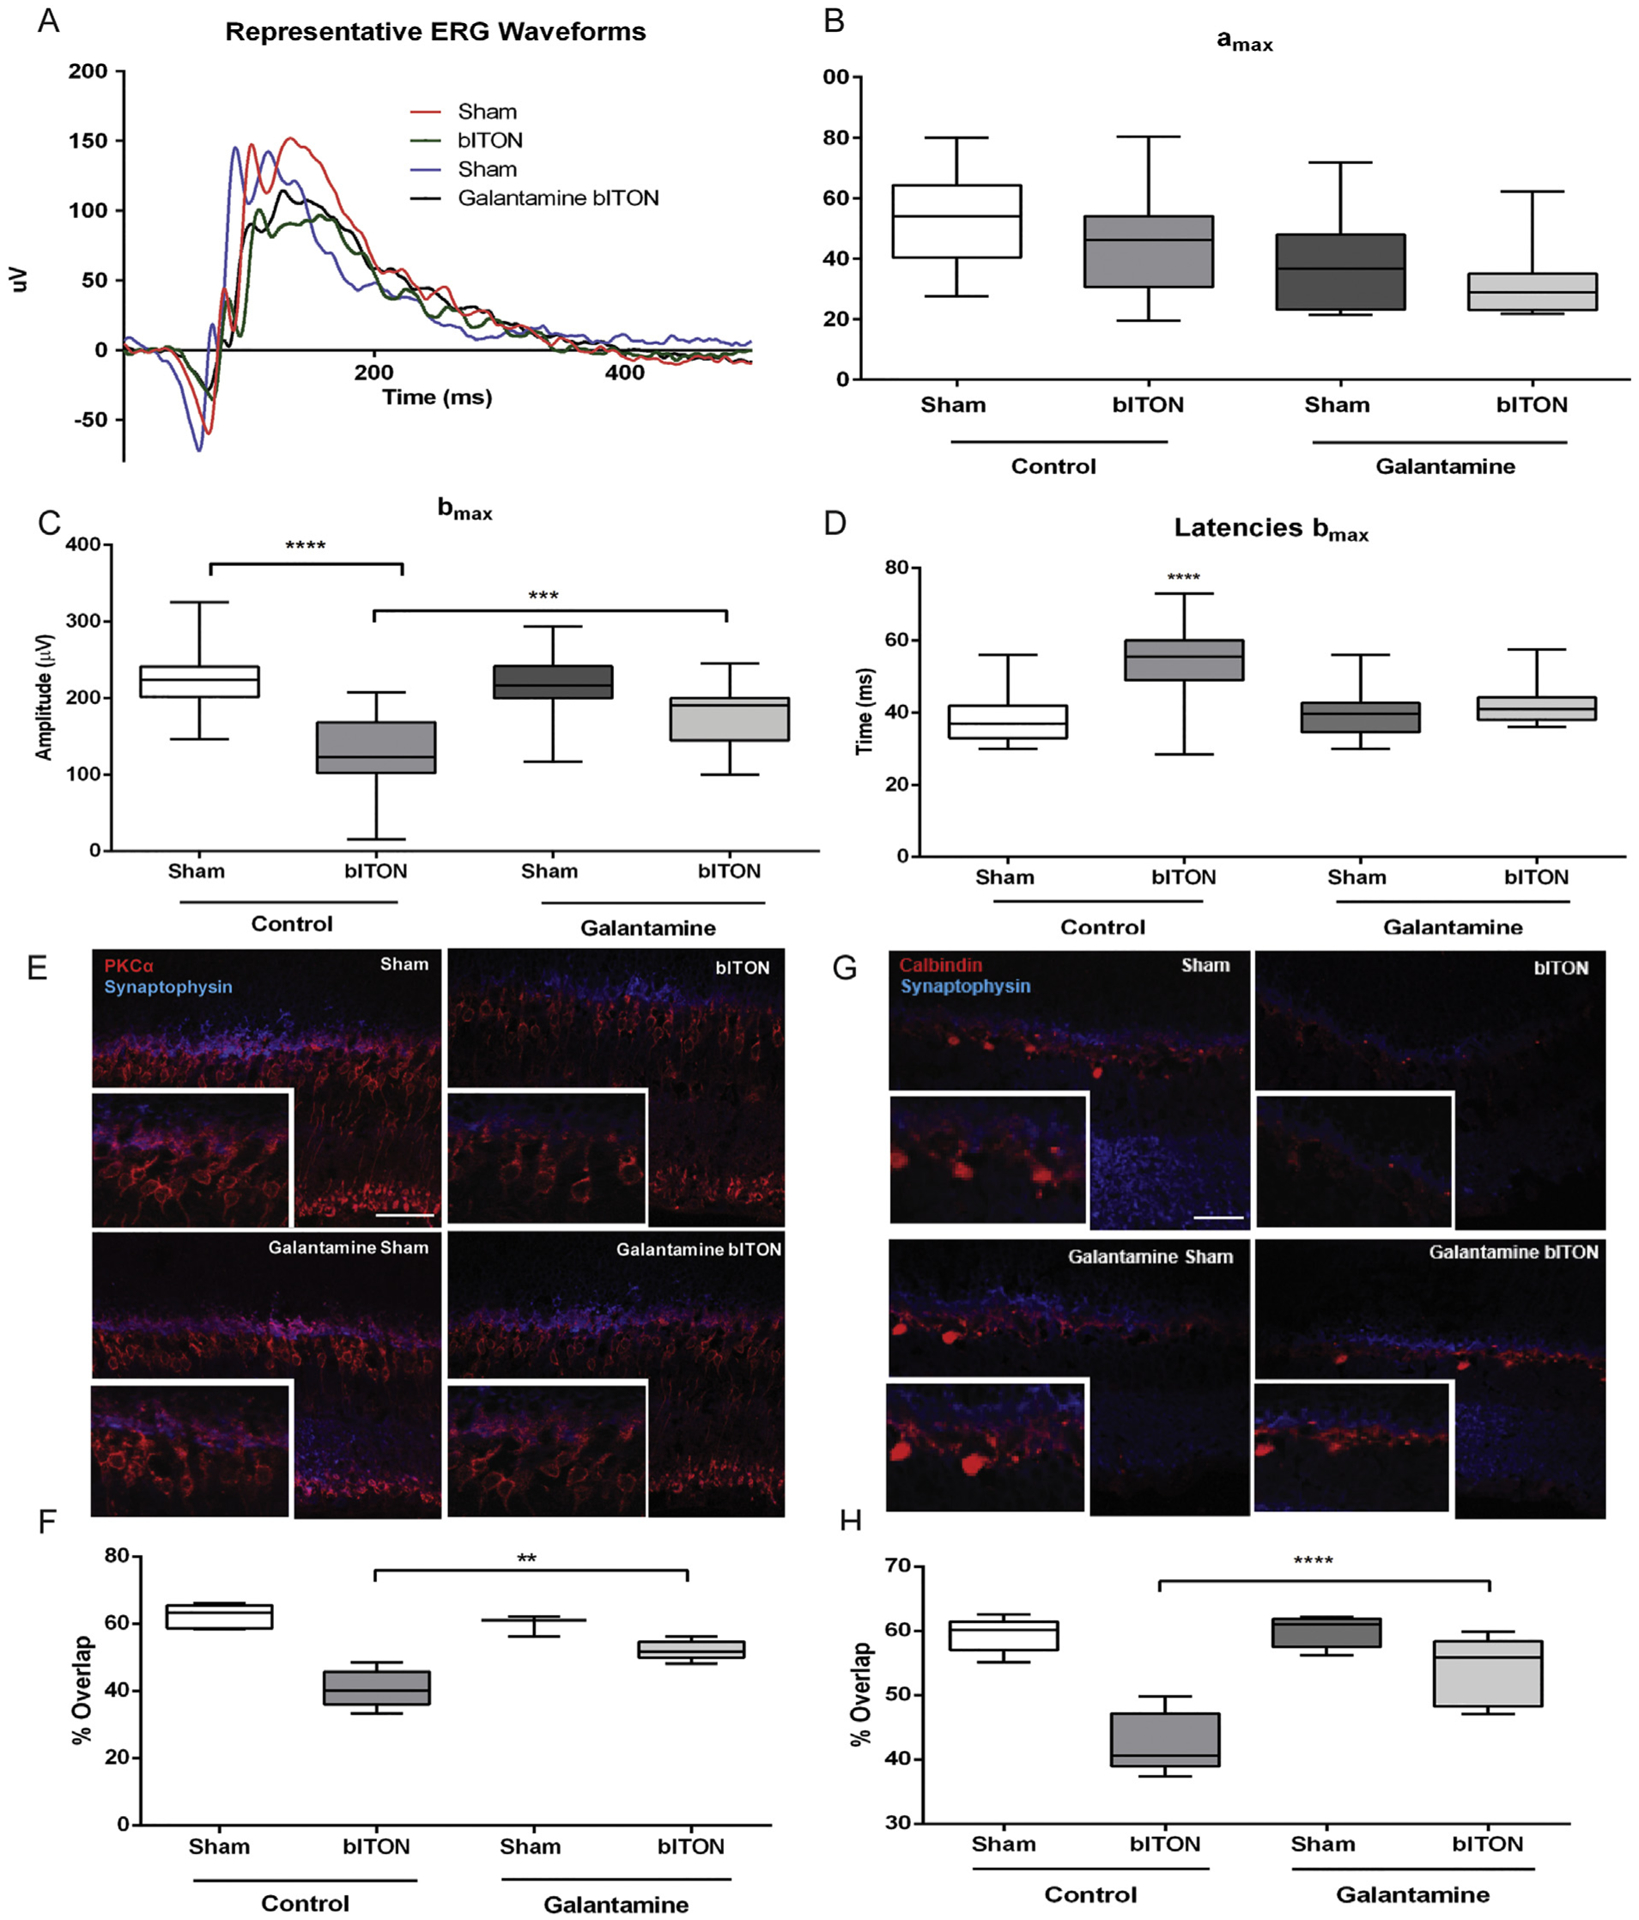
Galantamine mitigated bITON-induced the ERG b-wave deficits and rod bipolar cell dendritic retraction. A) Representative ERG waveforms. B) Graphed a-wave amplitudes. C) Graphed b-wave amplitudes. D) Graphed b-wave latencies. E) Representative fluorescent micrographs of anti-PKC-α (red) and anti-synaptophysin (blue) co-labeling in the outer plexiform layer (OPL) of retina sections. F) Quantification of co-localization of anti-PKC-α and anti-synaptophysin markers using ImageJ. G) Representative fluorescent micrographs of anti-calbindin-D (red) and anti-synaptophysin (blue) co-labeling in the OPL. H) Quantification of co-localization of anti-calbindin-D and anti-synaptophysin markers using ImageJ. For all ERG data shown, N = 31 for control sham, 28 for control bITON, and 15 for both galantamine sham and galantamine bITON groups. For all immunohistochemistry shown, N = 5 retinas per group and 2 sections per retina. *p < .05, **p < .001, ****p < .00001. Scale bar indicates 100um.
3.3. Galantamine treated mice retain synaptic overlap in the OPL after bITON
We performed immunohistochemical analysis to explore the morphological basis for the ERG b-wave changes. We co-labeled retina cross-sections with anti-PKCα, a marker for rod bipolar cells, and anti-synaptophysin, a marker for the photoreceptor ribbon synapse. In control sham mice, the rod bipolar cells extend dendrites up to the photoreceptor terminals (Fig. 2E). In contrast, in control bITON mice, the rod bipolar cell dendrites were retracted toward their cell bodies (Fig. 2E). The rod bipolar cell dendrites of both sham and bITON mice treated with galantamine looked similar to normal sham mouse retinas (Fig. 2E). In an effort to quantify changes in dendritic overlap with the photoreceptor synaptic terminals, we quantified the extent of double-labeling of the two antibodies. Importantly, galantamine-treated bITON mice had a mean overlap that was comparable to the two sham groups: the mean overlap was 54 ± 2% for galantamine-bITON, sham mice, mean overlap for control-sham was 62 ± 3%, and mean overlap for galantamine-sham mice was 59 ± 3%. There was no statistically significant difference between any of the groups (Fig. 2F). In contrast, after bITON, mean overlap of anti-PKCα and anti-synaptophysin decreased to 41 ± 5% (p < .05, in comparison to either sham group or galanamine-bITON group).
In order to check the other major synapse at the outer plexiform, we also co-immunolabeled with anti-synaptophysin and anti-calbindin-D, a marker for horizontal cells (Fig. 2G). There was a marked decrease in calbindin-D immunolabeling after bITON, which prevented visualization of changes in horizontal cell morphology. bITON mice that were treated with galantamine had preserved calbindin labeling. As expected, we quantified a significant difference in overlap in calbindin-D and synaptophysin between sham and bITON mice: sham mean overlap was 59 ± 2% and bITON mean overlap was 42 ± 4%, p < .05 (Fig. 2H). Galantamine preserved the horizontal cell and ribbon synapse double labeling: galantamine sham mean overlap was 59 ± 2%, and galantamine bITON mean overlap was 53 ± 5% (Fig. 2H). There was no statistical difference between the either of the galantamine groups.
3.4. Galantamine treatment mitigated axon degeneration after bITON
Representative micrographs of optic nerve cross-sections from control sham, control bITON, and galantamine-treated bITON mice are shown. Control sham and galantamine-treated bITON nerves exhibit more axons than the control bITON nerve (Fig. 3A–C). Similar to our previous studies, bITON mice had an average of 23,609 ± 1303 axons in the optic nerve with p < .0001 in comparison to control shams (52,464 ± 4075 axons).(Hines-Beard et al., 2012; Bernardo-Colon et al., 2018) Galantamine-treated shams had 52,014 ± 2673 axons, and galantamine-treated bITON mice had 48,693 ± 1160 axons (Fig. 3D), both of which were comparable to the control sham mice.
Fig. 3.
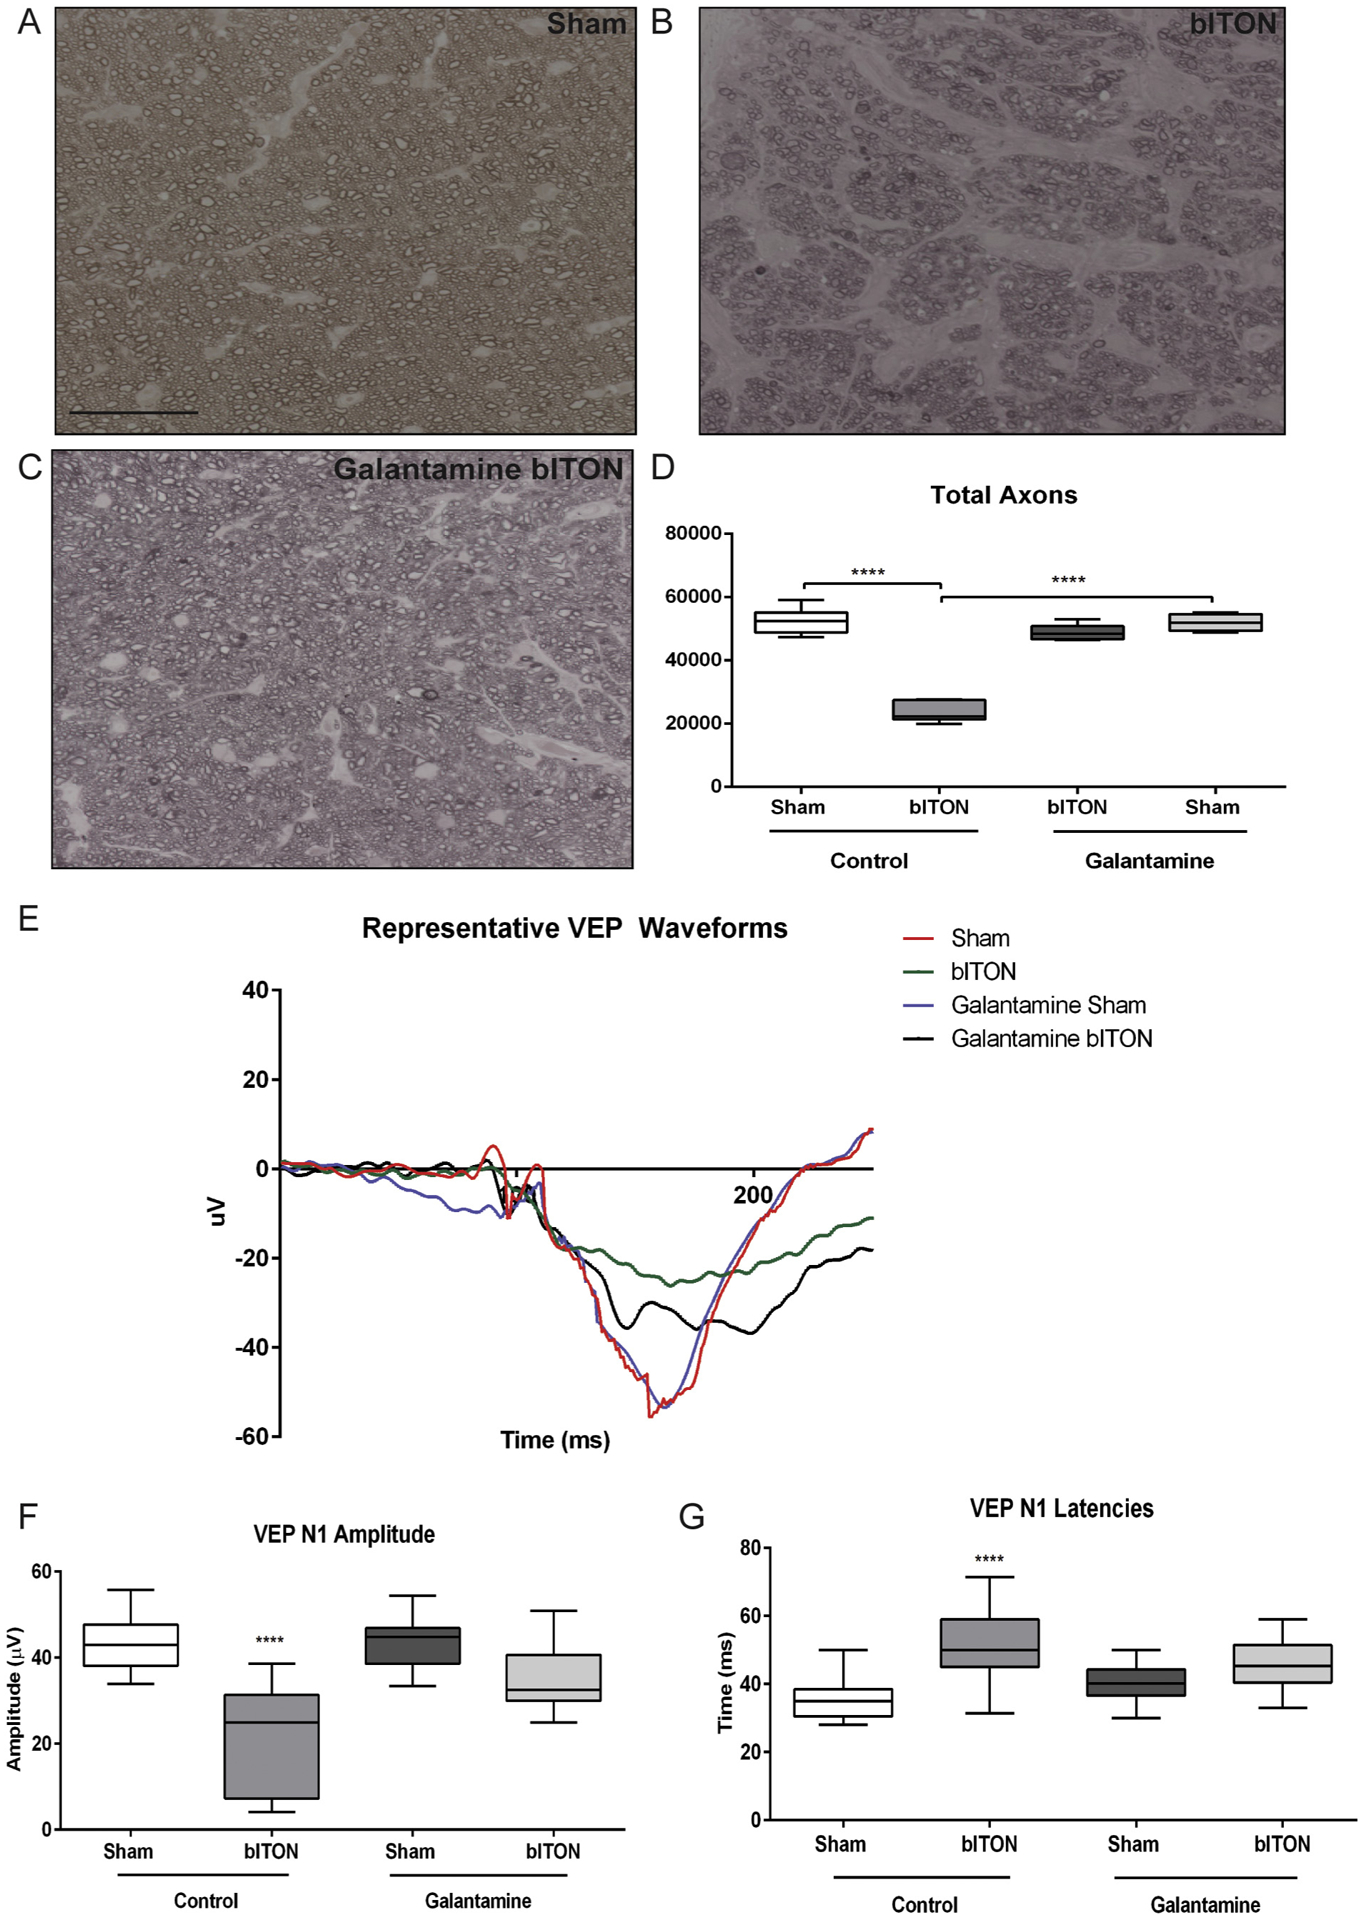
Galantamine mitigated the VEP deficits and axon degeneration. A-C) Representative brightfield micrograph of optic nerves. Scale bar represents 20 μm and applies to all micrographs. D) Quantification of total axon counts. N = 5 for all groups. *p < .05. ****p < .00001 E) Representative VEP waveforms. F) Graphed VEP N1 amplitudes. For all VEP data, N = 15 for control sham, 14 for control bITON, galantamine sham and galantamine bITON groups. G) Graphed VEP N1 latencies.
3.5. Galantamine treatment mitigated bITON-induced changes in the VEP
In order to assess transmission of the visual signal to the visual cortex, we performed flash VEPs (Fig. 3E). Similar to our previously reported findings, the control sham mice had an average VEP N1 amplitude of 42.56 ± 6.78 μV while control bITON mice had an average amplitude of 21.85 ± 11.86 μV, a nearly 2-fold reduction in amplitude (p < .0001; Fig. 3F). (Bernardo-Colon et al., 2018) The control bITON mice also had a longer VEP N1 latency than the control sham mice: 49.34 ± 11.19 ms for bITON as compared to 36.17 ± 7.30 ms (p < .0001; Fig. 3G). Regarding the right-shifted latencies of the bITON group, these are due to a deficit in axon conductance, possibly due to changes in energetics or in myelination of the optic nerve.
Galantamine treatment after bITON resulted in partial retention of both the amplitudes and the latencies of the VEP N1 (p < .001 for amplitudes and p < .0001 for latencies as compared to control bITON mice) (Fig. 3E–G). Galantamine sham and galantamine-treated bITON mice had mean VEP N1 amplitudes of 41.98 ± 7.64 μV and 34.47 ± 8.19 μV, respectively, with no statistically significant difference between them (Fig. 3F). Galantamine sham and bITON mean N1 latencies were 40.38 ± 5.50 ms and 45.75 ± 2.11 ms respectively, with no statistically significant difference between them (Fig. 3G).
3.6. Galantamine mitigated bITON-induced oxidative stress and inflammation
We performed nitrotyrosine immunolabeling and quantified levels of immunofluorescence in order to assess the effect of galantamine on oxidative stress in the retina after bITON (Fig. 4A–F). Nitrotyrosine immunolabeling was nearly absent in control sham retinas (Fig. 4A). In the control bITON mice, nitrotyrosine immunolabeling was present specifically in the retinal ganglion cell layer (Fig. 4B). The immunolabeling was significantly reduced in the galantamine-treated bITON retinas (Fig. 4B, D). To determine which cell type labeled for nitrotyrosine, we co-labeled bITON retinas with the neuronal marker, anti-NeuN. We found that the anti-nitrotyrosine labeling overlapped with the anti-NeuN labeling in the ganglion cell layer (Fig. 4E). We quantified fluorescence in the retinal ganglion cell layer of all groups (Fig. 4F). Control bITON mice contained 174 ± 2% more fluorescence than control sham mice, p < .0001, and 151 ± 5% more fluorescence than galantamine-bITON mice, p < .0001 (Fig. 4F). There was no statistically significant difference in fluorescence levels between galantamine sham mice and galantamine-treated bITON mice (Fig. 4F).
Fig. 4.
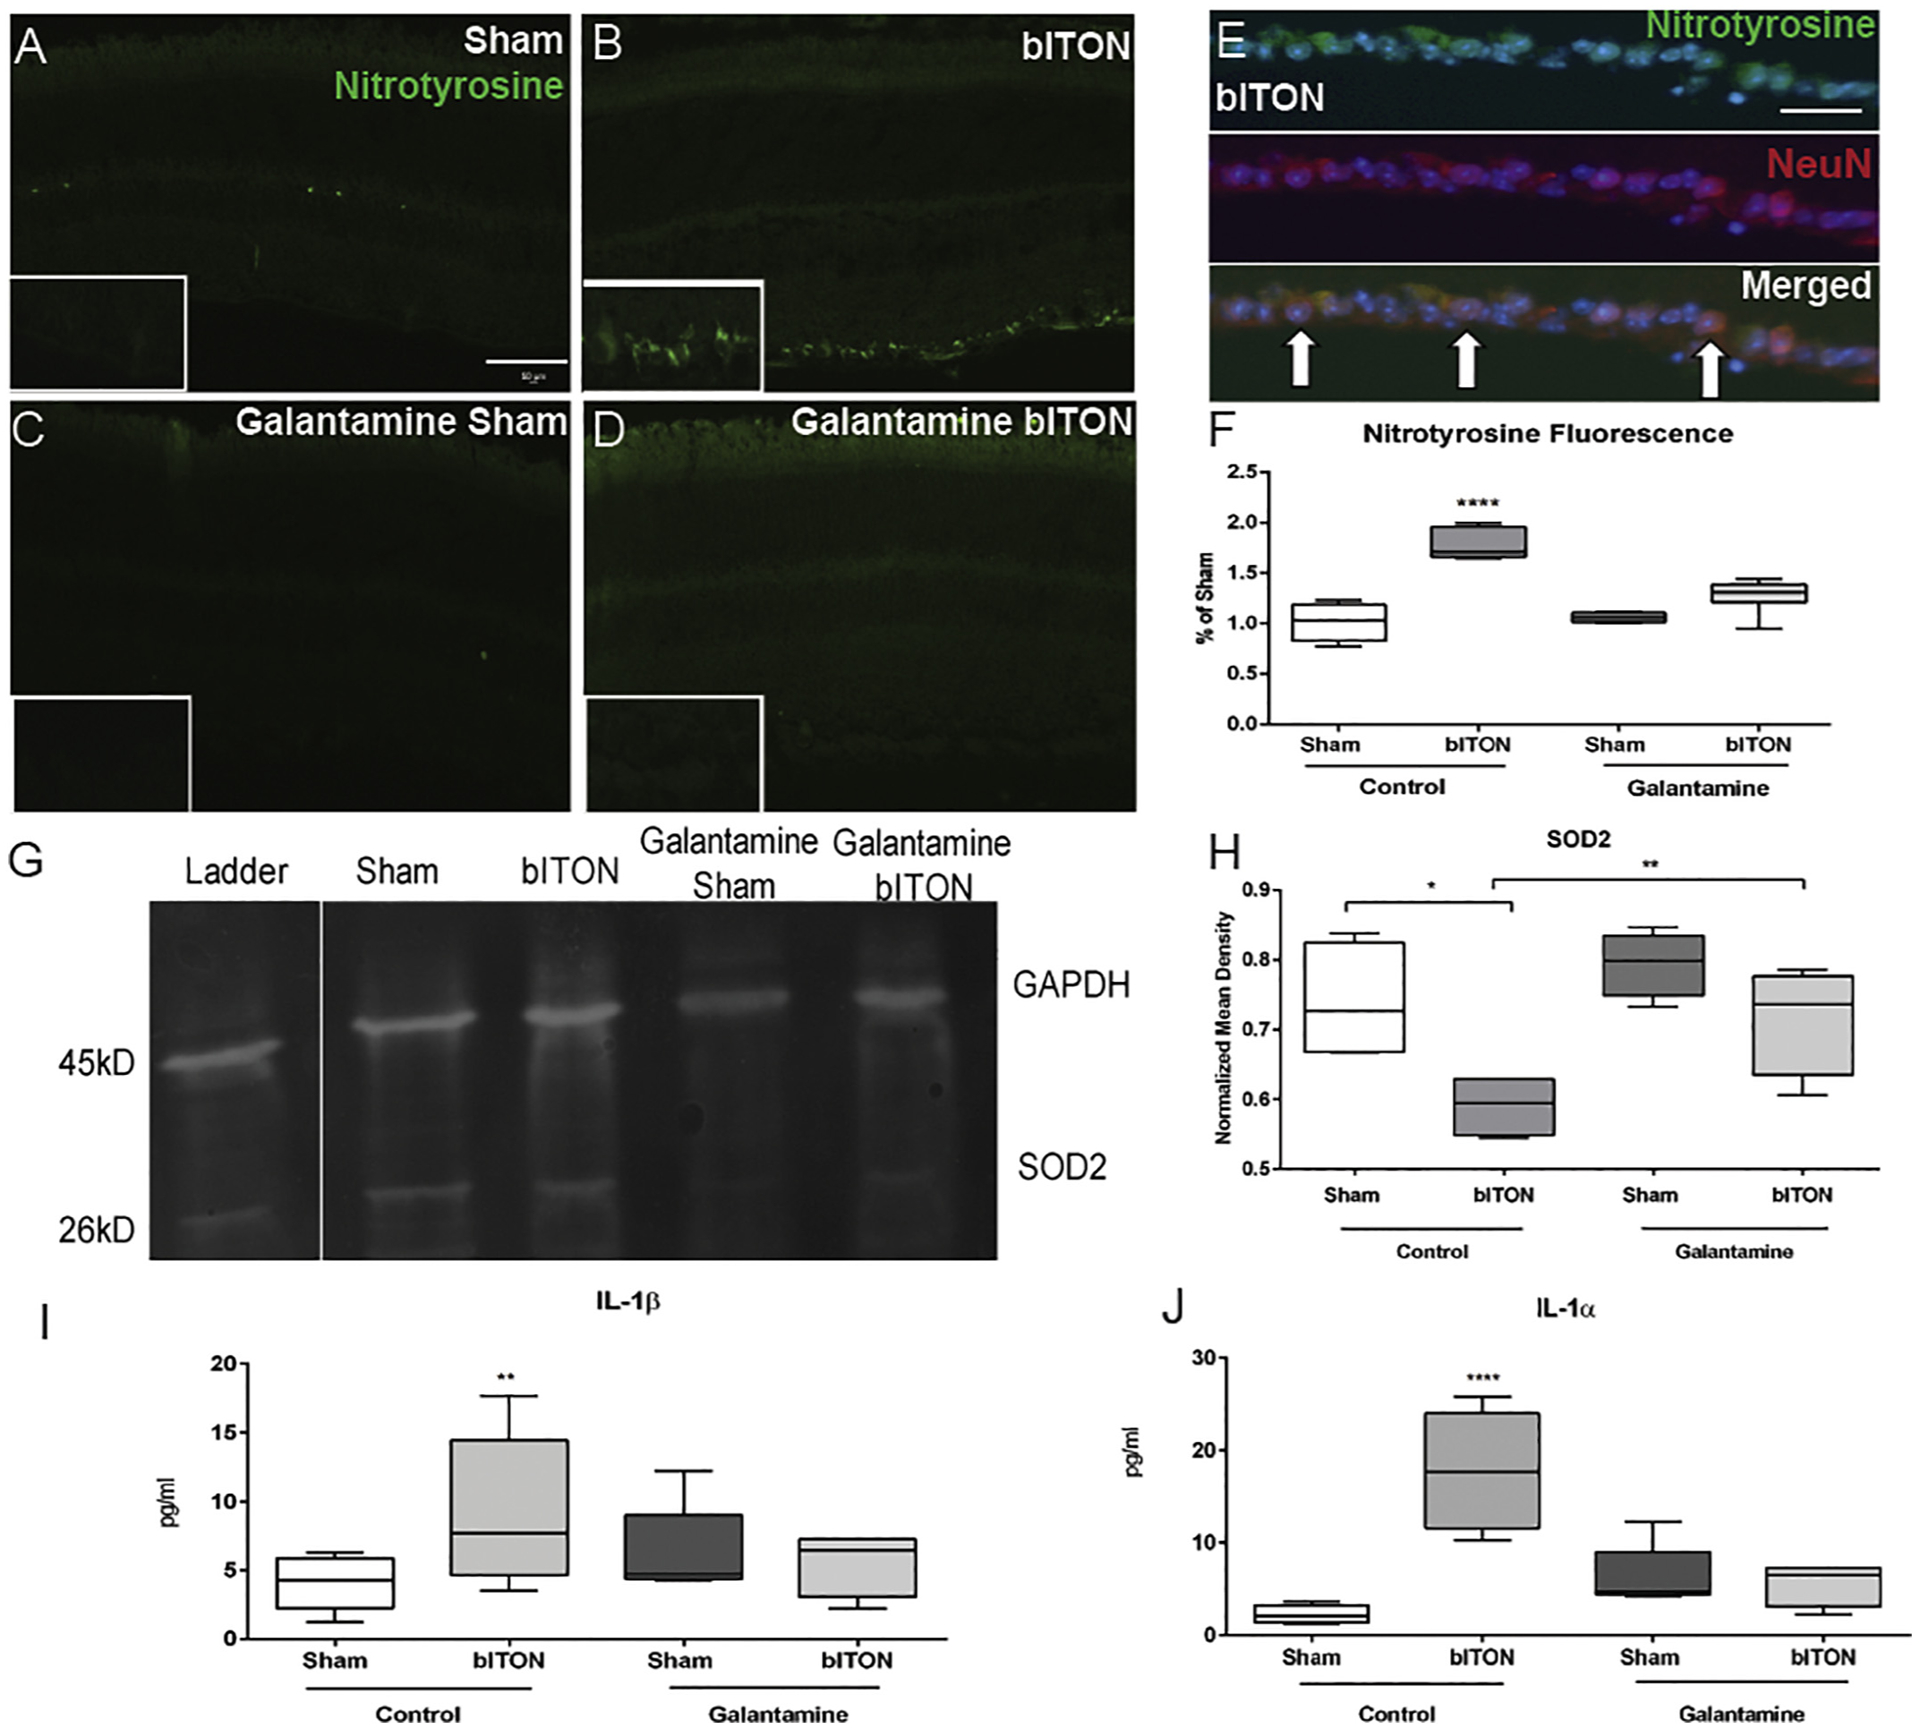
Galantamine has antioxidant and anti-inflammatory effects. A-D) Representative fluorescent micrographs of anti-nitrotyrosine labeling. Scale bar represents 50 μm and applies to all images. E) Representative fluorescent micrographs of anti-nitrotyrosine labeling (green), anti-NeuN labeling (red), and DAPI (blue). Co-localization of these markers indicated with white arrows. F) Quantification of anti-nitrotyrosine fluorescence in the ganglion cell layer using ImageJ and compared as a percent of control sham mouse. G) Representative western blot of SOD2. H) Quantification of retinal SOD2 levels. N = 5 retinas per group for all biochemical analyses. I) Quantification of retinal IL-1α levels. J) Quantification of retinal IL-1β levels. N = 5 retinas per group and 2 sections per retina. *p < .05, **p < .001, ***p < .0001, ****p < .00001. Scale bar indicates 100um.
Mitochondrial superoxide dismutase (SOD2) converts the superoxide that is formed as a metabolic by-product of oxidative phosphorylation into oxygen and thus is a critical enzyme in regulating intracellular ROS levels. Similar to our previously studies, we detected a 59 ± 4% decrease in SOD2 levels at one month after control bITON as compared to control shams (Fig. 4G). (Bernardo-Colon et al., 2018) In contrast, SOD2 levels in galantamine-treated sham and bITON mice were comparable to control shams. We detected a statistically significant difference (p < .001) between either galantamine-treated group and the control bITON group (Fig. 4G).
We detected an increase in the pro-inflammatory cytokines, IL-1α and IL-1β in the control bITON retinas, in agreement with our previous findings (Fig. 4H). (Bernardo-Colon et al., 2018) bITON retinas had IL-1α mean levels of 17.77 ± 6.41 pg/ml in comparison to shams with mean levels of 2.26 ± 0.98 pg/ml, p < .00001. Average galantamine sham levels for IL-1α were 6.30 pg/ml ± 3.37 and mean galantamine bITON levels were 5.43 pg/ml ± 2.26. There was no statistically significant difference between control sham retinas, galantamine-treated sham retinas, and galantamine-treated bITON retinas. Similarly, bITON resulted in an elevation of IL-1β levels to 9.18 ± 2.4 pg/ml, compared to 4.1 ± 1.9 pg/ml detected in control sham retinas (p < .001) (Fig. 4I). In contrast, galantamine-treated sham retinas and galantamine-treated bITON retinas contained similar levels of IL-1β: 2.7 ± 1.7 pg/ml and 2.8 ± 1.4 pg/ml, respectively and were not significantly different from control sham retinas.
4. Discussion
In this study, we initiated treatment of galantamine after the last of a 3-day series of blast exposures. We previously demonstrated that our bITON model induces axon degeneration after only three blasts, which suggests that injury responses started prior to the last day of the blasts and the start of galantamine treatment. (Bernardo-Colón et al., 2019) We show that oral galantamine given ad libitum reached the retina, where it increased acetylcholine levels and decreased acetylcholinesterase activity. This treatment paradigm mitigated bITON-induced visual function deficits, axon degeneration in the optic nerve and rod bipolar cell dendritic retraction. Further, it moderated oxidative stress, inflammation, and glutamate levels.
After bITON, rod bipolar cells were present, but their dendrites were retracted toward their cell bodies (Fig. 2E). This correlates with the decrease in the b-wave amplitude (Fig. 2A, C) and increase in the b-wave latency detected after bITON (Fig. 2A, D). Co-immunolabeling of nitrotyrosine and NeuN in the ganglion cell layer demonstrates that the cells primarily affected by bITON-induced oxidative stress are retinal ganglion cells and possibly displaced amacrine cells (Fig. 4E). This is consistent with our previously study showing loss of cells in the ganglion cell layer. (Bernardo-Colón et al., 2019) We have performed TUNEL and do not detect active cell death in the retina at the post-bITON time-points we have examined (data not shown). In contrast, based on the ERG, OCT thickness (data not shown), and immunolabeling results, bITON does not cause significant loss of bipolar or amacrine cells. We do not detect a difference in overall retinal thickness or in the thickness of any particular layer of the retina by OCT (data not shown). In addition, the a-wave and the oscillatory potentials of the ERG are unaltered in our bITON model suggesting that the photoreceptors and AII amacrine cells are unaffected (data not shown). Thus, while we cannot discount some loss of other retinal neurons, it is likely minimal. In contrast, the right-shifted latencies of the VEP of the bITON group (Fig. 3G) suggest a deficit in axon conductance, possibly due to changes in axon energetics or myelination in the optic nerve, which again points to dysfunction of the RGCs and matches the optic nerve histological findings reported here and elsewhere.(Bernardo-Colon et al., 2018; Bernardo-Colón et al., 2019)
In most cases, galantamine treatment resulted in partial protection of the retina. Treating earlier after injury may be more effective. There also may be injury pathways activated by bITON that are unaffected by galantamine. Further studies are needed to determine how long after injury galantamine treatment can be initiated and still be effective. Additionally, the decreases in oxidative stress and inflammation in galantamine-treated retinas may be an indirect result of galantamine action that prevents secondary axon degeneration and cell injury as opposed to a direct action on these pathways.
Detection of elevated glutamate in post-bITON retinas is consistent with reports in other models of TBI or blast injury. In a rat TBI study, there was a nine-fold increase in extracellular glutamate levels in the brain as compared to control animals. (Guerriero et al., 2015) In a model of rat blast injury, glutamate was significantly increased in the retina. (Mammadova et al., 2017) Additionally, many preclinical and clinical studies have demonstrated altered glutamate production, clearance, and buffering after TBI that results in an excess of glutamate. (Guerriero et al., 2015; Tehse and Taghibiglou, 2019) It possible that glutamate may play a large role in determining the state of the post-injury CNS. Glutamate is the most abundant excitatory neuro-transmitter within the CNS and excess glutamate can lead to a massive increase in neuronal activity, increased intracellular calcium, and even cell death, i.e. excitotoxicity. Retinal astrocytes and Müller glia play an important role in glutamate buffering and clearance. Knockout of the glial protein, EAAT1, in mice exposed to TBI exhibit excitotoxic levels of glutamate in comparison to controls. (Dorsett et al., 2017) Additionally, TBI in rats results in excess glutamate followed by a down-regulation in expression of GLAST and EAAT1 in glial cells. (Rao et al., 2002) However, in this study, we did not find a difference in the immunohistochemical labeling of GLAST or EAAT1 between any of our groups, despite the observed increases in retinal glutamate following bITON. Galantamine has been shown to act as a modulator of glutamate-induced excitotoxicity by preventing increases in cell death following exposure to NMDA. (Lopes et al., 2013) It is feasible that galantamine acted upstream to the mechanism that caused an increase in glutamate. This should be explored in future studies.
The positive effect of galantamine on oxidative stress and inflammation in our bITON model are in agreement with other reports showing that galantamine has antioxidant and anti-inflammatory effects on cells both in culture and in vivo. (Romero et al., 2010; Melo et al., 2009) Galantamine treatment reduced IL-1β levels in the brain of a hypoxia-ischemic rat model, and protected cortical neurons following injury. (Rao et al., 2002) Additionally, galantamine decreased oxidative stress and apoptosis in cortical neurons exposed to amyloid-beta peptides and in neuroblastoma cells that were treated with hydrogen peroxide. (Ezoulin et al., 2008; Melo et al., 2009)
Galantamine has been utilized in a variety of neurodegenerative disease models other than Alzheimer’s, and has demonstrated protection. Galantamine treatment, via modulation of the muscarinic acetylcholine receptors in the retina, has shown to be protective in multiple models of glaucoma by promoting retinal ganglion cell survival. (Almasieh et al., 2010; Di Polo et al., 2006) Additionally, through its inhibition of acetylcholinesterase, galantamine treatment was protective in another model of glaucoma via increasing blood flow. (Almasieh et al., 2013) Outside the retina, efferent vagus nerve activity, via the cholinergic anti-inflammatory pathway, is responsible for regulation of cytokine production via α7nAChR-dependent signaling. (Borovikova et al., 2000) Galantamine is a positive allosteric modulator of α7nAChRs, so it is feasible that the protection we detected was due to activation of this anti-inflammatory pathway. (Lopes et al., 2013; Texidó et al., 2005; Faghih et al., 2007) Overall, our results are comparable with previous studies showing that galantamine has antioxidant and anti-inflammatory effects and is neuroprotective.
In conclusion, galantamine treatment given after three days of blasts partially protected against visual function deficits, oxidative stress, inflammation and axon degeneration in a model of bITON. Future studies are needed to elucidate galantamine’s therapeutic window for partial protection following bITON. Additionally, future studies should determine the exact mechanism by which galantamine exerts antioxidant and anti-inflammatory effects in our model of bITON. Since it is already FDA-approved, it has good pharmacokinetics and is safe to use, galantamine should be further studied as a potential treatment for optic neuropathies.
Acknowledgements
We would like to acknowledge the Vanderbilt University Medical Center Cell Imaging Shared Resource core facility, Vanderbilt University Neurochemistry Core, and the Vanderbilt University Medical Center Hormone Assay and Analytical Core for their help with confocal microscopy, ELISAs, and HPLC, respectively.
Funding
DoDW81XWH-15-1-0096, W81XWH-17-2-0055, NEI R01 EY022349, NEI P30 EY008126, NIA R01 NS094595, (VEI) Research to Prevent Blindness Unrestricted Funds, Ret. Maj. General Stephen L. Jones, MD Fund, Mark Pigott Fund,Potoscnak Family-CSC Research Fund, Ayers Research Fund in Regenerative Visual Neuroscience, NEI 5T32EY007135 (VVRC) P30 grant number (S. Naguib), NEI U24 EY29893.
Footnotes
Publisher's Disclaimer: DoD non-endorsement disclaimer
Publisher's Disclaimer: The views, opinions and/or findings contained in this research presentation are those of the authors and do not necessarily reflect the views of the Department of Defense and should not be construed as an official DoD/Army position, policy or decision unless so designated by other documentation. No official endorsement should be made.
References
- Aghadoost D, 2014. A brief overview of ocular trauma. Arch. Trauma Res 3. [DOI] [PMC free article] [PubMed] [Google Scholar]
- Almasieh M, Zhou Y, Kelly M, et al. , 2010. Structural and functional neuroprotection in glaucoma: role of galantamine-mediated activation of muscarinic acetylcholine receptors. Cell Death Dis. 1, e27. [DOI] [PMC free article] [PubMed] [Google Scholar]
- Almasieh M, MacIntyre J, Pouliot M, et al. , 2013. Acetylcholinesterase inhibition promotes retinal vasoprotection and increases ocular blood flow in experimental glaucoma. Investig. Ophthalmol. Vis. Sci 54, 3171–3183. [DOI] [PubMed] [Google Scholar]
- Andreotti G, Lange JL, Brundage JF, 2001. The nature, incidence, and impact of eye injuries among US military personnel: implications for prevention. Arch. Ophthalmol 119, 1693–1697. [DOI] [PubMed] [Google Scholar]
- Bernardo-Colon A, Vest V, Clark A, et al. , 2018. Antioxidants prevent inflammation and preserve the optic projection and visual function in experimental neurotrauma. Cell Death Dis. 9. [DOI] [PMC free article] [PubMed] [Google Scholar]
- Bernardo-Colón A, Vest V, Cooper ML, et al. , 2019. Progression and pathology of traumatic optic neuropathy from repeated primary blast exposure. Front. Neurosci 13 (719). [DOI] [PMC free article] [PubMed] [Google Scholar]
- Borovikova LV, Ivanova S, Zhang M, et al. , 2000. Vagus nerve stimulation attenuates the systemic inflammatory response to endotoxin. Nature 405, 458–462. [DOI] [PubMed] [Google Scholar]
- Bricker-Anthony C, Hines-Beard J, Rex TS, 2014. Molecular changes and vision loss in a mouse model of closed-globe blast trauma. Investig. Ophthalmol. Vis. Sci 55, 4853–4862. [DOI] [PMC free article] [PubMed] [Google Scholar]
- Burke EG, Cansler SM, Evanson NK, 2019. Indirect traumatic optic neuropathy: modeling optic nerve injury in the context of closed head trauma. Neural Regen. Res 14, 593–594. [DOI] [PMC free article] [PubMed] [Google Scholar]
- Di Polo A, Almasieh M, Zhou Y, 2006. Galantamine: a novel neuroprotective strategy for injured retinal ganglion cells in Glaucoma. Invest. Opthalmol. Vis. Sci 47. [Google Scholar]
- Dorsett CR, McGuire L, DePasquale E, et al. , 2017. Glutamate neurotransmission in rodent models of traumatic brain injury. J. Neurotrauma 34, 263–272. [DOI] [PMC free article] [PubMed] [Google Scholar]
- Durães F, Pinto M, Sousa E, 2018. Old drugs as new treatments for neurodegenerative diseases. Pharmaceuticals (Basel) 11. [DOI] [PMC free article] [PubMed] [Google Scholar]
- Ezoulin MJ, Ombetta J, Dutertre-Catella H, et al. , 2008. Antioxidative properties of galantamine on neuronal damage induced by hydrogen peroxide in SK-N-SH cells. Neurotoxicology 29, 270–277. [DOI] [PubMed] [Google Scholar]
- Faghih R, Gfesser GA, Gopalakrishnan M, 2007. Advances in the discovery of novel positive allosteric modulators of the alpha7 nicotinic acetylcholine receptor. Recent Pat. CNS Drug Discov 2 (99–106). [DOI] [PubMed] [Google Scholar]
- Feist RM, Farber MD, 1989. Ocular Trauma Epidemiology. Arch. Ophthalmol 107, 503–504. [DOI] [PubMed] [Google Scholar]
- Francis PT, 2005. The interplay of neurotransmitters in Alzheimer’s disease. CNS Spectr. 10, 6–9. [DOI] [PubMed] [Google Scholar]
- Furukawa S, Yang L, Sameshima H, 2014. Galantamine, an acetylcholinesterase inhibitor, reduces brain damage induced by hypoxia-ischemia in newborn rats. Int. J. Dev. Neurosci 37, 52–57. [DOI] [PubMed] [Google Scholar]
- Giacobini E, DeSarno P, Clark B, et al. , 1989. The cholinergic receptor system of the human brain: neurochemical and pharmacological aspects in aging and Alzheimer. Prog. Brain Res 79, 335–343. [DOI] [PubMed] [Google Scholar]
- Guerriero RM, Giza CC, Rotenberg A, 2015. Glutamate and GABA imbalance following traumatic brain injury. Curr. Neurol. Neurosci. Rep 15, 27. [DOI] [PMC free article] [PubMed] [Google Scholar]
- Hines-Beard J, Marchetta J, Gordon S, et al. , 2012. A mouse model of ocular blast injury that induces closed globe anterior and posterior pole damage. Exp. Eye Res 99, 63–70. [DOI] [PMC free article] [PubMed] [Google Scholar]
- Kita Y, Ago Y, Higashino K, et al. , 2014. Galantamine promotes adult hippocampal neurogenesis via muscarinic and α7 nicotinic receptors in mice. Int. J. Neuropsychopharmacol 17, 1957–1968. [DOI] [PubMed] [Google Scholar]
- Kumaran A, Sundar G, Chye L, 2014. Traumatic optic neuropathy: a review. Craniomaxillofac. Trauma Reconstr 8, 031–041. [DOI] [PMC free article] [PubMed] [Google Scholar]
- Lilienfeld S, 2002. Galantamine–a novel cholinergic drug with a unique dual mode of action for the treatment of patients with Alzheimer’s disease. CNS Drug. Rev 8, 159–176. [DOI] [PMC free article] [PubMed] [Google Scholar]
- Lopes J, Tarozzo G, Reggiani A, et al. , 2013. Galantamine potentiates the neuroprotective effect of memantine against NMDA-induced excitotoxicity. Brain. Behav 3 (2), 67–74. [DOI] [PMC free article] [PubMed] [Google Scholar]
- Mammadova N, Ghaisas S, Zenitsky G, et al. , 2017. Lasting retinal injury in a mouse model of blast-induced trauma. Am. J. Pathol 187, 1459–1472. [DOI] [PubMed] [Google Scholar]
- McKee AC, Robinson ME, 2014. Military-related traumatic brain injury and neuro-degeneration. Alzheimers Dement. 10. [DOI] [PMC free article] [PubMed] [Google Scholar]
- Melo JB, Sousa C, Garcao P, et al. , 2009. Galantamine protects against oxidative stress induced by amyloid-beta peptide in cortical neurons. Eur. J. Neurosci 29, 455–464. [DOI] [PubMed] [Google Scholar]
- Noda Y, Mouri A, Ando Y, et al. , 2010. Galantamine ameliorates the impairment of recognition memory in mice repeatedly treated with methamphetamine: involvement of allosteric potentiation of nicotinic acetylcholine receptors and dopaminergic-ERK1/2 systems. Int. J. Neuropsychopharmacol 13, 1343–1354. [DOI] [PubMed] [Google Scholar]
- Rao V, Baskaya M, Dogan A, et al. , 2002. Traumatic brain injury down-regulates glial glutamate transporter (GLT-1 and GLAST) proteins in rat brain. J. Neurochem 70, 2020–2027. [DOI] [PubMed] [Google Scholar]
- Romero A, Egea J, Garcia A, et al. , 2010. Synergistic neuroprotective effect of combined low concentrations of galantamine and melatonin against oxidative stress in SH-SY5Y neuroblastoma cells. J. Pineal Res 49, 141–148. [DOI] [PubMed] [Google Scholar]
- Shimizu S, Mizuguchi Y, Sobue A, et al. , 2015. Interaction between anti-Alzheimer and antipsychotic drugs in modulating extrapyramidal motor disorders in mice. J. Pharmacol. Sci 127, 439–445. [DOI] [PubMed] [Google Scholar]
- Singman EL, Daphalapurkar N, White H, et al. , 2016. Indirect traumatic optic neuropathy. Mil. Med. Res 3. [DOI] [PMC free article] [PubMed] [Google Scholar]
- Steinsapir KD, Goldberg RA, 2011. Traumatic optic neuropathy: an evolving understanding. Am J. Ophthalmol 151, 928–933.e2. [DOI] [PubMed] [Google Scholar]
- Tehse J, Taghibiglou C, 2019. The overlooked aspect of excitotoxicity: glutamate-independent excitotoxicity in traumatic brain injuries. Eur. J. Neurosci 49, 1157–1170. [DOI] [PubMed] [Google Scholar]
- Texidó L, et al. , 2005. Effect of galantamine on the human α7 neuronal nicotinic acetylcholine receptor, the Torpedo nicotinic acetylcholine receptor and spontaneous cholinergic synaptic activity. Br. J. Pharmacol 145, 672–678. [DOI] [PMC free article] [PubMed] [Google Scholar]
- Volpe NJ, Levin LA, 2011. How should patients with indirect traumatic optic neuropathy be treated? J Neuroophthalmol 31, 169–174. [DOI] [PMC free article] [PubMed] [Google Scholar]
- Warner N, Eggenberger E, 2010. Traumatic optic neuropathy: a review of the current literature. Curr. Opin. Ophthalmol 21, 459–462. [DOI] [PubMed] [Google Scholar]
- Weichel ED, Colyer M, Bautista C, et al. , 2009. Traumatic brain injury associated with combat ocular trauma. J. Head Trauma Rehabil 24, 41–50. [DOI] [PubMed] [Google Scholar]
- WHO, 2018. Priority Eye Diseases. WHO. [Google Scholar]