Abstract
Objectives:
This study aimed to evaluate the diagnostic performance of magnetic resonance perfusion-weighted imaging (PWI) as a noninvasive method to assess post-treatment radiation effect and tumor progression in patients with glioma.
Methods:
A systematic literature search was performed in the PubMed, Cochrane Library, and Embase databases up to March 2020. The quality of the included studies was assessed by the quality assessment of diagnostic accuracy studies 2. Data were extracted to calculate sensitivity, specificity, and diagnostic odds ratio (DOR), 95% Confidence interval (CI) and analyze the heterogeneity of the studies (Spearman correlation coefficient, I2 test). We performed meta-regression and subgroup analyses to identify the impact of study heterogeneity.
Results:
Twenty studies were included, with available data for analysis on 939 patients and 968 lesions. All included studies used dynamic susceptibility contrast (DSC) PWI, four also used dynamic contrast-enhanced PWI, and three also used arterial spin marker imaging PWI. When DSC was considered, the pooled sensitivity and specificity were 0.83 (95% CI, 0.79 to 0.86) and 0.83 (95% CI, 0.78 to 0.87), respectively; pooled DOR, 21.31 (95% CI, 13.07 to 34.73); area under the curve (AUC), 0.887; Q∗, 0.8176. In studies using dynamic contrast-enhanced, the pooled sensitivity and specificity were 0.73 (95% CI, 0.66 to 0.80) and 0.80 (95% CI, 0.69 to 0.88), respectively; pooled DOR, 10.83 (95% CI, 2.01 to 58.43); AUC, 0.9416; Q∗, 0.8795. In studies using arterial spin labeling, the pooled sensitivity and specificity were 0.79 (95% CI, 0.69 to 0.87) and 0.78 (95% CI, 0.67 to 0.87), respectively; pooled DOR, 15.63 (95% CI, 4.61 to 53.02); AUC, 0.8786; Q∗, 0.809.
Conclusions:
Perfusion magnetic resonance imaging displays moderate overall accuracy in identifying post-treatment radiation effect and tumor progression in patients with glioma. Based on the current evidence, DSC-PWI is a relatively reliable option for assessing tumor progression after glioma radiotherapy.
Keywords: glioma, meta-analysis, perfusion magnetic resonance imaging, radiotherapy, tumor progression
1. Introduction
Radiation therapy is an important modality used to treat glioma patients. However, radiation injury in the brain parenchyma has become 1 of its major complications.[1] Glioma post-treatment radiation effect (PTRE) and tumor progression tend to occur within 2 years after treatment. The blood-brain barrier can be damaged by the residual tumor or its recurrence, or the post-surgical radiotherapy.[2,3] However, these appear similarly on conventional images from magnetic resonance imaging (MRI) and computed tomography (CT) enhanced scans, presenting enhanced mass with irregular edema, space-occupying effect, and cystic necrosis.[4,5] Moreover, the tumor and PTRE share similar clinical symptoms, such as progressive local neurological deficits and intracranial hypertension. However, the treatment and prognosis of the 2 are quite different.[6,7] The PTRE is analogous to a positive treatment effect, and its incentive is to continue with the adjuvant temozolomide treatment given the patients with positive treatment effects. Tumor progression is a sign that the present treatment is not working, and should prompt treatment change that might have some benefits, or at least stop the toxicity from the futile treatment.
Therefore, early differentiation between PTRE and tumor progression would benefit the selection of suitable treatments and improve glioma patients’ prognosis. Currently, identification is made by perfusion-weighted imaging (PWI), magnetic resonance spectroscopy, diffusion-weighted imaging (DWI), and positron emission tomography-computed tomography (PET-CT). PWI is 1 of the most widely used clinical application methods, as it is convenient, accurate, and radiation-free.
Functionally, PWI can be divided into three categories: dynamic magnetic contrast-enhanced PWI (DSC-PWI), dynamic contrast-enhanced PWI (DCE-PWI), and arterial spin labeling PWI (ASL-PWI). In a region of interest, DSC-PWI is usually used to evaluate vascular density, blood volume, and blood flow; ASL-PWI mainly investigates the blood flow; DCE-PWI mainly assesses vascular permeability. When the region of interest is related to glioma tumor progression, high perfusion is observed due to tumor cell proliferation. Findings also include high capillary density, an increased number of new capillaries, immature development of the blood vessel wall, and high vascular permeability. On the other hand, when radiation necrosis occurs in the region of interest, tissue capillary stenosis or occlusion presents a low perfusion state. Each of the three PWI methods has advantages and disadvantages. DSC- and DCE-PWI are more widely used in clinical practice because of their higher signal-to-noise ratio in image quality compared to ASL-PWI. However, various side effects might exist in their clinical application because contrast agents should be used. ASL-PWI has no such concern because no contrast agents are injected into the body. An increasing number of scholars recommend a combination of imaging methods to differentiate between the 2 lesions. Nevertheless, due to the economic cost, patient cooperation, and examination time constraints, an optimal PWI pattern, combined with other imaging methods, is needed in clinical practice. Currently, the selection of the PWI technique (DSC, DCE, or ASL) is based on empirical or individual published literature. A previous study[8] found no difference in differentiating true glioma progression from pseudoprogression when using DSC-MRI. Yet, another meta-analysis[9] has suggested that the relative cerebral volume (rCBV) derived from DSC is the most commonly used parameter. Furthermore, no controlled study evaluating DSC, DCE, and ASL had been performed. Hence, it is necessary to conduct a systematic study on PWI evaluation of glioma tumor progression after radiotherapy.
In this study, the Cochrane system evaluation method was used to evaluate the value of perfusion MRI in the diagnosis of tumor progression after glioma radiotherapy. We compared the three PWI (DSC, DCE, and ASL) technologies and hypothesized that perfusion MRI has the potential to assess post-treatment radiation effects and tumor progression in patients with glioma.
2. Methods
2.1. Ethical statement
As this meta-analysis was performed based on published data, ethical approval was not required.
2.2. Literature search
The investigators performed a systematic Internet literature search in the Cochrane Library, PubMed, and Embase databases aiming to identify relevant articles published in English before March 2020. Key search terms were “PWI or perfusion-weighted imaging or MR perfusion imaging” and “brain neoplasms or glioma or gliomas or brain glioma” and “radiotherapy or PTRE or radiation injury or radionecrosis or pseudoprogression” and “sensitivity and specificity.” We further used Medical, Matrix Google, and other search engines to identify relevant literature on the Internet. The species was defined as “Humans.”
2.3. Inclusion and exclusion criteria
Inclusion criteria:
-
(1)
study type: prospective cohort study and retrospective case-control studies with at least ten participants;
-
(2)
objective: evaluate the value of PWI, using DSC-PWI, DCE-PWI, or ASL-PWI, for tumor progression diagnosis after glioma radiotherapy;
-
(3)
participants: patients with glioma (single or multiple lesions) that were treated with radiotherapy. Regardless of whether the patients underwent surgical treatment or chemotherapy, they have undergone MRI examination within three months after radiotherapy with no clear diagnosis;
-
(4)
statistical index: sensitivity, specificity, and accuracy of the evaluation, which could be calculated, using the original data, directly or indirectly;
-
(5)
diagnostic gold standard: pathological evidence based on tissue samples obtained by surgery or biopsy, or progressive increase of the lesions based on clinical and imaging follow-up;
-
(6)
blind evaluation.
Exclusion criteria:
-
(1)
literature not in English;
-
(2)
non-original research;
-
(3)
animal experiments and other basic researches;
-
(4)
published as “review,” “letter,” “comments,” “editorial,” “case report,” or “guidelines;”
-
(5)
studies without definitive radiotherapy.
2.4. Literature selection and data extraction
Literature was selected according to the inclusion and exclusion criteria; the full text was retrieved if it could not be readily determined whether a study is to be selected; disagreements about the selection were resolved through discussion. One person completed the data extraction and analysis under the guidance of professional experts. The investigator extracted from each study data that included information about the author, publication year, country, types of brain tumor, study design type (prospective or retrospective), number of participants and lesions, characteristics of the study population (age and sex), radiotherapy type and total dose, reference standard, follow-up time, blinding, equipment field strength, sequence of PWI, parameter of PWI, field strength, contrast agent, contrast injection rate, threshold of parameter, and results: true positive, false positive, true negative, and false negative results, sensitivity, and specificity In this study, the sensitivity, specificity, and diagnostic odds ratio (DOR) were analyzed to assess the value of the PWI-related methods (DSC-, DCE-, and ASL-PWI) in differentiating glioma tumor progression from PTRE.
2.5. Estimation of quality
The quality of the included studies was evaluated using the quality assessment of diagnostic accuracy studies 2 (QUADAS-2) tool. It includes 4 domains, assessing patient selection, index test, reference standard, flow and timing; in addition, concerns regarding applicability were also assessed in the first three domains,[10] as shown in Table 1. The studies quality assessment was done according to the responses (eg, yes, no, unclear; high risk, low risk, unclear; high concern, low concern, unclear) and based on the study design and the extracted patient data for the 4 domain questions.
Table 1.
Quality assessment of diagnostic studies.
| Domain | Signalling questions |
| Patient selection | A. risk of Bias |
| Was a consecutive or random sample of patients enrolled? (Yes, no, unclear) | |
| Was a case–control design avoided? (Yes, no, unclear) | |
| Did the study avoid inappropriate exclusions? (Yes, no, unclear) | |
| Could the selection of patients have introduced bias? (High risk, low risk, unclear) | |
| B. Concerns regarding applicability | |
| Are there concerns that the included patients and setting do not match the review question?((High concern, low concern, unclear) | |
| Index Test | A. Risk of bias |
| Were the index test results interpreted without knowledge of the results of the reference standard? (Yes, no, unclear) | |
| If a threshold was used, was it pre-specified? (Yes, no, unclear) | |
| Could the conduct or interpretation of the index test have introduced bias? (High risk, low risk, unclear) | |
| B. Concerns regarding applicability | |
| Are there concerns that the index test,its conduct,or interpretation differ from the review questiong? (High concern, low concern, unclear) | |
| Reference standard | A. Risk of bias |
| Is the reference standards likely to correctly classify the target condition? (Yes, no, unclear) | |
| Were the reference standards results interpreted without knowledge of the results of the index tests? (Yes, no, unclear) | |
| Could the reference standard,its conduct,or its interpretation have introduced bias? (High risk, low risk, unclear) | |
| B. Concerns regarding applicability | |
| Are there concerns that the target condition as defined by the reference standard does not match the question? (High concern, low concern, unclear) | |
| Flow and timing | A. Risk of bias |
| Was there an appropriate interval between index test and reference standard? | |
| (Yes, no, unclear) | |
| Did all patients receive the same reference standard? (Yes, no, unclear) | |
| Were all patients included in the analysis? (Yes, no, unclear) | |
| Could the patient flow have introduced bias? (High risk, low risk, unclear) |
2.6. Diagnostic efficacy evaluation index
The indices, including true positive, false positive, true negative, and false negative results, and the sensitivity and specificity of each test, were calculated based on the original data reported in the studies. The pooled sensitivity, specificity, DOR, Q∗ index (point at which the sensitivity and specificity are equal) and their 95% confidence interval (CI) were also calculated by Meta-DiSc 1.4. The summary receiver operating curves of the three diagnostic tests were plotted.
2.7. Statistical analysis
Meta-DiSc 1.4[11] was used to pool the sensitivity, specificity, and DOR, plot the summary receiver operating characteristic, analyze the heterogeneity of the studies (Spearman regression coefficient, inconsistency index I2, and Chi-square P test), performed meta-regression analysis, and subgroup analysis. P < .05 indicated that there was significant heterogeneity between studies. I2 was used to evaluate heterogeneity quantitatively. When I2 < 25%, the fixed-effects model was used; when 25% ≤ I2 ≤ 50%, the random-effects model was used; when I2 > 50%, we also used random-effects model and searched for the source of heterogeneity. Review Manager 5.3 software was used to generate the flow chart and funnel plot. QUADAS-2 was used to evaluate the method quality of the included studies. A funnel plot was drawn to judge whether there was publication bias. The graph presents a symmetric funnel shape when there is no bias, and deviates from the symmetric shape when publication bias is present.[12]
3. Results
3.1. Study selection
The search retrieved 315 relevant publications, from which 123 were excluded because they were duplicate publications or non-clinical or non-diagnostic studies; following the inclusion and exclusion criteria, 172 studies were excluded for noncompliance. Finally, this study included 20 studies[13–32] with 939 patients and 968 lesions (Fig. 1).
Figure 1.
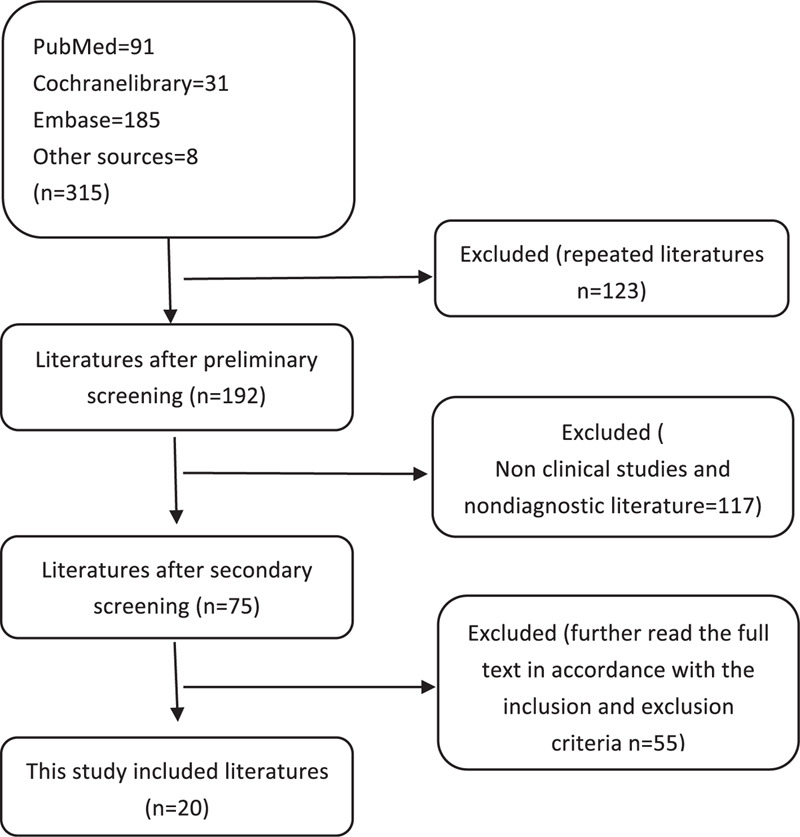
Flow chart.
3.2. Study characteristics
The 20 studies included 5 prospective studies[18,23,26,28,31] and 15 retrospective studies.[13–17,19–22,24,25,27,29,30,32] Tumor types included glioma (World Health Organization [WHO] grades II-IV), high-grade glioma, and glioblastoma. For a reference standard, 4 studies[16,18,21,24] obtained pathological results, 6 studies[13,19,20,23,25,31] used clinicoradiological diagnosis, and ten studies[14,15,17,22,26–30,32] used histopathologic and clinicoradiological diagnosis. The 4 studies with pathological results[16,18,21,24] performed no follow-up, while the follow-up interval in the other studies was 1–3 months, and most of the total follow-up time was longer than 6 months.[14,15,17,19,20,22,23,25,28,29,32] The lesions with a progressive increase in size and associated clinical deterioration were categorized as tumor progression. Enhancing lesions that remained stable or decreased in size on follow-up MRI without any clinical deterioration were classified as PTRE. One study was not blind,[30] in three studies,[13,15,32] the blinding status was not clear, and in 16 studies,[14,16–29,31] the physicians evaluating the images were blinded. Most of the studies had more than 2 image-reading physicians. All 20 studies included DSC-PWI, three studies[16,21,31] used maximum rCBV as a parameter, and the others used normalized rCBV. The rCBV is normalized by the ratio of blood volume in the lesion to that in the contralateral normal brain tissue; four studies[20,25,26,32] used DCE-PWI with volumetric transfer constant (K-trans). It is calculated by measuring the gadolinium-based contrast agent accumulation in the extravascular-extracellular space; three studies[22,27,29] used ASL-PWI with relative cerebral blood flow as a parameter. In 2 studies,[13,30] the MRI field strength was unclear. The others used 1.5 T or 3.0 T scanners. After reading the full texts, the basic information and diagnostic results were extracted. These are presented in Tables 2 and 3, and Fig. 2.
Table 2.
Study and patient characteristics of included studies.
| Study | Nation | Study design | Tumor type | Cases (M/F) | Lesions | Age (scope) | Radiothery/ total dose | Reference standard | Follow up (mo) | Blind |
| Xintao Hu 2011[13] | USA | retrospective | GBM | 31 | 31 | UN | UN | Clinicoradiological diagnosis (100%) | Interval time2–3mo | UN |
| Ramon F 2009[14] | USA | retrospective | GBM | 57 (33/24) | 57 | 54.2 ± 10.2 | EBRT | Histopathology + clinicoradiological diagnosis | Interval time2M/ total time>12mo | Image analyst |
| J.Cha 2014[15] | South Korea | retrospective | GBM | 35 (18/17) | 35 | 49 (24–70) | UN | Histopathology + clinicoradiological diagnosis | Interval time3M/ total time10–19mo | UN |
| Ho Sung Kim 2010[16] | South Korea | retrospective | High-Grade | 39 (22/17) | 39 | 48.2 (18–78) | UN | Histopathology | NO | Image analyst |
| Doo-Sik Kong 2011[17] | South Korea | retrospective | GBM | 59 | 59 | 50 (25–74) | UN | Histopathology + clinicoradiological diagnosis | Interval time2M/ total time6–48 mo | Image analyst |
| L.S. Hu 2009[18] | USA | prospective | High-Grade Glioma | 13 | 40 | UN | UN | Histopathology | NO | Image analyst |
| Tae-Hyung Kim 2017[19] | South Korea | retrospective | High-Grade Glioma | 51 (30/21) | 51 | 52.9 (25–72) | RT or gamma knife | clinicoradiological diagnosis | Total time >6 mo | Image analyst |
| Achim Seeger 2013[20] | Germany | retrospective | High-Grade Glioma | 40 (24/16) | 40 | 53.6 ± 13.6 | UN | clinicoradiological diagnosis | Total time 6–15 mo | Image analyst |
| S. Wang 2016[21] | UK | retrospective | GBM | 41 (27/14) | 41 | 55.71 ± 11.8 | UN | Histopathology | NO | Image analyst |
| Yu-Lin Wang 2018[22] | China | retrospective | GliomasWHO grade (II-IV) | 69 (50/19) | 69 | 41.6 (18–77) | UN/ 40–60 Gy | Histopathology + clinicoradiological diagnosis | Interval time2–3 mo/ total time6–96 mo | Image analyst |
| Nisha Rani 2018[23] | India | prospective | Gliomas WHO grade (II-IV) | 28 (18/10) | 28 | 41.4 ± 15.03 | UN/ 54.0– 60.0 Gy | Clinicoradiological diagnosis | Total time6–12 mo | Image analyst |
| A.J. Prager 2015[24] | USA | retrospective | High-Grade Gliomas | 68 (51/17) | 68 | 54.9 (22.6–79.4) | partial brain RT | Histopathology | NO | Image analyst |
| Kambiz Nael 2018[25] | USA | retrospective | GBM | 46 (28/18) | 46 | 32-78 | 59.4–60.0Gy | Clinicoradiological diagnosis | Total time 9–13 mo | Image analyst |
| Nader Zakhari 2019[26] | Canada | prospective | High-Grade Gliomas | 66 (43/23) | 68 | 54.1 (50.9–57.3) | 60.0Gy | Histopathology + clinicoradiological diagnosis | interval time1–3 mo | Image analyst |
| Young Jun Choi 2013[27] | South Korea | retrospective | GBM | 62 (37/25) | 62 | 49.3 (22–79) | 60.0Gy | Histopathology + clinicoradiological diagnosis | Interval time2–3 mo | Image analyst |
| Heba M. Soliman 2018[28] | Egypt | prospective | Gliomas WHO grade (II-IV) | 20 (14/6) | 20 | 49.5 (15–85) | UN | Histopathology + clinicoradiological diagnosis | Total time 6–12 mo | Image analyst |
| Qian Xu 2017[29] | China | retrospective | Gliomas WHO grade (II-IV) | 29 (17/12) | 29 | 47 ± 11 | UN | Histopathology + clinicoradiological diagnosis | Interval time3M/ total time>6 mo | Image analyst |
| Z. Qiao 2019[30] | China | retrospective | High-Grade Gliomas | 42 | 42 | UN | 3D conformal radiation therapy or gamma knife | Histopathology + clinicoradiological diagnosis | Interval time>3 mo | NO |
| Eike Steidl 2019[31] | Germany | prospective | GBM | 16 (8/8) | 16 | 58 (43–76) | UN | clinicoradiological diagnosis | Interval time1.5 mo/ total time1.5–14 mo | Image analyst |
| Nabil Elshafeey 2019[32] | USA | retrospective | GBM | 98 (67/31) | 98 | UN | UN | Histopathology + clinicoradiological diagnosis | Total time24 mo | UN |
Table 3.
MRI characteristics of the included studies.
| Study | Sequence | Parameter | Field strength (T) | Contrast agent | Contrast injection rate | Threshold |
| Xintao Hu 2011[13] | DSC (SVM) | normalized rCBV | UN | UN | UN | rCBV>1.14 |
| Ramon F 2009[14] | DSC | normalized rCBV | 1.5 | Gadopentetate 0.1 mmol/kg | 5ml/s | rCBV>1.75 |
| J.Cha 2014[15] | DSC | normalized rCBV | 3.0 | Gadopentetate 0.1 mmol/kg | UN | rCBV>1.8 |
| Ho Sung Kim 2010[16] | DSC | max rCBV | 3.0 | Gadopentetate 0.1 mmol/kg | 4mL/s | rCBVmax>2.6 |
| Doo-Sik Kong 2011[17] | DSC | normalized rCBV | 3.0 | Gadobutrol 0.1 mmol/kg | 4mL/s | rCBV>1.47 |
| L.S. Hu 2009[18] | DSC | normalized rCBV | 3.0 | Gadodiamide 0.15 mmol/kg | 3-5mL/s | rCBV>0.71 |
| Tae-Hyung Kim 2017[19] | DSC | normalized rCBV | 3.0 | Gadobutrol 0.1 mmol/kg | 4mL/s | rCBV>1.07 |
| Achim Seeger 2013[20] | DSC/DCE | normalized rCBV/K trans | 1.5 | Gadobutrol 0.1 mmol/kg | 3mL/s | rCBV>1.14 Ktrans>0.058 |
| S. Wang 2016[21] | DSC | max rCBV | 3.0 | Gadopentetate 0.07 mmol/kg | 5mL/s | rCBVmax>4.06 |
| Yu-Lin Wang 2018[22] | DSC/ASL | normalized rCBV/rCBF | 3.0 | Gadolinium 0.1 mmol/kg | 4mL/s | rCBV>2.86 rCBF>1.86 |
| Nisha Rani 2018[23] | DSC | normalized rCBV | 1.5 or 3.0 | Gadopentetate 0.1 5mmol/kg | 3-5mL/s | rCBV>2.12 |
| A.J. Prager 2015[24] | DSC | normalized rCBV | 1.5 or 3.0 | Gadopentetate 0.07mmol/kg | 5mL/s | rCBV>1.27 |
| Kambiz Nael 2018[25] | DSC/DCE | normalized rCBV/K-trans | 1.5 or 3.0 | Gadopentetate 0.15mmol/kg | 5mL/s | rCBV>2.2 K-trans(min−1) >0.1 |
| Nader Zakhari 2019[26] | DSC/DCE | normalized rCBV/K-trans | 3.0 | UN | UN | rCBV>2.74 K-trans(min−1) >0.07 |
| Young Jun Choi 2013[27] | DSC/ASL | normalized rCBV/rCBF | 3.0 | Gadopentetate 0.1 mmol/kg | 4mL/s | UN/UN |
| Heba M. Soliman 2018[28] | DSC | normalized rCBV | 1.5 | Dotarem 0.1 mmol/kg | UN | rCBV>1.8 |
| Qian Xu 2017[29] | DSC/ASL | normalized rCBV/rCBF | 3.0 | Gadopentetate 0.2 mmol/kg | 3mL/s | rCBV>3.64 rCBF<1.11 |
| Z. Qiao 2019[30] | DSC | normalized rCBV | UN | UN | UN | rCBV>1.83 |
| Eike Steidl 2019[31] | DSC | max rCBV | 3.0 | Gadovist 0.1 mmol/kg | 4mL/s | rCBV>2.75 |
| Nabil Elshafeey 2019[32] | DSC/DCE (SVM) | normalized rCBV/K-trans | 3.0 | UN | UN | SVM models |
Figure 2.
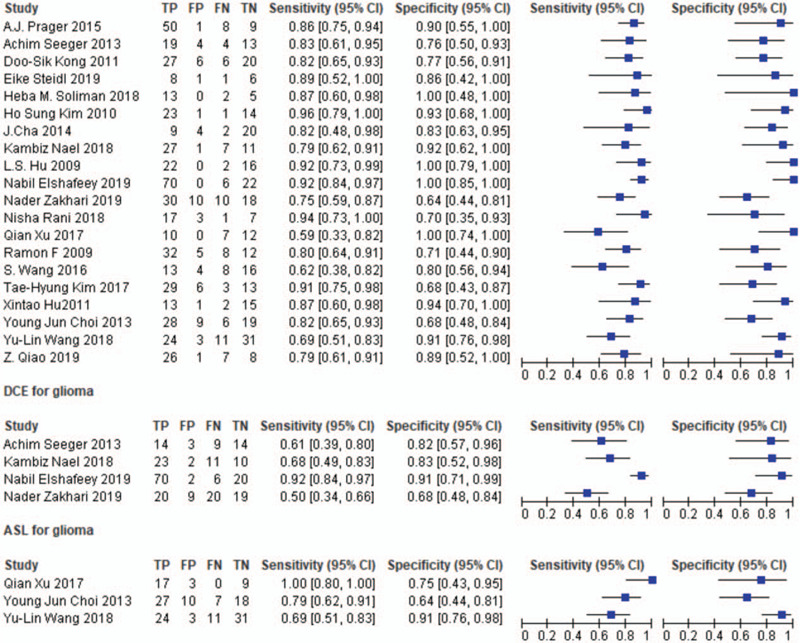
Diagnostic results.
3.3. Quality assessment
The quality of the included studies[13–32] is shown in Fig. 3. The graphical display of QUADAS-2 results shows a low risk of bias and high applicability. Each domain is presented as percentages across the included studies shown in Fig. 3.
Figure 3.
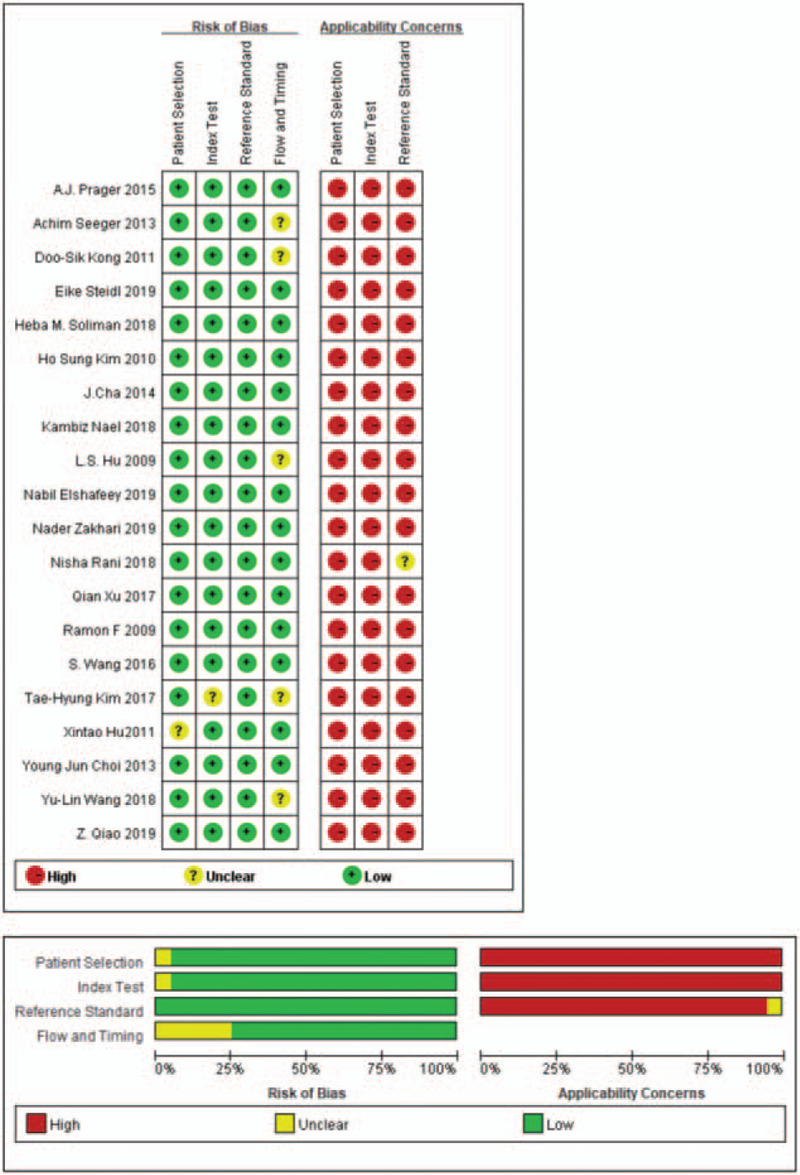
The quality of included studies.
3.4. Meta analysis results
When assessed for the ability to differentiate tumor progression from PTRE, the DSC-PWI group's pooled sensitivity and specificity with their corresponding 95% confidence intervals (CI) were 0.83 (95% CI, 0.79 to 0.86) and 0.83 (95% CI, 0.78 to 0.87), respectively. The pooled DOR for this group was 21.31 (95% CI, 13.07 to 34.73), area under the curve (AUC) = 0.8870, and Q∗ = 0.8176, as shown in Fig. 4a-d. The DCE-PWI group's pooled sensitivity and specificity with corresponding 95% CI were 0.73 (95% CI, 0.66 to 0.80) and 0.80 (95% CI, 0.69 to 0.88), respectively. The pooled DOR for this group was 10.83 (95% CI, 2.01 to 58.43), AUC = 0.9416, and Q∗ = 0.8795, as Fig. 5a-d. The ASL-PWI group's pooled sensitivity and specificity with corresponding 95% CI were 0.79 (95% CI, 0.69 to 0.87) and 0.78 (95% CI, 0.67 to 0.87), respectively. The pooled DOR for this group was 15.63 (95% CI, 4.61 to 53.02), AUC = 0.8786, and Q∗ = 0.8090, as shown in Fig. 6a-d. Of these, the DSC group had the highest sensitivity and specificity.
Figure 4.
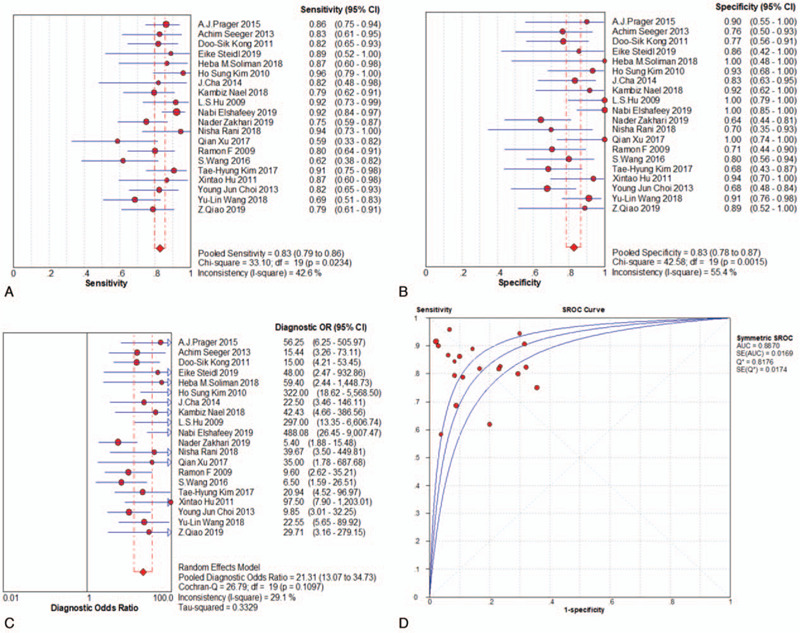
Meta analysis results-DSC group.
Figure 5.
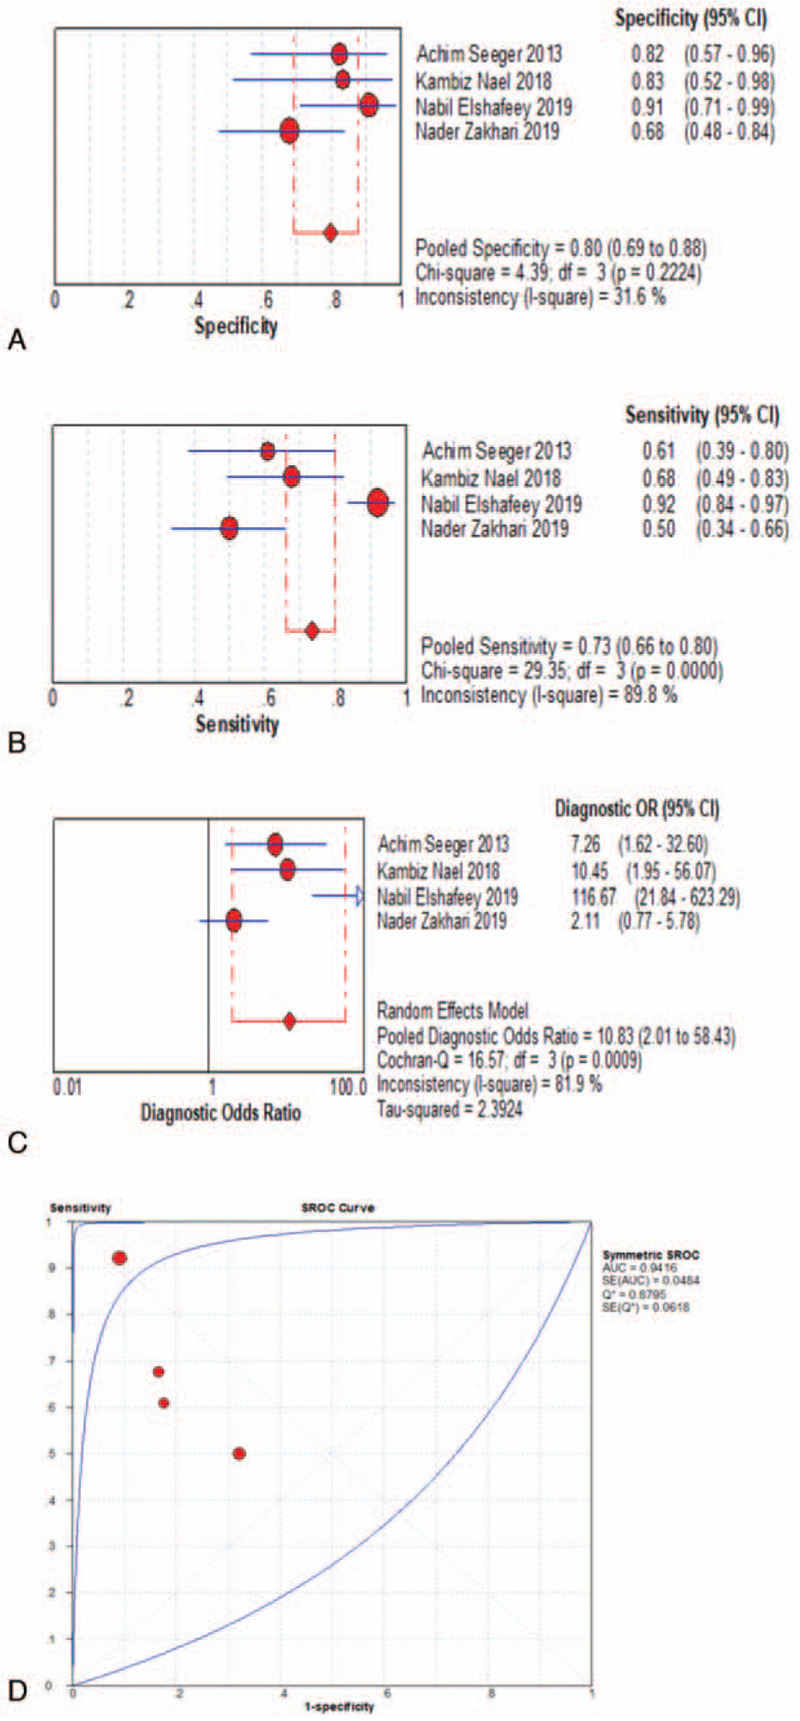
Meta analysis results-DCE group.
Figure 6.
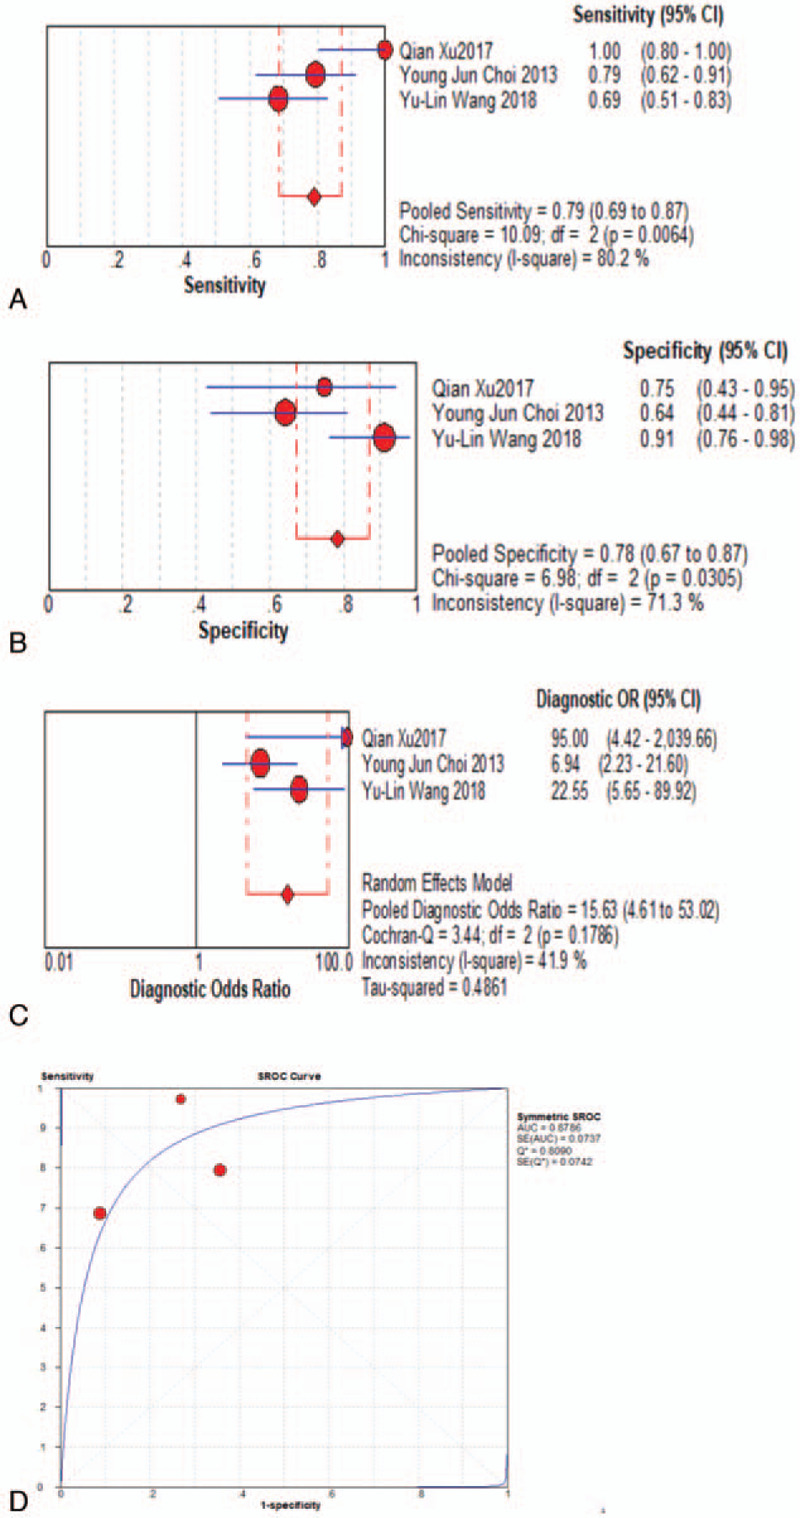
Meta analysis results-ASL group.
3.5. Heterogeneity evaluation and publication bias
The heterogeneity test for pooled sensitivities and specificities in the DSC group showed I2 = 42.6% (P = .023) and I2 = 55.4% (P = .002), respectively (Fig. 4A-B). As there was medium and obvious heterogeneity, respectively, the random-effects model was used. The pooled DOR showed moderate heterogeneity (I2 = 29.1%, P = .110; Fig. 4c), so a random-effects model was used. The Spearman correlation coefficient was -0.15 (P = .527), indicating no threshold effect. The funnel plot showed a concentrated distribution of the points with a roughly symmetrical funnel shape, indicating the absence of apparent publication bias (Fig. 7). For the DCE group, there was significant heterogeneity for sensitivity (I2 = 89.8%, P = .000), and DOR (I2 = 81.9%, P = .001), no significant heterogeneity for specificity (I2 = 31.6%, P = .222). For the ASL group, significant heterogeneity was noted for sensitivity (I2 = 80.2%, P = . 006), and specificity (I2 = 71.3%, P = .031), no significant heterogeneity for DOR (I2 = 41.9%, P = .179) (Fig. 5A-C and Fig. 6A-C). Threshold effect and publication bias could not be assessed because there were so few studies in DCE and ASL groups. Consequently, the random-effects model was used to analyze the pooled sensitivities and specificities in these groups.
Figure 7.
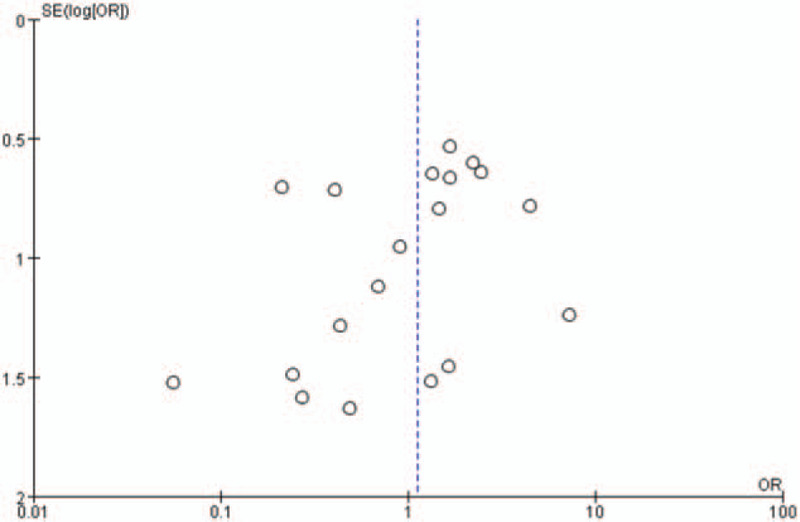
Funnel plot.
3.6. Meta regression analysis
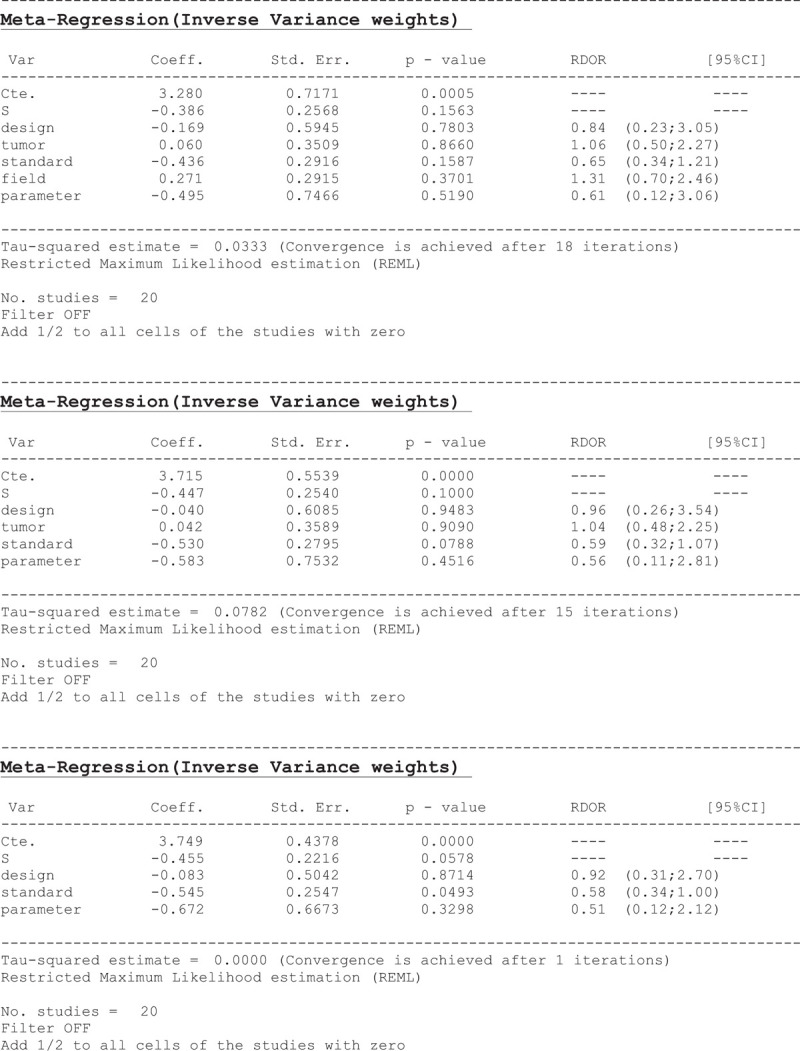
A single-factor meta-regression analysis was used in search of the possible heterogeneity influencing factors, such as study design, tumor type, reference standard, field strength, and parameter of PWI. Finally, we found that the field strength and tumor type were the heterogeneity-causing factors (Table 4).
Table 4.
Meta regression.
3.7. Subgroup analysis
Subgroup analyses were performed to clarify the specific impact of some factors on the heterogeneity of the research results.[2] Three studies[14,20,28] used a field strength of 1.5 T, and their pooled sensitivity and specificity were 0.821 and 0.769, respectively. Twelve studies [15–19,21,22,26,27,29,31,32] used 3.0 T scanners; their pooled sensitivity and specificity were 0.823 and 0.825, respectively. Three studies[23–25] used 1.5 T and 3.0 T scanners; their pooled sensitivity and specificity were 0.855 and 0.844, respectively. In 2 studies,[13,30] it was not clear what was the field strength used. Their pooled sensitivity and specificity were 0.813 and 0.920, respectively. For tumor type, nine studies reported on GBM,[13–15,17,21,25,27,31,32] and their pooled sensitivity and specificity were 0.832 and 0.820, respectively. High-grade glioma was reported in 7 studies,[16,18–20,24,26,30] with pooled sensitivity and specificity of 0.850 and 0.798, respectively. Gliomas of World Health Organization grades II-IV[1] were analyzed in 4 studies[22,23,28,29] with pooled sensitivity and specificity of 0.753 and 0.902, respectively.
4. Discussion
Postoperative radiotherapy, alone or in combination with chemotherapy, can significantly improve glioma patients’ prognosis. At present, it is the standard therapeutic regimen, but in the course of radiotherapy, acute, sub-acute, and chronic radiation, brain injury often occurs, and is easily confused with tumor progression.[34,35] The differentiation of tumor progression from PTRE is mainly based on biopsy. However, patients rarely undergo histological examination after surgery. Moreover, biopsy specimens do not represent all lesions. Therefore, a clinicoradiological diagnosis is used in clinical practice to judge whether there is tumor progression or PTRE.[36,37] A variety of functional imaging methods, such as PET-CT, DWI, Magnetic resonance spectroscopy, and PWI, are used to evaluate glioma after radiotherapy.[33,35,37] However, PET-CT requires cyclotron, DWI can be affected by complex pathological tissue, and MRS has a high operator dependency. Consequently, PWI is 1 of the main imaging evaluation methods in clinical application, but there is no clear systematic study or clinical guideline for selecting between DSC, DCE, and ASL. Therefore, physicians choose based on their own experience.
We collected for this study prospective and retrospective reports on PWI, aiming to evaluate gliomas after radiotherapy and perform statistical analysis. The results show that all 3 methods (DSC, DCE, and ASL) had high pooled sensitivity and specificity. The DSC was the most advantageous, with pooled sensitivity and specificity of 0.83 and pooled DOR of 21.31. These findings indicate that rCBV, derived from DSC evaluation of gliomas after radiotherapy, is advantageous, leading to improved sensitivity, specificity, and diagnostic accuracy. For this reason, DSC-PWI is a relatively reliable option for assessing tumor progression after gliomas radiotherapy. Still, this research has some limitations due to the retrospective case-control studies were included and statistical analysis. However, similar to our results, a meta-analysis[38] reported that perfusion MRI (DSC-PWI) could improve the diagnostic accuracy in glioma treatment response assessment. Other studies did not compare the 3 PWI technologies for glioma tumor progression evaluation after radiotherapy. Other research had recommended multiple parameters, but we found that rCBV, a single parameter acquired for DSC-PWI, is a reliable and economical option. In the age of radiomics and machine learning, combining the findings from this study and other image analysis techniques could possibly lead to a more accurate differentiation.
There was general heterogeneity between the included studies for the DSC group. We first eliminated the possibility of a threshold effect through the Spearman correlation coefficient. Meta-regression and subgroup analyses were used to assess the main factors influencing heterogeneity. After subgroup analysis for field strength, we found no apparent differences in sensitivity. At 0.920, the specificity of the unclear field strength group was significantly higher than the others. We found that in 1 of the studies,[25] the unclear field strength applied supports vector machine technology that could increase the diagnostic accuracy. After subgroup analysis for the tumor type, the sensitivities of the GBM and high-grade gliomas groups were significantly higher than that of the gliomas grade II-IV group, at 0.83, 0.85, and 0.75, respectively. However, the gliomas grade II-IV group had a good specificity of 0.90. A recent meta-analysis[39] showed that DSC-PWI demonstrated relatively good accuracy in separating viable tumors from treatment-related changes when evaluating high-grade gliomas, with a sensitivity of 0.90, higher than our results. There seems to be lower vascular density in grade II gliomas, which can decrease the rCBV. However, GBM and high-grade gliomas constituted the majority of our study.
We acknowledge some limitations of this systematic review and meta-analysis. First, we used QUADAS-2 to evaluate the methodological quality of the included studies. Fifteen case-control studies[13–17,19–22,24,25,27,29,30,32] were included to obtain more effective data, which might lead to selection and performance bias. Second, the DCE and ASL groups included only 4 and 3 studies, respectively; consequently, heterogeneity analysis was not performed. Third, the diagnostic reference standard was not unified; only 4 studies[16,18,21,24] obtained all the pathological results, while the others relied on clinicoradiological or combined histopathological and clinicoradiological diagnosis. For all the pathological results, we expect a perfect brain biopsy for brain tumor diagnosis, but there is a possibility that the needle did not penetrate the tumor during biopsy. Four studies[13,16,27,30] had unclear total follow-up time; thus, there is a risk of short follow-up. Fourth, 3 studies[16,21,31] of the DSC group used maximum rCBV as a parameter. The meta-regression analysis indicated that the reference standard and parameter of PWI were not the main factors influencing the heterogeneity. Two studies[13,32] used support vector machine models; there were also different contrast medium injection rates and thresholds. Fifth, only 1 study[25] explicitly excluded nontemozolomide chemotherapy, as a result, nontemozolomide chemotherapy application is unclear. all of which may have impacted the heterogeneity of the included studies. Therefore, we suggest that large-scale, quality-controlled studies should be conducted in the future, especially for comparing DCE with ASL-PWI.
5. Conclusion
As a non-invasive method, perfusion MRI displayed moderate overall accuracy in differentiating PTRE from tumor progression in glioma patients treated with radiotherapy. More studies were supporting the high sensitivity and specificity of DSC-PWI. DSC-PWI is a relatively reliable option for assessing tumor progression after glioma radiotherapy. Although there was moderate accuracy for DCE and ASL-PWI, more high-quality clinical controlled studies are needed to further clarify this result.
Acknowledgments
We would like to thank Editage (www.editage.com) for English language editing.
Author contributions
Conceptualization: Longlong Wang, Lizhou Wei.
Data curation: Lizhou Wei.
Formal analysis: Longlong Wang.
Investigation: Longlong Wang.
Methodology: Lizhou Wei.
Project administration: Jingjian Wang.
Resources: Na Li.
Software: Longlong Wang, Lizhou Wei.
Supervision: Jingjian Wang, Yanzhong Gao.
Validation: Na Li, Yanzhong Gao.
Writing – original draft: Hongge Ma, Xinran Qu.
Writing – review & editing: Longlong Wang, Ming Zhang.
Footnotes
Abbreviations: ASL = arterial spin labeling, AUC = area under the curve, CI = confidence interval, DCE-MRI = dynamic contrast-enhanced magnetic resonance imaging, DOR = diagnostic odds ratio, DWI = diffusion-weighted imaging, MRI = magnetic resonance imaging, PET-CT = positron emission tomography – computed tomography, PTRE = post-treatment radiation effect, PWI = perfusion weighted imaging, rCBF = relative cerebral flow, WHO = World Health Organization.
How to cite this article: Wang L, Wei L, Wang J, Li N, Gao Y, Ma H, Qu X, Zhang M. Evaluation of perfusion MRI value for tumor progression assessment after glioma radiotherapy: A systematic review and meta-analysis. Medicine. 2020;99:52(e23766).
The authors have no conflicts of interest to disclose.
All data generated or analyzed during this study are included in this published article [and its supplementary information files.
Cases (the number of included patients), lesions (the number of included brain tumor), GBM = glioblastoma, RT= radiation therapy), EBRT = external beam radiation therapy, UN (unclear),WHO = World Health Organization.
Sequence (PWI sequence), parameter (PWI parameter), DSC (dynamic susceptibility contrast imaging), DCE (dynamic contrast-enhanced imaging), ASL (arterial spin labeling), SVM (support vector machine), UN (unclear), threshold (threshold of DSC, DCE or ASL), rCBV (relative cerebral volume), rCBF (relative cerebral flow).
References
- [1].Parvez K, Parvez A, Zadeh G. The Diagnosis and treatment of pseudoprogression, radiation necrosis and brain tumor recurrence. Int J Mol Sci 2014;15:11832–46. [DOI] [PMC free article] [PubMed] [Google Scholar]
- [2].Ellingson BM, Chung C, Pope WB, et al. Pseudoprogression, radionecrosis, inflammation or true tumor progression? challenges associated with glioblastoma response assessment in an evolving therapeutic landscape. J Neurooncol 2017;134:495–504. [DOI] [PMC free article] [PubMed] [Google Scholar]
- [3].Grossman R, Shimony N, Hadelsberg U, et al. Impact of resecting radiation necrosis and pseudoprogression on survival of patients with glioblastoma. World Neurosurg 2016;89:37–41. [DOI] [PubMed] [Google Scholar]
- [4].Abbasi AW, Westerlaan HE, Holtman GA, et al. Incidence of tumor Progression and pseudoprogression in High-Grade Gliomas: a Systematic Review and Meta-Analysis. Clin Neuroradiol 2017;28:1–1. [DOI] [PMC free article] [PubMed] [Google Scholar]
- [5].Furuse M, Nonoguchi N, Yamada K, et al. Radiological diagnosis of brain radiation necrosis after cranial irradiation for brain tumor: a systematic review. Radiat Oncol 2019;14:28. [DOI] [PMC free article] [PubMed] [Google Scholar]
- [6].Brandsma D, Stalpers L, Taal W, et al. van den Bent M J Clinical features, mechanisms, and management of pseudoprogression in malignant gliomas. Lancet Oncol 2008;9:453–61. [DOI] [PubMed] [Google Scholar]
- [7].Tran DK, Jensen RL. Treatment-related brain tumor imaging changes: So-called “pseudoprogression” vs. tumor progression: Review and future research opportunities. Surg Neurol Int 2013;17:129–35. [Google Scholar]
- [8].Song YS, Choi SH, Park CK, et al. True progression versus pseudoprogression in the treatment of glioblastomas: a comparison study of normalized cerebral blood volume and apparent diffusion coefficient by histogram analysis. Korean J Radiol 2013;14:662–72. [DOI] [PMC free article] [PubMed] [Google Scholar]
- [9].Suh CH, Kim HS, Jung SC, et al. Multiparametric MRI as a potential surrogate endpoint for decision-making in early treatment response following concurrent chemoradiotherapy in patients with newly diagnosed glioblastoma: a systematic review and meta-analysis. Eur Radiol 2018;28:2628–38. [DOI] [PubMed] [Google Scholar]
- [10].Buck AK, Hetzel M, Schirrmeister H, et al. Clinical relevance of imaging proliferative activity in lung nodules. Eur J Nucl Med Mol Imaging 2005;32:525–33. [DOI] [PubMed] [Google Scholar]
- [11].Zamora J, Abraira V, Muriel A, et al. Meta-DiSc: a software for meta-analysis of test accuracy data. BMCMed Res Methodol 2006;6:31. [DOI] [PMC free article] [PubMed] [Google Scholar]
- [12].Song F, Khan KS, Dinnes J, et al. Asymmetric funnel plots and publication bias inmeta-analyses of diagnostic accuracy. Int J Epidemiol 2002;31:88–95. [DOI] [PubMed] [Google Scholar]
- [13].Hu X, Wong KK, Young GS, et al. Support vector machine multiparametric MRI identification of pseudoprogression from tumor recurrence in patients with resected glioblastoma. J Magn Reson Imaging 2011;33:296–305. [DOI] [PMC free article] [PubMed] [Google Scholar]
- [14].Barajas RF, Chang JS, Segal MR, et al. Differentiation of recurrent glioblastoma multiforme from radiation necrosis after external beam radiation therapy with dynamic susceptibility-weighted contrast-enhanced perfusion MR imaging. Radiology 2009;253:486–96. [DOI] [PMC free article] [PubMed] [Google Scholar]
- [15].Cha J, Kim ST, Kim HJ, et al. Differentiation of tumor progression from pseudoprogression in patients with posttreatment glioblastoma using multiparametric histogram analysis. AJNR Am J Neuroradiol 2014;35:1309–17. [DOI] [PMC free article] [PubMed] [Google Scholar]
- [16].Kim HS, Kim JH, Kim SH, et al. Posttreatment high-grade glioma: usefulness of peak height position with semiquantitative MR perfusion histogram analysis in an entire contrast-enhanced lesion for predicting volume fraction of recurrence. Radiology 2010;256:906–15. [DOI] [PubMed] [Google Scholar]
- [17].Kong DS, Kim ST, Kim EH, et al. Diagnostic dilemma of pseudoprogression in the treatment of newly diagnosed glioblastomas: the role of assessing relative cerebral blood flow volume and oxygen-6-methylguanine-DNA methyltransferase promoter methylation status. AJNR Am J Neuroradiol 2011;32:382–7. [DOI] [PMC free article] [PubMed] [Google Scholar]
- [18].Hu LS, Baxter LC, Smith KA, et al. Relative cerebral blood volume values to differentiate high-grade glioma recurrence from posttreatment radiation effect: direct correlation between image-guided tissue histopathology and localized dynamic susceptibility-weighted contrast-enhanced perfusion MR imaging measurements. AJNR Am J Neuroradiol 2009;30:552–8. [DOI] [PMC free article] [PubMed] [Google Scholar]
- [19].Kim TH, Yun TJ, Park CK, et al. Combined use of susceptibility weighted magnetic resonance imaging sequences and dynamic susceptibility contrast perfusion weighted imaging to improve the accuracy of the differential diagnosis of recurrence and radionecrosis in high-grade glioma patients. Oncotarget 2017;8:20340–53. [DOI] [PMC free article] [PubMed] [Google Scholar]
- [20].Seeger A, Braun C, Skardelly M, et al. Comparison of three different MR perfusion techniques and MR spectroscopy for multiparametric assessment in distinguishing recurrent high-grade gliomas from stable disease. Acad Radiol 2013;20:1557–65. [DOI] [PubMed] [Google Scholar]
- [21].Wang S, Martinez-Lage M, Sakai Y, et al. Differentiating tumor progression from pseudoprogression in patients with glioblastomas using diffusion tensor imaging and dynamic susceptibility contrast MRI. AJNR Am J Neuroradiol 2016;37:28–36. [DOI] [PMC free article] [PubMed] [Google Scholar]
- [22].Wang YL, Chen S, Xiao HF, et al. Differentiation between radiation-induced brain injury and glioma recurrence using 3D pCASL and dynamic susceptibility contrast-enhanced perfusion-weighted imaging. Radiother Oncol 2018;129:68–74. [DOI] [PubMed] [Google Scholar]
- [23].Rani N, Singh B, Kumar N, et al. Differentiation of AVE 99mTc MDM (Bis-Methionine-DTPA) Brain SPECT/CT and Dynamic Susceptibility Contrast-Enhanced MR Perfusion: a comparative study. Clin Nucl Med 2018;43:e74–81. [DOI] [PubMed] [Google Scholar]
- [24].Prager AJ, Martinez N, Beal K, et al. Diffusion and perfusion MRI to differentiate treatment-related changes including pseudoprogression from recurrent tumors in high-grade gliomas with histopathologic evidence. AJNR Am J Neuroradiol 2015;36:877–85. [DOI] [PMC free article] [PubMed] [Google Scholar]
- [25].Nael K, Bauer AH, Hormigo A, et al. Multiparametric MRI for differentiation of radiation necrosis from recurrent tumor in patients with treated glioblastoma. AJR Am J Roentgenol 2018;210:18–23. [DOI] [PubMed] [Google Scholar]
- [26].Zakhari N, Taccone MS, Torres CH, et al. Prospective comparative diagnostic accuracy evaluation of dynamic contrast-enhanced (DCE) vs. dynamic susceptibility contrast (DSC) MR perfusion in differentiating tumor recurrence from radiation necrosis in treated high-grade gliomas. J Magn Reson Imaging 2019;50:573–82. [DOI] [PubMed] [Google Scholar]
- [27].Choi YJ, Kim HS, Jahng GH, et al. Pseudoprogression in patients with glioblastoma: added value of arterial spin labeling to dynamic susceptibility contrast perfusion MR imaging. Acta Radiol 2013;54:448–54. [DOI] [PubMed] [Google Scholar]
- [28].Soliman HM, ElBeheiry AA, Abdel-Kerim AA, et al. Recurrent brain tumor versus radiation necrosis; can dynamic susceptibility contrast (DSC) perfusion magnetic resonance imaging differentiate? Egypt J Radiol Nucl Med 2018;49:719–26. [Google Scholar]
- [29].Xu Q, Liu Q, Ge H, et al. Tumor recurrence versus treatment effects in glioma: a comparative study of three dimensional pseudo-continuous arterial spin labeling and dynamic susceptibility contrast imaging. Medicine (Baltimore) 2017;96:e9332. [DOI] [PMC free article] [PubMed] [Google Scholar]
- [30].Qiao Z, Zhao X, Wang K, et al. Utility of dynamic susceptibility contrast perfusion-weighted mr imaging and (11)C-Ahionine PET/CT for differentiation of tumor recurrence from radiation injury in patients with high-grade gliomas. AJNR Am J Neuroradiol 2019;40:253–9. [DOI] [PMC free article] [PubMed] [Google Scholar]
- [31].Steidl E, Muller M, Muller A, et al. Longitudinal, leakage corrected and uncorrected rCBV during the first-line treatment of glioblastoma: a prospective study. J Neurooncol 2019;144:409–17. [DOI] [PubMed] [Google Scholar]
- [32].Elshafeey N, Kotrotsou A, Hassan A, et al. Multicenter study demonstrates radiomic features derived from magnetic resonance perfusion images identify pseudoprogression in glioblastoma. Nat Commun 2019;10:3170. [DOI] [PMC free article] [PubMed] [Google Scholar]
- [33].Cicone F, Minniti G, Romano A, et al. Accuracy of F-DOPA PET and perfusion-MRI for differentiating radionecrotic from progressive brain metastases after radiosurgery. Eur J Nucl Med Mol Imaging 2015;42:103–11. [DOI] [PubMed] [Google Scholar]
- [34].Combs SE, Widmer V, Thilmann C. stereotactic radiosurgery (SRS); treatmeant option for recurrent glioblastoma multiforme(GBM). Cancer 2005;104:2168–73. [DOI] [PubMed] [Google Scholar]
- [35].Shiroishi MS, Castellazzi G, Boxerman JL, et al. Principles of T2 ∗-weighted dynamic susceptibility contrast MRI technique in brain tumor imaging. J Magn Reson Imaging 2015;41:296–313. [DOI] [PubMed] [Google Scholar]
- [36].Jafri NF, Clarke JL, Weinberg V, et al. Relationship of glioblastoma multiforme to the subventricular zone is associated with survival. Neuro Oncol 2013;15:91–6. [DOI] [PMC free article] [PubMed] [Google Scholar]
- [37].Nakajima T, Kumabe T, Kanamori M, et al. Differential diagnosis between radiation necrosis and glioma progression using sequential proton magnetic resonance spectroscopy and methionine positron emission tomography. Neurol Med Chir (Tokyo) 2009;49:394–401. [DOI] [PubMed] [Google Scholar]
- [38].Wan B, Wang S, Tu M, et al. The diagnostic performance of perfusion MRI for differentiating glioma recurrence from pseudoprogression: a meta-analysis. Medicine 2017;96:6333. [DOI] [PMC free article] [PubMed] [Google Scholar]
- [39].Patel P, Baradaran H, Delgado D, et al. MR perfusion-weighted imaging in the evaluation of high-grade gliomas after treatment: a systematic review and meta-analysis. Neuro Oncol 2016;19:100. [DOI] [PMC free article] [PubMed] [Google Scholar]


