Abstract
The levels of indoor air pollutants are increasing. However, the indoor air quality of only operating rooms, intensive care units, and radiology departments is usually monitored in hospitals. Hence, we aimed to evaluate the indoor air quality of an otorhinolaryngology outpatient clinic and compare air quality indices among different areas in a hospital.
We prospectively measured indoor air quality using air quality sensors in different areas of a hospital from February 1, 2019 to January 31, 2020. Carbon dioxide (CO2), total volatile organic compounds (VOCs), particulate matter with diameter of <2.5 μm (PM2.5), and nitrogen dioxide concentrations were measured in the otorhinolaryngology clinic, orthopedic clinic, and reception area. The intervention efficacy was compared between otorhinolaryngology clinics employing and not employing air-cleaners.
The overall concentrations of CO2, VOCs, and PM2.5 in the otorhinolaryngology clinic were significantly higher than those in the orthopedic clinic or reception area. The indoor air quality was the worst in winter. The intervention effect was observed only in PM2.5 concentrations in otorhinolaryngology clinics employing an air-cleaner.
Medical practitioners and patients are frequently exposed to ambient indoor air pollution in otorhinolaryngology clinics. Hence, health-related strategies to protect against ambient indoor air pollution in otorhinolaryngology clinics are warranted.
Keywords: carbon dioxide, health, hospital, nitrogen dioxide, particulate matter, volatile organic compounds
1. Introduction
The quality of outdoor air is associated with vehicle and industrial pollution. However, the quality of indoor air in public utility buildings is influenced by a range of environmental factors.[1,2] Indoor air quality is influenced by the emissions from building materials and furnishings; central heating and cooling systems; humidification devices; moisture creating processes; electronic equipment; products used for household cleaning; and behavior of building occupants such as smoking. Indoor air pollutants usually consist of various chemicals such as gases (e.g., carbon dioxide, nitrogen dioxide), volatile organic compounds (VOCs), and particulate matter.[3–6] Increasing evidence suggests that chronic exposure to these pollutants is associated with reduced pulmonary function, respiratory symptoms such as allergic rhinitis and/or asthma, cardiovascular disease, and/or cancer.[7–10]
Generally, hospitals have specialized departments (e.g., operating rooms, intensive care units, radiology departments, and outpatient clinics) that provide specific medical services. In terms of air quality in hospitals, most studies have focused on the air quality in operating rooms to minimize the risk of surgical site infections and/or exposure to chemicals such as VOCs and radon in intensive care units or radiology departments.[11–13] However, to date, little attention has been given to the air quality of outpatient clinics. Otorhinolaryngology physicians spend most of their time in an otorhinolaryngology clinic with patients and other healthcare personnel. Otorhinolaryngology clinics are mostly closed and are frequently exposed to gases expelled from individuals in the clinic, use of disinfectant sprays, and various procedures such as electrocautery, biopsy, and incision and drainage. Moreover, the disinfection and cleansing processes for otorhinolaryngology equipment could increase air pollution. Thus, an otorhinolaryngology clinic is a relatively high-risk area in terms of poor indoor air quality. Inadequate air quality could cause health problems in the healthcare personnel who work in the otorhinolaryngology clinic and affect the level of comfort in the clinic. Therefore, in this study, we aimed to evaluate the indoor air quality of an otorhinolaryngology outpatient clinic and compare air quality indices among different areas in a hospital.
2. Materials and methods
2.1. Study design
We prospectively measured air quality indices using conventional, portable, and passive air quality sensors in an otorhinolaryngology clinic. Our primary target pollutants were carbon dioxide (CO2), VOCs, particulate matter with diameter of <2.5 μm (PM2.5), and nitrogen dioxide (NO2). The target air pollutants were measured at 1-minute intervals from Monday to Friday for 12 months between February 1, 2019 and January 31, 2020. We did not measure air quality indices on off-duty days such as holidays. Since the usage of cooling and heating systems was a major confounder in this study, we did not permit the usage of any personal air-coolers, -heaters, -cleaners, or additional ventilation such as opening windows during the study time. This study adhered to the tenets of the Declaration of Helsinki of 1975 revised in 2013 and was approved by the Institutional Review Board of Hallym Medical University Chuncheon Sacred Hospital (IRB No. 2019-001).
We attempted to determine the differences in indoor air quality between different areas of Hallym Medical University Chuncheon Sacred Hospital. Thus, for the comparison of indoor air quality in different areas of the hospital, we measured air quality indices in the otorhinolaryngology clinic, orthopedic clinic, and reception area of the hospital. All these areas were located on the same floor of the hospital. Generally, various types of procedures, including mass biopsy, electrocauterization during epistaxis, incision and drainage of abscess cavities, and debridement of necrotic or granular tissue are performed in the otorhinolaryngology clinic; whereas in the orthopedic clinic, the medical practitioner usually performs only manual procedures such as history taking, counseling, and physical examination without any instruments or devices. Thus, we assumed that the otorhinolaryngology clinic, orthopedic clinic, and reception desk were representative of high risk of indoor air pollution, low risk of indoor air pollution, and control area, respectively. Moreover, to investigate the effect of intervention, we measured air quality indices in other otorhinolaryngology clinics that used air-cleaners during the study period. However, as this study did not include human subjects, we could not investigate the degree of exposure to air pollutants of the healthcare personnel in the otorhinolaryngology clinic.
2.2. Statistical analysis
The air quality sensors measured air quality indices at 1-minute intervals; however, we used the average values during the course of 1 hour for statistical analysis. Continuous variables were expressed as median with range, because they were not normally distributed. The Mann–Whitney test was used to compare 2 continuous variables. The Kruskal–Wallis test was used to evaluate the 3 continuous variables. Post-hoc analysis was also performed with the Mann–Whitney and Kruskal–Wallis tests. A P value <.05 (2-tailed) was adopted as the threshold for statistical significance for all tests. All analyses were performed using R version 3.4.2 software and GraphPad Prism software 7.0 (GraphPad software Inc, La Jolla, CA).
3. Results
3.1. Indoor air quality variations according to area of analysis
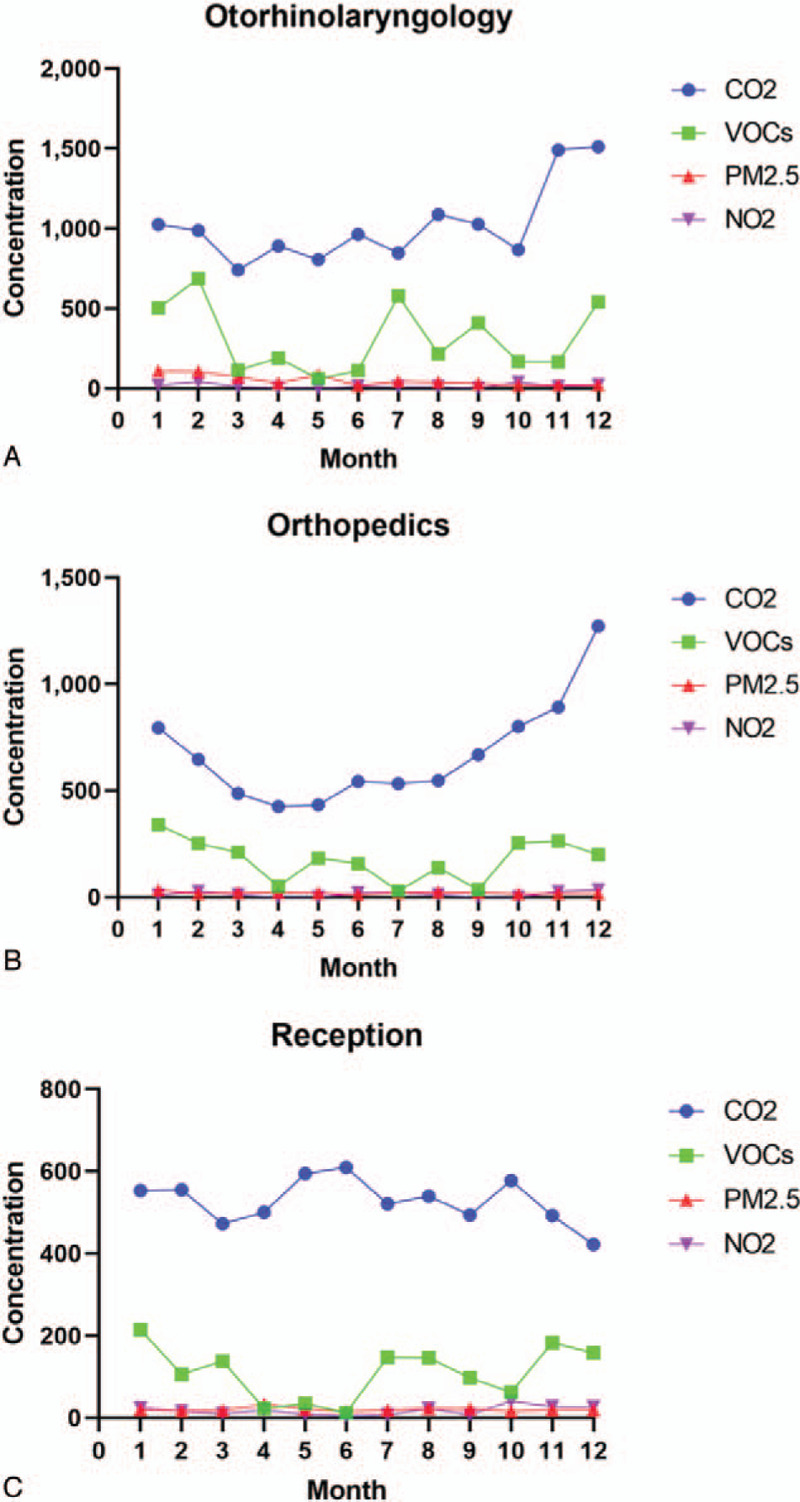
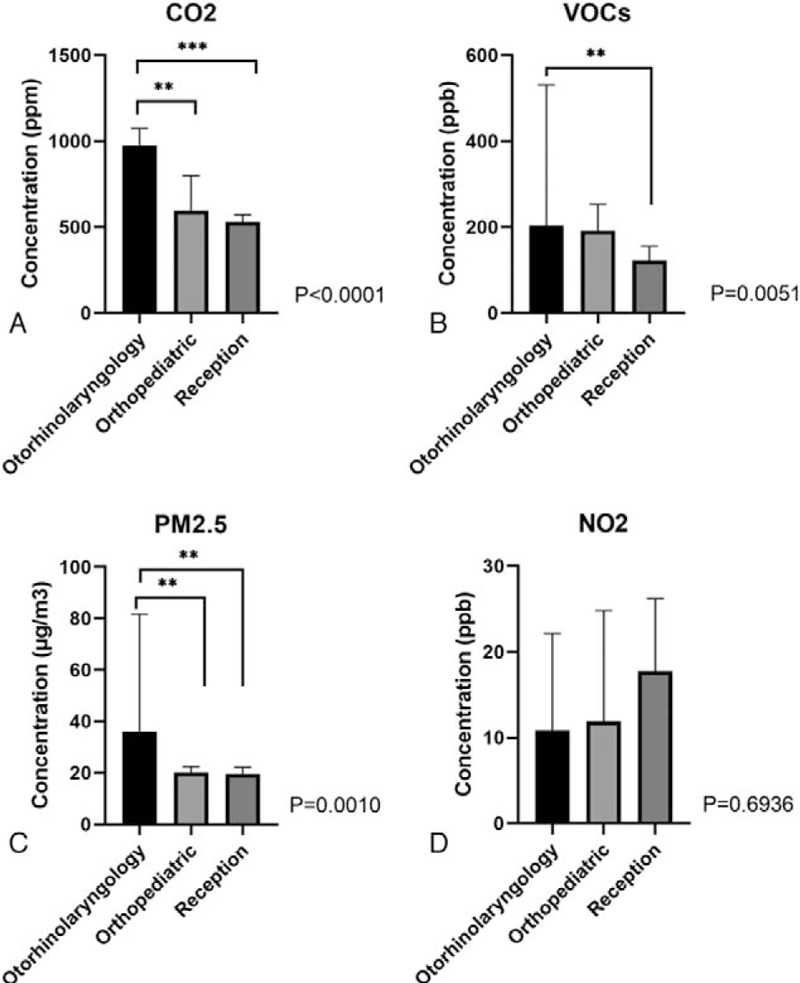
The results of indoor air quality measurements in each area are summarized in Figure 1. In the otorhinolaryngology clinic, the average annual concentration of CO2 was 1020 ppm, and the average monthly concentration was always more than 800 ppm. Meanwhile, the average annual concentration of CO2 was 670 ppm in the orthopedic clinic and 528 ppm in the reception area (Fig. 2A). The average annual concentration of VOCs in the otorhinolaryngology clinic (312 ppb) was significantly higher than that in the reception area (110 ppb) (Figure 2B). Additionally, the average annual concentration of PM2.5 in the otorhinolaryngology clinic (49.6 μg/m3) was significantly higher than those in the orthopedic clinic (20.0 μg/m3) or reception area (20.5 μg/m3) (Fig. 2C). However, there were no significant differences in the average annual concentrations of NO2 among the analyzed areas (Fig. 2D). We presented the detailed reference range of indoor air quality indices on Table 1.
Figure 1.

The measurements of indoor air quality in various areas of an outpatient clinic: (A) otorhinolaryngology clinic, (B) orthopedic clinic, (C) reception. The following air quality indices were measured: carbon dioxide (CO2), total volatile organic compounds (VOCs), particulate matter with diameter of <2.5 μm (PM2.5), and nitrogen dioxide (NO2).
Figure 2.

Comparison of air quality indices among different areas in the hospital: (A) carbon dioxide (CO2), (B) total volatile organic compounds (VOCs), (C) particulate matter with diameter of <2.5 μm (PM2.5), and (D) nitrogen dioxide (NO2).
Table 1.
The detailed reference range of indoor air quality indices of this study.
| Air quality indices | Acceptable range | Tolerable range | Poor quality range |
| Carbon dioxide | 400–800 ppm | 800–1500 ppm | >1500 ppm |
| Volatile organic compounds | 0–400 ppb | 400–800 ppb | >800 ppb |
| Particulate matter | <50 mg/m3 | 50–100 mg/m3 | >100 mg/m3 |
| Nitrogen dioxide | <100 ppb | 100–250 ppb | >250 ppb |
3.2. Indoor air quality variations with seasons
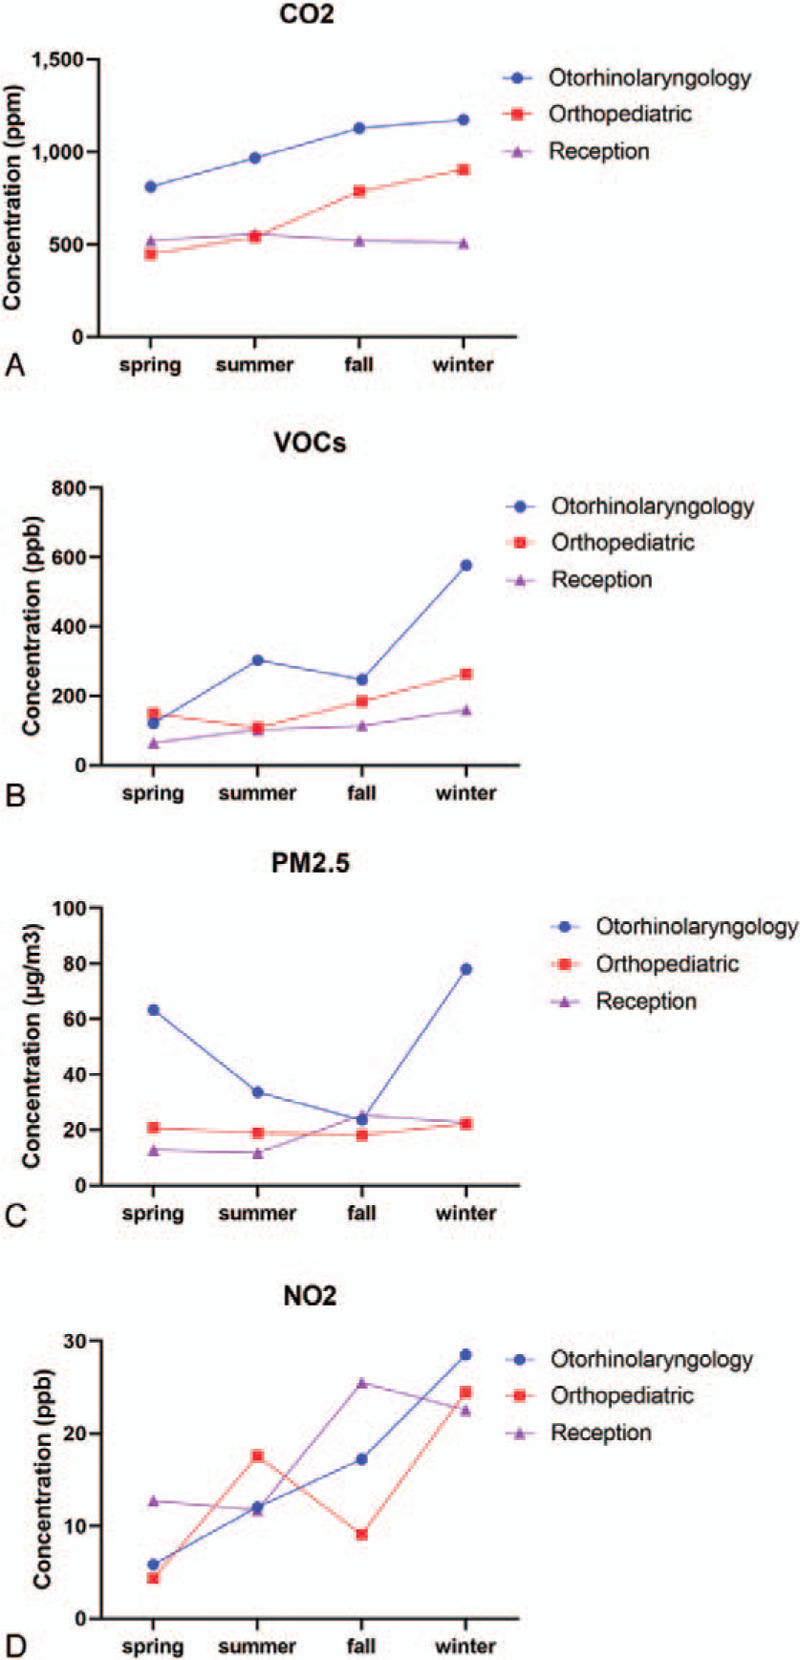
To evaluate the seasonal effects, we classified months into spring (from March to May), summer (from July to August), fall (from September to November), and winter (from November to January). In the otorhinolaryngology and orthopedic clinics, the CO2 concentration increased from spring to winter; however, the CO2 concentration in the reception area was similar throughout the year (Fig. 3A). Moreover, we observed that the VOC concentration in the winter was higher than that in other seasons, regardless of the area of analysis (Fig. 3B). With regard to PM2.5 concentrations, levels in the otorhinolaryngology clinic in spring, summer, and winter were higher than those in the orthopedic clinic or reception area; whereas, no differences in PM2.5 concentrations were detected between the analyzed areas in the fall season (Fig. 3C). The NO2 concentration varied with the seasons and was different in different areas of the hospital (Fig. 3D). In the otorhinolaryngology clinic, the NO2 concentration increased from spring to winter. In the orthopedic clinic, summer and winter showed higher NO2 concentrations than spring and fall, whereas the NO2 concentration of the reception desk was higher in fall and winter than those in spring and summer.
Figure 3.

Seasonal effects on indoor air quality among different areas in the hospital: (A) carbon dioxide (CO2), (B) total volatile organic compounds (VOCs), (C) particulate matter with diameter of <2.5 μm (PM2.5), and (D) nitrogen dioxide (NO2).
3.3. Control of indoor air pollution using an air-cleaner
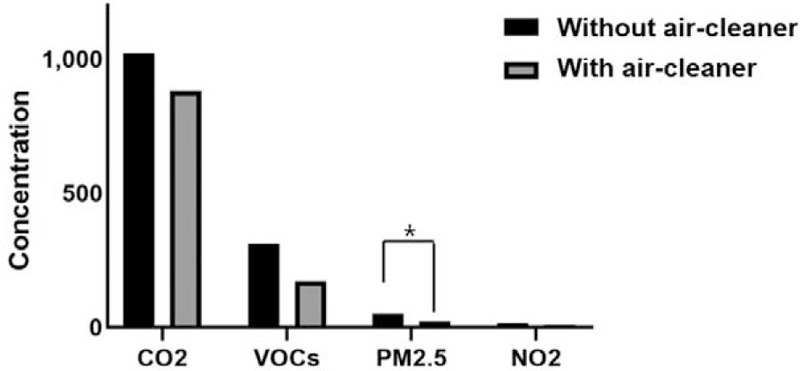
To investigate the intervention effect, we compared the indoor air quality between otorhinolaryngology clinics that did and did not employ air-cleaners. There was no difference in the mean number of daily patient visits and number of otorhinolaryngologic procedures per month between otorhinolaryngology clinics employing air-cleaners and those not employing air-cleaners. The overall effects of air-cleaners in otorhinolaryngology clinics are presented in Figure 4. We found that the concentration of PM2.5 (P = .015) was significantly decreased when an otorhinolaryngology clinic used an air-cleaner; however, there were no significant differences in the concentrations of CO2, VOCs, or NO2 between the 2 groups (P = .1432, P = .0597, and P = .0679, respectively).
Figure 4.

The intervention effect on air-quality indices between otorhinolaryngology clinics with air-cleaner and without air-cleaner. The following air quality indices were measured: carbon dioxide (CO2), total volatile organic compounds (VOCs), particulate matter with diameter of <2.5 μm (PM2.5), and nitrogen dioxide (NO2).
4. Discussion
Indoor air quality is receiving increased attention from the international scientific community, political institutions, and environmental governances as an important factor in improving the health and quality of life of people. People spend approximately 90% of their time in either private or public indoor environments.[14] Specifically, the indoor air quality of hospitals is an important factor affecting the health of staff and patients. Indoor air quality is affected by various activities and procedures performed in hospitals including the use of chemicals, pharmaceutical products, biological contaminants, cleaning compounds, sterilization, and dust. Previously, 1 study described that the exceeding acceptable level of VOCs and PM2.5 concentrations were associated with the number of endoscopic procedures and PM2.5 in the gastrointestinal endoscopic unit.[15] Therefore, as an integral part of hospitals with exposure to several indoor pollutants, this study aimed to evaluate the indoor air quality of an otorhinolaryngology clinic. We observed that the otorhinolaryngology clinic had significantly higher concentrations of CO2, VOCs, and PM2.5 than the orthopedic clinic or reception area. The distinct seasonal differences in ambient air quality indices were also detected. An air-cleaner (the intervention) only had a significant effect on PM2.5 concentrations and not on CO2, VOCs, or NO2 concentrations.
The major indoor air pollutants are CO2, NO2, VOCs, sulfur dioxide, ozone, PM, radon, toxic metals, and microorganisms. Among these, CO2 is a well-known constituent of the earth's atmosphere and a major human metabolite. The average CO2 concentration in ambient air is approximately 400 ppm.[3,16,17] According to the ASHRAE standard, it is recommended that indoor CO2 concentration should be less than 700 ppm to prevent any harm to human health.[18] It is established that exposure to a CO2 concentration of 3000 ppm increases the frequency of high-intensity headaches, sleepiness, fatigue, and concentration difficulties.[19] In this study, the mean concentration of CO2 in the otorhinolaryngology clinic was more than 800 ppm every month, and it was higher than the concentration in other outpatient areas. It means that healthcare personnel working in the otorhinolaryngology clinic may be at higher risk of health consequences due to high CO2 concentration.
VOCs are recognized as gases containing a variety of chemicals, and formaldehyde is one of the most widespread VOCs.[4] Generally, indoor VOCs are generated from 4 primary sources: first, human activities such as smoking, cooking, cleaning, and the use of personal care products; second, indoor chemical reactions; third, penetration of outdoor air through infiltration and ventilation systems; fourth, from building materials.[4,20] Long-term exposure to some VOCs is considered harmful to human health, with a potential to cause cancer.[21] In this study, the mean concentrations of VOCs in the otorhinolaryngology clinic were higher than those in the other analyzed areas. Additionally, the concentrations of VOCs increased in winter in all analyzed areas. High VOC levels in the otolaryngology clinic may be related to frequent disinfection and cleansing of endoscopic equipment using various chemical detergents and disinfectants.
PM is a complex mixture of extremely small particles and liquid droplets.[22] On the basis of particle size, PM is categorized into PM2.5 and PM10, which refer to particle sizes below 2.5 and 10 μm, respectively. PM2.5 is particularly harmful, since it can penetrate human bronchi and lungs due to its small particle size. It is sometimes inhalable, affecting the lungs and heart and showing serious health effects.[23–25] The source of indoor PM is known to be migration from the outdoor environment as well as certain indoor activities.[6] In this study, we found that the otorhinolaryngology clinic showed significantly higher PM2.5 concentrations than the other analyzed areas, specifically in spring and winter. We speculate that procedures and physical examinations using endoscopy or oronasal sprays may have contributed to the higher PM2.5 concentrations in the otorhinolaryngology clinic. Furthermore, the seasonal differences may be explained by higher outdoor PM concentrations and increased number of patients visiting the clinic in the spring and winter seasons. Consistent with previous studies,[26,27] the use of filtration/ventilation devices effectively reduced PM concentration in the otorhinolaryngology clinic.
The 2 principal nitrogen oxides are nitric oxide (NO) and NO2, and both are associated with combustion sources such as cooking stoves and heaters.[28] Under ambient conditions, NO is rapidly oxidized to form NO2; hence, NO2 is usually considered as a primary pollutant.[29] NO2 exposure is also associated with decreased pulmonary function and may cause bronchitis or bronchopneumonia.[30] In this study, there were no significant differences in NO2 concentrations among the different hospital areas. However, the overall NO2 concentration was higher in winter than that in summer. The continued usage of heating systems in winter can explain this finding.
This study has some limitations. First, it does not provide information regarding individual exposure to air pollutants and its effects on general health. Thus, this study could not provide direct evidence of the relationship between indoor air quality and health of medical practitioners or patients in the otorhinolaryngology clinic. Second, this study is a relatively small-sample study. External validation in the form of multicenter studies is required to confirm these outcomes. However, the strength of this study is that it provides further evidence of the need for improving the indoor air quality in otorhinolaryngology clinics to protect the health of medical practitioners and patients.
5. Conclusion
This study monitored the indoor air quality in an otorhinolaryngology clinic and compared the ambient air quality indices among different areas in a hospital. We found that the otorhinolaryngology clinic had significantly higher concentrations of CO2, VOCs, and PM2.5 than the orthopedic clinic or reception area. The distinct seasonal differences in ambient air quality indices were also detected. In the otorhinolaryngology clinic, only PM2.5 concentrations were significantly decreased by intervention, whereas CO2, VOC, and NO2 concentrations were not affected. These findings indicate that otorhinolaryngology clinics are at risk of indoor air pollution and that this could affect the health of clinicians and patients. Therefore, otorhinolaryngology clinicians should be aware of the potentially harmful health effects associated with indoor air pollution and should consider indoor air quality as a part of their practice guidelines. Adequate special precautions to counter the effects of poor indoor air quality should be undertaken.
Author contributions
Conceptualization: Hyun-Joo Lee, Dong-Kyu Kim.
Data curation: Hyun-Joo Lee, Dong-Kyu Kim.
Methodology: Hyun-Joo Lee, Kang Hyun Lee.
Validation: Hyun-Joo Lee.
Visualization: Hyun-Joo Lee.
Project administration: Kang Hyun Lee, Dong-Kyu Kim.
Resources: Kang Hyun Lee.
Software: Kang Hyun Lee.
Formal analysis: Dong-Kyu Kim.
Funding acquisition: Dong-Kyu Kim.
Supervision: Dong-Kyu Kim.
Writing – original draft: Dong-Kyu Kim.
Writing – review & editing: Dong-Kyu Kim.
Footnotes
Abbreviations: CO2 = carbon dioxide, NO2 = nitrogen dioxide, PM2.5 = particulate matter with diameter of <2.5 μm, VOCs = volatile organic compounds.
How to cite this article: Lee HJ, Lee KH, Kim DK. Evaluation and comparison of the indoor air quality in different areas of the hospital. Medicine. 2020;99:52(e23942).
This research was supported by the Hallym University Research Fund.
The authors of this work have nothing to disclose.
All data generated or analyzed during this study are included in this published article [and its supplementary information files]
References
- [1].Cincinelli A, Martellini T. Indoor air quality and health. Int J Environ Res Public Health 2017;14:1286. [DOI] [PMC free article] [PubMed] [Google Scholar]
- [2].Tran VV, Park D, Lee YC. Indoor air pollution, related human diseases, and recent trends in the control and improvement of indoor air quality. Int J Environ Res Public Health 2020;17:2927. [DOI] [PMC free article] [PubMed] [Google Scholar]
- [3].Persily A, de Jonge L. Carbon dioxide generation rates for building occupants. Indoor Air 2017;27:868–79. [DOI] [PMC free article] [PubMed] [Google Scholar]
- [4].Lee K, Choi JH, Lee S, et al. Indoor levels of volatile organic compounds and formaldehyde from emission sources at elderly care centers in Korea. PloS One 2018;13:e0197495. [DOI] [PMC free article] [PubMed] [Google Scholar]
- [5].Kumar P, Imam B. Footprints of air pollution and changing environment on the sustainability of built infrastructure. Sci Total Environ 2013;444:85–101. [DOI] [PubMed] [Google Scholar]
- [6].Ferro AR, Kopperud RJ, Hildemann LM. Elevated personal exposure to particulate matter from human activities in a residence. J Expo Anal Environ Epidemiol 2004;14:S34–40. [DOI] [PubMed] [Google Scholar]
- [7].Lee SY, Chang YS, Cho SH. Allergic diseases and air pollution. Asia Pac Allergy 2013;3:145–54. [DOI] [PMC free article] [PubMed] [Google Scholar]
- [8].Uzoigwe JC, Prum T, Bresnahan E, et al. The emerging role of outdoor and indoor air pollution in cardiovascular disease. N Am J Med Sci 2013;5:445–53. [DOI] [PMC free article] [PubMed] [Google Scholar]
- [9].Mu L, Liu L, Niu R, et al. Indoor air pollution and risk of lung cancer among Chinese female non-smokers. Cancer Causes Control 2013;24:439–50. [DOI] [PMC free article] [PubMed] [Google Scholar]
- [10].Yoon HI, Hong YC, Cho SH, et al. Exposure to volatile organic compounds and loss of pulmonary function in the elderly. Eur Respir J 2010;36:1270–6. [DOI] [PubMed] [Google Scholar]
- [11].Cabo Verde S, Almeida SM, Matos J, et al. Microbiological assessment of indoor air quality at different hospital sites. Res Microbiol 2015;166:557–63. [DOI] [PubMed] [Google Scholar]
- [12].Gniadek A, Macura AB, Górkiewicz M. Cytotoxicity of Aspergillus fungi isolated from hospital environment. Pol J Microbiol 2011;60:59–63. [PubMed] [Google Scholar]
- [13].Groves-Kirkby CJ, Denman AR, Campbell J, et al. Is environmental radon gas associated with the incidence of neurodegenerative conditions?. A retrospective study of multiple sclerosis in radon affected areas in England and Wales. J Environ Radioact 2016;154:1–4. [DOI] [PubMed] [Google Scholar]
- [14].Leech JA, Nelson WC, Burnett RT, et al. It's about time: a comparison of Canadian and American time-activity patterns. J Expo Anal Environ Epidemiol 2002;12:427–32. [DOI] [PubMed] [Google Scholar]
- [15].Bang CS, Lee K, Yang YJ, et al. Ambient air pollution in gastrointestinal endoscopy unit. Surg Endosc 2020;34:3795–804. [DOI] [PubMed] [Google Scholar]
- [16].Zhang X, Wargocki P, Lian Z, et al. Effects of exposure to carbon dioxide and bioeffluents on perceived air quality, self-assessed acute health symptoms, and cognitive performance. Indoor Air 2017;27:47–64. [DOI] [PubMed] [Google Scholar]
- [17].Persily A. A new approach to estimating carbon dioxide generation rates from building occupants. ASHRAE J 2017;59:64–6. [PMC free article] [PubMed] [Google Scholar]
- [18].Burton DJ. ASHRAE 62-1999 ventilation for acceptable indoor air quality, addendum n. Occup Health Saf 2000;69:32–4. [PubMed] [Google Scholar]
- [19].Azuma K, Kagi N, Yanagi U, et al. Effects of low-level inhalation exposure to carbon dioxide in indoor environments: A short review on human health and psychomotor performance. Environ Int 2018;121:51–6. [DOI] [PubMed] [Google Scholar]
- [20].Huang Y, Ho SS, Ho KF, et al. Characteristics and health impacts of VOCs and carbonyls associated with residential cooking activities in Hong Kong. J Hazard Mater 2011;186:344–51. [DOI] [PubMed] [Google Scholar]
- [21].Tsai WT. An overview of health hazards of volatile organic compounds regulated as indoor air pollutants. Rev Environ Health 2019;34:81–9. [DOI] [PubMed] [Google Scholar]
- [22].Shang J, Khuzestani RB, Tian J, et al. Chemical characterization and source apportionment of PM2.5 personal exposure of two cohorts living in urban and suburban Beijing. Environ Pollut 2019;246:225–36. [DOI] [PubMed] [Google Scholar]
- [23].Hamanaka RB, Mutlu GM. Particulate matter air pollution: effects on the cardiovascular system. Front Endocrinol (Lausanne) 2018;9:680. [DOI] [PMC free article] [PubMed] [Google Scholar]
- [24].Brook RD, Rajagopalan S, Pope CA, 3rd, et al. Particulate matter air pollution and cardiovascular disease: an update to the scientific statement from the American Heart Association. Circulation 2010;121:2331–78. [DOI] [PubMed] [Google Scholar]
- [25].Zielinski M, Gasior M, Jastrzebski D, et al. Influence of particulate matter air pollution on exacerbation of chronic obstructive pulmonary disease depending on aerodynamic diameter and the time of exposure in the selected population with coexistent cardiovascular diseases. Adv Respir Med 2018;86:227–33. [DOI] [PubMed] [Google Scholar]
- [26].Liu C, Hsu PC, Lee HW, et al. Transparent air filter for high-efficiency PM2.5 capture. Nat Commun 2015;6:6205. [DOI] [PubMed] [Google Scholar]
- [27].Wen Y, Leng J, Shen X, et al. Environmental and health effects of ventilation in subway stations: a literature review. Int J Environ Res Public Health 2020;17:1084. [DOI] [PMC free article] [PubMed] [Google Scholar]
- [28].Bernstein JA, Alexis N, Bacchus H, et al. The health effects of non-industrial indoor air pollution. J Allergy Clin Immunol 2008;121:585–91. [DOI] [PubMed] [Google Scholar]
- [29].Harrison PT. Indoor air quality guidelines. Occup Environ Med 2002;59:73–4. [DOI] [PMC free article] [PubMed] [Google Scholar]
- [30].Saud B, Paudel G. The threat of ambient air pollution in Kathmandu. Nepal J Environ Public Health 2018;2018:1504591. [DOI] [PMC free article] [PubMed] [Google Scholar]


