In the above article [Sager JE, Tripathy S, Price LSL, Nath A, Chang J, Stephenson-Famy A, and Isoherranen N (2017) Biochem Pharmacol 123: 85–96], a review of the raw data found discrepancies between that data and the mRNA and western blot data provided by the second author for Figure 4 and Figure 5 in the published manuscript. The corrected figures and data description are presented in the below corrigendum. No errors or data discrepancies were found in any other figures or tables in the manuscript or in any of the CYP2D6 activity or inhibition data. The authors sincerely apologize for these errors.
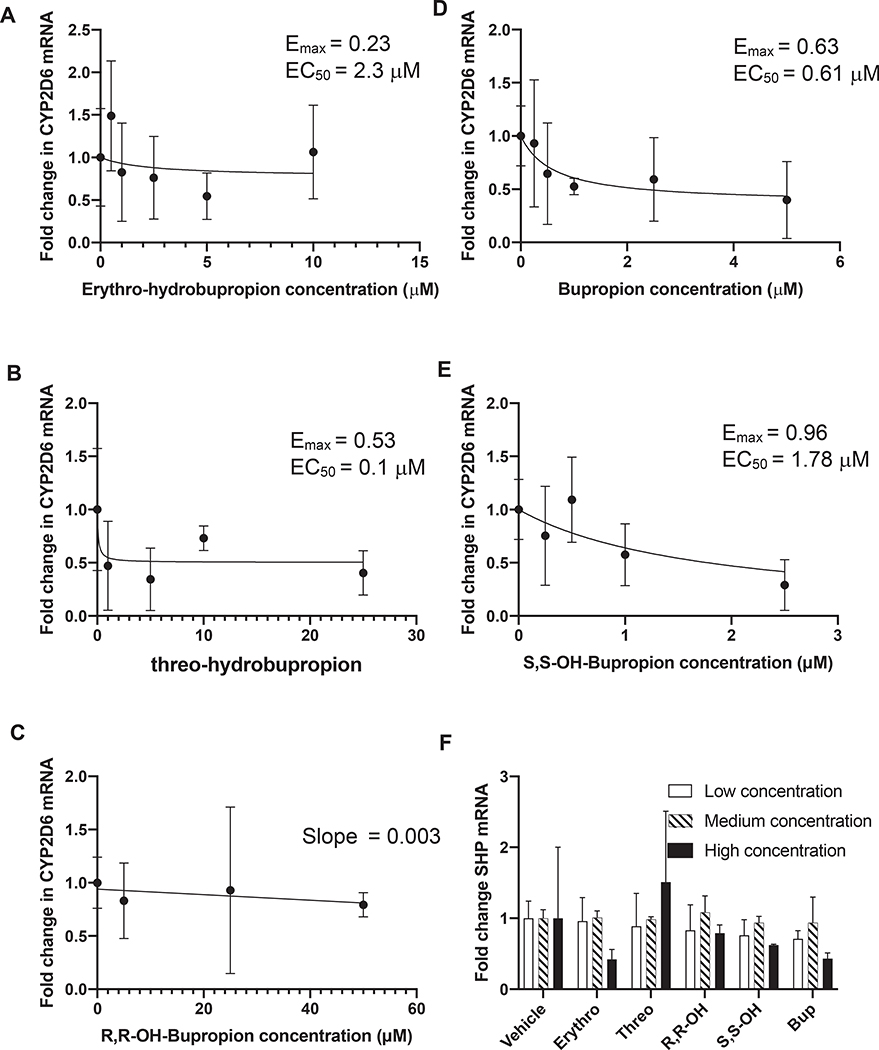
Figure 4. Effects of bupropion and its metabolites on CYP2D6 and SHP mRNA in HepG2 cells.
CYP2D6 mRNA levels in HepG2 cells exposed to multiple concentrations of (A) erythrohydrobupropion, (B) threohydrobupropion, (C) R,R-OH-bupropion, (D) bupropion and (E) S, S-OH-bupropion are shown. The points show the measured effect with its standard deviation and the line shows the fit of equation 2, to the data. For R,R-OH-bupropion solubility limitations prevent measurement of dose–response relationship and hence the line shows the fit of equation 3, E = Eo – slope × [I] to the data. Panel F shows the fold change in SHP mRNA levels in HepG2 cells following 72 h of treatment with bupropion (bup 0.5 μM, 2.5 μM, 5 μM), R,R-OH-bupropion (R,R-OH, 5 μM, 25 μM, 50 μM), S,S-OH-bupropion (S,S-OH 0.5 μM, 2.5 μM, 5 μM), erythrohydrobupropion (erythro 0.5 μM, 2.5 μM, 5 μM) or threohydrobupropion (threo 2 μM, 10 μM, 20 μM). The data are shown as mean of three replicates and the standard deviation is shown as the error bar.
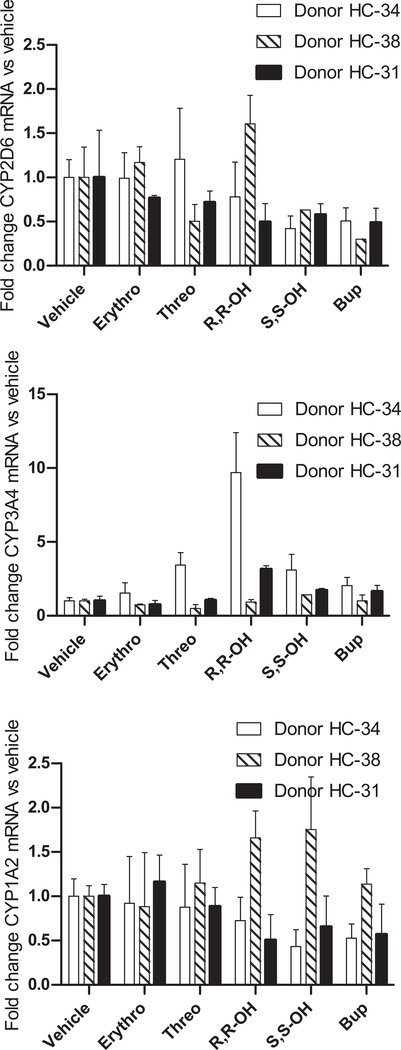
Figure 5. CYP2D6 specific downregulation of mRNA expression by bupropion and its metabolites in plated human hepatocytes.
Fold change in (a) CYP2D6, (b) CYP3A4 and (c) CYP1A2 mRNA expression in comparison to vehicle treated controls following 72 h treatment of plated human hepatocytes from three donors with erythrohyrobupropion (Erythro), threohydrobupropion (Threo), R,R-OH-bupropion (R,R-OH) or S,S-OH-bupropion (S,S-OH) bupropion (Bup), and mixture of all compounds at concentrations approximately 5 times steady state concentrations as described in methods section. All experiments were conducted in triplicate and the standard deviation is shown as the error bar.
The text in Section 3.3 should read: To test whether bupropion and its metabolites alter CYP2D6 mRNA expression, HepG2 cells were treated with bupropion and its metabolites at 3–5 different concentrations. Bupropion and S,S-OH-bupropion decreased CYP2D6 mRNA expression in HepG2 cells in dose-dependent manner. The down-regulation of CYP2D6 by bupropion and S,S-OH-bupropion followed a classic dose–response relationship (Figure 4) while the down-regulation by threohydrobupropion and erythrohydrobupropion was erratic and R, R-OH-bupropion did not result in any CYP2D6 downregulation. Based on the EC50 values, bupropion (EC50 0.6 μM) and S,S-OH-bupropion (EC50 1.78 μM) were the most potent compounds in downregulating CYP2D6 resulting in a maximum 63–96% decrease in CYP2D6 mRNA (Fig. 4). Erythro-hydrobupropion and threohydrobupropion reached up to 53% downregulation of CYP2D6 but the dose–response was less well defined. To test whether the down-regulation of CYP2D6 by bupropion is due to similar mechanisms as has been described with all-trans-retinoic acid [34], the possible induction of the small heterodimer partner (SHP) was evaluated with each precipitant. Bupropion and its metabolites did not induce SHP mRNA at any of the concentrations tested (Fig. 4).
In section 3.4 should read: bupropion was predicted to result in 13% decrease in CYP2D6 mRNA, erythro-hydrobupropion in 2% decrease, threo-hydrobupropion in 50% decrease, and S,S-OH-bupropion in 10% decrease in CYP2D6 mRNA if any of these compounds acted alone at steady state resulting in an overall 51% decrease in CYP2D6 expression at steady state. The predicted % decrease in CYP2D6 activity following bupropion dosing at 300 mg/day to steady state is 72%.
In section 3.5 the text relating to hepatocyte treatments should read: In the treated cells, the mean CYP2D6 mRNA levels were 54% (S,S-OH-bupropion), 43% (Bupropion), 97% (erythro-hydrobupropion), 81% (threo-hydrobupropion) and 96% (R,R-OH-bupropion), of the mRNA levels in vehicle treated cells (Fig. 5, Table 2). In comparison, bupropion and its metabolites appeared to increase CYP3A4 mRNA with CYP3A4 mRNA being between one and 4.6-fold higher on average in treated cells (Fig. 5). No consistent changes in CYP1A2 mRNA were observed following any of the treatments (Fig. 5).
In Table 2, % decrease in CYP2D6 mRNA at 72 h should read: Bupropion 57%, R,R-OH-bupropion 4%, S,S-OH-bupropion 46%, threo-hydrobupropion 19%, erythrohydrobupropion 3%. Predicted % decrease in CYP2D6 activity at 72 ha should read: Bupropion 73%, R,R-OH-bupropion 64%, S,S-OH-bupropion 58%, threo-hydrobupropion 84%, erythrohydrobupropion 82%.


