

Abstract
Plexins receive guidance cues from semaphorin ligands and transmit their signal through the plasma membrane. This family of proteins is unique amongst single-pass transmembrane receptors as their intracellular regions interact directly with several small GTPases, which regulate cytoskeletal dynamics and cell adhesion. Here, we characterize the GTPase Activating Protein (GAP) function of Plexin-B1 and find that a cooperative GAP activity towards the substrate GTPase, Rap1b, is associated with the N-terminal Juxtamembrane region of Plexin-B1. Importantly, we unveil an activation mechanism of Plexin-B1 by identifying a novel functional loop which partially blocks Rap1b entry into the plexin GAP domain. Consistent with the concept of allokairy developed for other systems, Plexin-B activity is increased by an apparent substrate-mediated cooperative effect. Simulations and mutagenesis suggest the repositioned JM conformation is stabilized by the new activation switch loop when the active site is occupied, giving rise to faster enzymatic turnover and cooperative behavior. The biological implications, essentially those of a threshold behavior for cell migration, are discussed.
Electronic supplementary material
The online version of this article (10.1007/s00018-020-03571-2) contains supplementary material, which is available to authorized users.
Keywords: Allostery, Cell signaling, Cell migration, Small GTPases, Molecular mechanism, Activation threshold
Introduction
Plexins are transmembrane receptors with four subfamilies (Plexin-A1-A4 , -B1-B3, -C1, -D1) in vertebrates, each binding to one or more members of the Semaphorin family of signaling ligands [1]. Semaphorin–plexin signaling controls cell migration, usually repulsion in neuronal and cardiovascular development [2, 3]. Genetic knockout of certain Semaphorins and Plexins can lead to severe neurological development defects, pathogenic angiogenesis, and cancer metastasis [3, 4]. Plexin function involves interactions with multiple binding partners, such as small GTPases, the co-receptor Neuropilin (which appears obligatory, however only for the Plexin-A family), and diverse receptors or soluble kinases as well as posttranslational modifications and binding to adaptor proteins [3, 5]. A unique feature of Plexins, as transmembrane receptors, is their ability to directly interact with Ras- and Rho-family small GTPases via their Intra-Cellular Region, ICR, residues 1511–2135 [3, 6]. The ICR follows the transmembrane region of residues 1487–1510. The ICR consists of an N-terminal intracellular segment, called the Juxtamembrane (JM, 1511–1545) region, GTPase Activating Protein (GAP, 1567–1719, 1916–2135) domain which is split into an N- and C-terminal segments by insertion of a Rho-GTPase Binding Domain (RBD, 1748–1887) [7] (Fig. 1a). The Plexin GAP domain was shown to stimulate the hydrolysis of GTP to GDP in the Ras GTPase family member, Rap1b [8]. Rap1b, thus deactivated by Plexins, appears to attenuate integrin-mediated cell attachment, which in turn can lead to cell collapse. This is also accomplished via a second function, the binding and activation of a GEF (Guanine nucleotide Exchange Factor) protein for RhoA at a site distinct from the GAP active site and the RBD [9]. The structure of the Intra-Cellular Regions, ICRs, of different Plexin family members has been solved mostly by X-ray crystallography [10, 11] and previously unveiled subtly different conformational states of the JM and of a loop which, in the unbound protein protrudes into the Rap1b-binding site of the GAP domain (termed activation segment) [12]. A dimerization or trimerization of the Plexin ICR (if not of the entire Plexin receptor) is thought to synergize with conformational changes in the JM and activation segment; thereby, stimulating its GAP activity [8, 12, 13]. The ICR of Plexin-A family members can be considerably activated by dimerization in vitro using a coiled-coil or another N-terminal ICR dimerization tag, but likely need additional interactions, perhaps by contacting Neuropilin for full activity. For Plexin-B family members and -D1, while likely present, no enhanced GAP activity was reported for induced dimers, but we noted that for Plexin-B1 and -C1, the activity of the wild-type ICR is already above what is seen in the induced Plexin-A1 dimers [8]. A more dramatic increase in the activity is shown in a similarly induced dimerization of zebrafish Plexin-C1 [12], reaching the level of other GAP enzymes. At the outset of this study, we postulate that activation may also involve other, not yet characterized segments of the ICR, particularly for the Plexin-B family.
Fig. 1.

Plexin-B1 activity and evidence of a concentration dependent conformational change via the juxtamembrane region. a Domain and main-chain cartoon of the tertiary structure of the Plexin-B1 intracellular region (PDB ID, 3SU813, with missing loops modeled, see M&M). b GAP activity of Plexin-B1 (300 nM) with Rap1b as a function of GTPase substrate concentration (0–3.5 µM). Enzyme activity and kinetic constants KM, Vmax and kcat were calculated using the Michaelis–Menten equation. The cooperativity, n, was calculated using the Hill equation (see M&M). c Conformational change assay using Microscale Thermophoresis (MST). The Juxtamembrane domain plays an important role in a Plexin-B1 transition as the triple mutant L1529M/L1532A/V1536A does not show a similar transition. d Model of Plexin-B1 dimeric structure, highlighting key JM residues predicted to be part of a coiled-coil. e Representative zoom of a slide showing cells in a collapse assay. Cos7 cells were transfected with Plexin-B1 wt (left column) or Plexin-B1 triple mutant L1529M/L1532A/V1536A (right column) and either not treated (top, control) or treated with Sema4D (bottom). Scale bar (white) is 10 µm. f Histogram and significance of a cell count (see Methods). The triple mutation in the JM domain is seen to abolish cell collapse
Results and discussion
Plexin-B1′s modest GAP function has a cooperative increase in the activity at higher substrate concentration
For this project we adopted a fluorescence based in vitro assay for the detection of Plexin stimulation of GTP hydrolysis in Rap1b at near physiological protein concentrations, suggested to be around 1 µM or less (Fig. S1) whereas the initial assays of the Zhang laboratory used Plexin concentrations of 10 µM [8]. Using such lower Plexin concentrations, we newly observed a significant activity of Plexin-B1 toward Rap1b, itself depending upon the Rap1b GTPase substrate concentration. The kinetic constants KM (Michaelis constant) and Vmax (maximal rate) were fitted for the Plexin-B1 ICR activity as a function of substrate concentration, in the presence of up to 2 µM Rap1b at 300 nM Plexin-B1 (= Eo) to be 1.4 ± 0.1 µM and 78.1 ± 3.5 nM/min, respectively, giving a value for kcat (turnover number = Vmax/Eo) of 0.26 min−1 (Fig. 1b, Fig. S1, M&M Eq. 1). This turnover number of Plexin-B1 compares with the activity of 0.23 min−1 reported for a coiled-coil enforced dimer of Plexin-A1 [8]. These GAP activities of Plexin in solution are relatively modest, e.g., Gap1m is 15-fold faster and p120RasGAP even 150 fold faster towards H-Ras (however, the latter with a 100 fold weaker KM, as compared to Plexin-B1) [14]. The sigmoid or S-shaped behavior of the Plexin-B1 GAP reaction rate as a function of the substrate concentration of Rap1b and, with a Hill coefficient of 5.4 ± 0.9 (Fig. 1b, M&M Eq. 2), indicates an enzyme cooperative mechanism within the Plexin-B1 ICR. To our knowledge, this is the first time a cooperative mechanism has been described for a GTPase Activating Protein in the literature and the biological implications are discussed below.
Both the Juxtamembrane segment and a newly discovered loop are responsible for cooperativity
Experiments using Microscale Thermophoresis (MST) as a function of Plexin concentration show a transition with a mid-point at 1.15 ± 0.28 µM for the Plexin-B1 ICR (Fig. 1c, S2). However, in agreement with others [13, 15], even at µM concentration, we failed to observe dimer or trimer formation of the Plexin-B1 ICR by gel filtration and analytical ultracentrifugation, suggesting that a dimer/trimer, if it exists, may be very weak/kinetically labile. At the same time, computer simulations [16] and a DN-Ara assay in E. coli (Fig. S3) indicate that the Transmembrane (TM) helix of Plexin-B1 has a tendency to form a homo-dimer/trimer by itself. The dimerization/trimerization of the TM helices likely further enhances the association of intracellular region for full-length Plexin-B1, considering that the TM helix is immediately followed by a JM helix, which has an intrinsic tendency to form a coiled-coil dimer or trimer [12, 13, 16]. As a further test, we used cross-linking reagents and could show that Plexin-B1 is more readily cross-linked than the JM triple mutant or ΔJM truncation (Fig. S4). Based on the available model structures for TM and JM helices [16] and given an adequately high sequence identity between human Plexin-B1 and zebrafish Plexin-C1 for those interface residues stabilizing a dimer [17] (Fig. S5), we built a molecular model of the Plexin-B1 TM + JM dimer with the ICR and examined its stability in 4 independent molecular dynamics simulations of 2 s each (Fig. S6a,b). In the ICR of Plexin-B1, the dimer would be maintained by hydrophobic contacts established between the side chains of residues F1544, L1547, M1548 from the JM region and L1923, L2036, and L2037 from the GAP domain (Fig. S6c). The N-terminal part of the JM domain is stabilized as a dimer by the putative coiled-coil interactions established between residues V1525, L1529, L1532, and V1536 (Fig. 1d and Fig. S6d). In Fig. S6e, we plot the distribution of orientation angles of the dimeric transmembrane helices as well as dimeric juxtamembrane helices with respect to the membrane normal (see M&M). Both helices are tilted around 20 degrees. Therefore, the dimeric juxtamembrane region has no contact with the membrane. This directs the GAP and RBD regions away from the membrane and likely better orients the Plexin-B1 GAP domain for association with the substrate Rap1b.
Based on JM domain mutations of a study of the TM and JM of Plexin-A3 [18], we made mutations of leucine 1529 to methionine, leucine 1532 to alanine, and valine 1536 to alanine, as well as a Juxtamembrane deletion construct, ΔJM. Our GAP activity measurements on both proteins showed that removing the JM region of Plexin-B1 abolishes the cooperativity between the Plexin-B1 and Rap1b and also reduced the activity by two thirds (Fig. 1b, table). Similarly, the triple mutant L1529M/L1532A/V1536A, and double mutants L1529M/L1532A or L1532A/V1536A, also lost cooperativity and activity (Hill Coefficient ~ 1, kcat = 0.07 min−1, see also Fig. S7). Interestingly, the deletion/mutations of the Juxtamembrane domain did not affect the Michaelis constant KM of the reaction (Fig. 1b table) suggesting that the GAP active site for Rap1b binding is not affected. No conformational change was detected by MST for both the ΔJM deletion or for the triple mutant protein under our experimental conditions (Fig. 1c).
Treatment with a soluble (N-terminally truncated) ligand, Semaphorin4D (Sema4D) of Plexin-B1 transfected Cos7 cell lines is known to result in the induction of signaling pathways via Plexin-B1: Rap1b: integrin [8, 19]. We show in Fig. 1e,f that with the triple mutant JM domain, the transfected cells do not collapse as compared to the wild-type Plexin-B1 after treatment with Sema4D (this is already true for the double mutants, L1529M/L1532A and L1532A/V1536A, Fig. S8). These observations further confirm the role of the Plexin-B1 JM region in a part of its regulatory mechanism. Although the JM domain does not significantly affect Rap1b binding, the native JM stimulates the turnover of Rap1b (kcat) in the enzyme reaction, especially at higher substrate GTPase concentrations. In order to unveil the underlying molecular mechanism, we examined the structural differences between monomeric and dimeric Plexin-B1 using molecular dynamics simulation. Remarkably, for the first time, we observed a significant structural adjustment of a (so far) unstudied loop in Plexins. For Plexin-B1, this loop comprises residues 1887 to 1915 between the Plexin-B1 RBD and C-terminal half of the GAP domain. Owing to likely intrinsic flexibility, except in one structure of Plexin-B1 bound to Rac1 [13], this loop structure was absent in other crystal structures [10–12, 20]. We noticed that in a monomeric Plexin-B1, the loop extends outward relative to the Plexin-B1 core domain (loop shown in red in Fig. 2a). However, in a model of dimeric Plexin-B1 in our molecular dynamics simulations, the loop moves toward to the JM coiled-coil (Fig. 2b) and is displaced by as much as 15 Å (Fig. S9a). The flexibility of the loop (1887–1915) was compared between the rest state (when the loop may interact with the substrate binding site in the GAP region) and the associated state (the loop is bound to the JM region) (Fig. S9b). Overall, the dynamics of the loop quenches, especially for residues between P1895 and G1905, likely due to the stable association of the loop with the JM. If we were to dock Rap1b to the monomeric apo Plexin-B1 the loop would cause significant steric hindrance to the GAP region, likely affecting Rap1b binding; however, once its conformation is switched to one near the JM coiled-coil region, it provides an open space for Rap1b access. Thus, we expect this loop may play a significant role in modulating the kinetics of the Rap1b enzymatic GTP hydrolysis process. Owing to the importance of this loop, as shown below, we named it, the activation switch loop (a.s. loop).
Fig. 2 .

The conformation change of the Plexin-B1 activation switch loop is stimulated by interactions with the JM region. a Plexin-B1 monomer (pdb id 3SU813) with loops modeled, as above. The activation switch loop (red) causes a steric hindrance for Rap1b (shown in light blue) entry and/or exit into the GAP domain, here for the monomer. b Modeled Plexin-B1 dimer (see M&M). The activation switch loop is displaced from the GAP region and binds to the JM region. c Residue-Residue contact maps between the activation switch loop and the JM helix (% of time contact < 4 Å between sidechains as white to red coloring). d Highlights of key electrostatic interactions formed between JM helices and the activation switch loop
Molecular dynamics simulations strongly suggest that the association of the activation switch loop with the JM region is stabilized by the electrostatic interactions between residues R1899, R1900, R1904, R1910 from the activation switch loop and E1530, E1533, D1538 from the JM (Fig. 2c, d), also to a lesser extent by electrostatic pairing of E1907 and E1909 with R1537. We mutated positively charged arginines (res. 1900 and 1904) in the switch loop to negatively charged glutamic acids, and separately glutamic acids (res. 1530 and 1533) to arginines in the JM domain. We then examined the influence of these mutations on the binding between Plexin-B1 and the constitutively active mutant Rap1b.G12V, as well as on the GAP activity towards Rap1b (Fig. 3a). Both mutants considerably reduce the binding between Plexin-B1 and Rap1b.G12V (Fig. 3a and Fig. S10). This indicates that the interactions established between the a.s. loop and JM region have a role in limiting the otherwise GAP domain inhibiting conformation of the activation switch loop. In accordance with the reduced Rap1b-binding affinity, the double mutation E1530R and E1533R in the JM domain, as well as—separately—the double arginine mutation R1900E and R1904E in the activation switch loop, both result in a loss of GAP activity by over 50% (Fig. 3b). An over 50% diminished effect is also seen in the cell collapse assay as compared to the wild-type Plexin-B1 (Fig. 3c and Fig. S11). We also examined two cancer-associated mutations (given in the COSMIC database, https://cancer.sanger.ac.uk/cosmic): K1523N and D1538G both in the JM region, which, however, have only a small influence on the cell collapse (Fig. S8).
Fig. 3.

Role of the activation switch loop in Plexin-B1 enzyme activity and in cell collapse function. a Plexin-B1: Rap1b.G12V association by MST as a function Rap1b concentration. Glutamic acid 1530 and 1533 in the JM domain and arginine 1900 and 1904 in the activation switch loop play an important role in the association of Rap1b with Plexin-B1 as no significant binding could be fitted (Kd > 100 µM) when these residues are mutated to arginine and glutamic acid, respectively, as compared to the wild-type Plexin-B1. b GAP assay and c cell collapse assay with Plexin-B1 activation switch loop- and JM mutants
Loop–swap chimers show that the function of the activation switch loop is confined to the Plexin-B family
Considering the significance of the activation switch loop, we compared the sequence of this loop between Plexin family members. The loop of Plexin-B1 has an unusual sequence—composed of several arginines and prolines—and differs from the human protein sequence for Plexin-B2 and Plexin-B3 (Fig. 4a) but, importantly, the length of the loop is similar within the Plexin-B subfamily. The other Plexin families—A1-A4, -C1, and D1 have shorter loop lengths, with the Plexin-A1-A4 loop being the shortest. We swapped the Plexin-B1 activation switch loop with Plexin-B2 and -B3 loops and with Plexin-A1, -C1, and -D1 loops. For the swap of the Plexin-B1 loop to -B2, -B3, both the Rap1b association and enzyme reaction rate are not, or only slightly, affected (Fig. 4b,c). This is likely because both Plexin-B2 and -B3 have a relatively long loop and have an abundance of basic amino acids similar to Plexin-B1. In contrast, for the swap of Plexin-B1 a.s. loop to the corresponding sequences of Plexin-A1, -C1, and -D1, the enzyme reaction rates are all significantly reduced, while, surprisingly in each case Rap1b binding is stronger (Fig. 4b,c). The results may be explained as on one hand the -A1, -C1, and -D1 loops are shorter and block the active site less (in agreement with stronger binding), but on the other hand the loop is not long enough to reach over to the JM region and be retained there. Such a reaching over may prevent the loop from returning to partially block the GAP region and/or it may further enhance the GAP activity via the previously identified, activation segment [11]. There is also the possibility that the switch loop aids the Koff rate of product release (weaker Rap1b.GDP binding at the GAP site due to competition from interactions between the activation switch loop and the GTPase).
Fig. 4.

Activation switch loops in different Plexin families. a Sequence alignment of activation switch loops (boxed in red) between different human Plexins. Plexin-B1 wild type and activation switch loop swapped constructs, b binding with Rap1b.G12V and c GAP assay. d Model of the allosteric activation process
A novel form of kinetic allostery, allokairy, arises from a loop movement that competes with substrate
Figure 4d shows a model of how the activation switch (a.s.) loop alters enzymatic turnover. When near the GAP domain, the a.s. loop acts as a soft obstacle in the process of binding Rap1b.GTP and may also slow the release of Rap1b.GDP. At low Rap1b concentration, the a.s. loop affects binding and release of Rap1b significantly and thus retards the turnover rate or the enzymatic reaction (for example, a low kcat ~ 0.07 min−1 for monomeric Plexin-B1), as the a.s. loop needs to move away from the GAP region at every enzymatic turnover process. The steric hindrance of this loop is released upon the formation of interactions with the JM domain, but these are transient, so when the Rap1b. GDP product is released the a.s. loop will return to partially block the active site. At higher substrate concentration, the enzyme can achieve a higher reaction rate and thus higher enzymatic activity (kcat = 0.26 min−1) because as soon as one product Rap1b is released another substrate Rap1b will bind, not giving the a.s. loop time to reposition itself near the GAP region—instead it is stabilized away from this region by interactions with the JM. In addition, the cooperativity in the enzymatic reaction could be further supported by a likely slow repositioning of the JM away from and/or towards the GAP region, as suggested by Jones and colleagues [13], and thus, by the virtue of JM: a.s. loop interactions, this would also increase the residence time of the activation switch in an open state [13]. The formation of a JM coiled-coil appears to be important in stabilizing the a.s. loop away from the GAP region. This means that at higher Rap1b concentration there is a more frequent turn-over process because both the JM and a.s. loop have not enough time to convert back to states where they partly obstruct the GAP region. Similar inferences of a slow conformational transition, which in part are coordinated with an infrequent binding of the substrate at low concentrations and high occupancy at higher substrate concentrations, have been made for other systems [21]. The behavior, resulting from a combination of allosteric and hysteretic features has recently been termed “allokairy” [22, 23].
It should be noted that the proposed model of Fig. 4d can also explain the cooperative behavior within an isolated/homo plexin-B1. However, this scenario is less likely, given that the contacts of the a.s. loop are made with the JM domain of the second protomer. However, dimeric association of intracellular regions is expected to be further enhanced for the full-length receptor at the cell membrane, arising from a concentration effect on limiting diffusion in a large part on going from 3 to 2 dimensions, as well as from the association of transmembrane (Fig. S3), and extracellular regions. These interactions likely synergize with ICR conformational and activity changes [24]. For example, the dimerization of the Plexin-B1 extracellular region triggered by Sema4D has been proven to be vital to the receptors cellular function, since the disruption of the dimeric interface at the extracellular region leads to reduced function of Plexin-B1. We only have a fourfold GAP activity increase in Plexin-B1 ICR above the activity of Plexin-B1 ICR JM. This is probably because there are only few associated Plexin-B1 ICRs in solution and even in an associated state the domains may not be orientated optimally to engage the JM, activation segment and activation switch loops. For example, in the subsequent GAP assay paper of the Zhang laboratory a much more dramatic activity increases for Plexin-C1 and -A were reported, when the N-terminal coiled-coil–JM domain fusion is made at different spacings to the ICR [12]. With the assistance of the TM, ICR dimer formation would be prevalent. This could result in more stable interactions with the activation switch loop and could greatly enhance the activity of plexin at the cell membrane.
Our data show that the extent of activation enhancement due to the activation switch is related to the features of the loop (length as well as charge) in the Plexin-B family of receptors. This finding allows us to speculate on the effect of mutations in the a.s. loop, such as R1904W which appears in prostate cancer patients [25]. In this case, an a.s. loop: JM charge interaction is abolished, also by the placement of a bulky side-chain. Several cancer-associated mutations in the JM region are found in the COSMIC database, such as K1523N, R1537Q, D1538G, but do not show an appreciable change in cell collapse in our hands (Fig. S8). We also noticed serine residue 1902 in the a.s. loop, which is conserved amongst Plexin-B family members. We speculate that this serine works as a residue site for activation via phosphorylation (the NetPhos3.1 server [26] predicts phosphorylation by PKA, PKB, and PKC kinases). With computational modeling, we studied Plexin-B1 ICR with a phosphorylated Serine 1902 (pS1902) with two simulations each of 0.5 s. The activation switch loop shows a largely reduced association with the JM coiled-coil (Fig. S12). The pS1902 interacts with the neighboring arginines 1899, 1904 and 1910, thus greatly reducing the association propensity of the activation switch loop towards the JM coiled-coil. This information could be beneficial for the design of possible inhibitors towards Plexin-B1 in cancer treatment, but still yet to be investigated in further detail.
In accordance with the plexin receptor being the only example of a transmembrane receptor that harbors a functional GAP domain [1–3], we may anticipate novel mechanistic features and to our knowledge this is the first time plexin has been described as an enzyme whose level of activity experiences cooperativity with respect to the level of substrate concentration. Especially, if this is further amplified near the membrane, it would have profound effects of the function of plexin in regulating cell migration and adhesion as it suggests that at low Rap1b (or possibly other Ras-isoform) GTPase concentrations the active receptor has only a small GAP activity. Once a particular threshold of Rap1b concentration is reached, here around 1 µM in our in vitro experiments, activity could be dramatically enhanced via the allokairy mechanism, involving the activation switch loop, as described above. This would then lead to a rapid decrease in the active Rap1b below a threshold and would ensure an all-or none response to the input signal, the cell migration guidance cue, semaphorin. The mechanism would seem especially appropriate for cell collapse (or cell front retraction) as cell attachment via integrins should be switched off completely [2]. Although cooperativity in GTPase regulatory enzymes has been described for guanosine exchange factors (GEFs) and is also apparent in mechanisms that involve allosteric-binding processes to co-activators or membranes [27–29], intriguingly GTPase activating proteins have not been described as cooperative enzymes with respect to substrate concentration so far. To our understanding this possibility has also not been explicitly considered in theoretical models of cell signaling networks [30, 31], which are already rich in features which modulate the activity of GTPase regulatory proteins and the level of active GTPases.
Conclusion
In summary, we characterized the GTPase Activating Protein (GAP) function of Plexin-B1 and found that GAP activity towards Rap1b is associated with a cooperative effect, indicating a conformational change in Plexin, such as a repositioning of a newly discovered activation switch loop and of the Juxtamembrane domain. Importantly, this loop of Plexin-B1 plays a profound role in Rap1b turnover (the overall reaction rate of the enzyme) and we confirmed its role by mutagenesis using a GAP activity assay and by cell collapse assays. The effect is specific to Plexin-B sub-family members and thus for the first time suggests subfamily specific differences in the activation mechanism of Plexin intracellular regions.
Methods
Protein constructs
A series of constructs of the human Plexin-B1 intracellular region, ICR, were designed and cloned into the vector pCol. Plexin-B1 ICD FL [res. 1511–2135]; Plexin-B1 ICR ΔJM [res. 1565–2135] and site-directed mutagenesis, such as L1529M.L1532A; L1532A.V1536A; L1529M.L1532A.V1536A; E1530R.E1533R, R1900E.R1904E; substitution of B1 activation switch loop with the Plexin-B2, -B3, -A1, -C1, or -D1 loop. A series of full-length human Plexin-B1 were also designed and cloned into pCDNA 3.1 for Cos7 cell transfection: Plexin-B1 FL; L1529M.L1532A.V1536A; E1530R.E1533R, and R1900E.R1904E. Human Rap1b wild type (gift of Dr. D. Altschuler, University of Pittsburg) [res. 1 to 184] was subcloned into the expression vector pET28c and constitutive active mutant Rap1b G12V was made. All the constructs also contain a His6-tag at the N-terminus for affinity purification with Nickel-NTA agarose beads (Qiagen). Site-directed mutagenesis was performed using the QuickChange Lightning kit (Agilent Technology). Soluble Sema4D was obtained from R&D Systems Reagents (see Collapse Assay paragraph below).
Protein expression and purification
Plexin-B1 constructs were expressed in a soluble form in E. coli Rosetta (DE3) cells (Invitrogen) by induction with 0.2 mM Isopropyl-β-D-thiogalactopyraniside (IPTG) at 16 ºC for 24 h. Rap1b constructs were also expressed in a soluble form in E. coli BL21 (Invitrogen) with 1 mM IPTG at 25 ºC for 16 h. The cells were harvested at 8000 g for 15 min at 4 ºC. Cells with expressed Plexin were resuspended in 20 mM Tris–HCl pH 7.5, 500 mM NaCl, 5% (v/v) glycerol, 0.5 mM Tris(2-carboxyethyl)phosphine (TCEP), 10 mM Imidazole and 1 mg/mL of hen egg white lysozyme. All GTPases were resuspended in 20 mM Tris–HCl pH 7.5, 150 mM NaCl, 4 mM MgCl2, 5% (v/v) glycerol, 0.5 mM TCEP. Both buffers were supplemented with 1 tablet per 10 mL of the EDTA-free protease inhibitor cocktail (Novagen, Inc.), 1 mM Phenylmethane sulfonyl fluoride (PMSF), 20 µg/mL Leupeptin, 2 µg/mL Antipain, 10 mM/mL Benzamidine, and 50 µg/mL Pepstatin. All resuspended cell pellets were sonicated and then centrifuged at 48,000 g for 1 h at 4 °C. The supernatants were collected and since all the constructs contain a His6-Tag at their N-termini, protein purification was accomplished by their affinity to Nickel–NTA agarose beads employing the standard protocol (Novagen, Inc.). There is no evidence that the N-terminal Histidine influences the measurements, thus the his-tag was not cleaved from the proteins. Plexins and GTPases were further purified by either size exclusion chromatography or using a PD-10 Sephadex G-25 desalting column (GE Healthcare) in 20 mM Tris–HCl pH 7.5, 150 mM NaCl, 5% (v/v) glycerol, 2 mM TCEP, 0.005% Tween-20.
GTP loading
For GAP activity measurement, Rap1b, was loaded with excess GTP right after the purification: 100 µM Rap1b was incubated with 0.5 mM GTP at 30 °C for 10 min in a GTP loading buffer (20 mM Tris–HCl pH7.5, 100 mM NaCl, 5 mM EDTA, 2 mM DTT). The reaction was stopped on ice by adding 50 mM MgCl2. To remove unloaded GTP, DTT, imidazole and EDTA from the reaction, the loaded GTPase was purified using a PD-10 Sephadex G-25 desalting column (GE Healthcare) in the final GTPase buffer (20 mM Tris–HCl, 150 mM NaCl, 4 mM MgCl2, 0.5 mM TCEP, 5% (v/v) glycerol, pH 7.4). For binding experiments, Rap1b was loaded with the very slowly hydrolyzing Gpp(NH)p analogue instead of GTP using the same conditions described above and purified using a PD-10 Sephadex G-25 desalting column in PBS-T 0.1%, (50 mM phosphate pH 7.4,150 mM NaCl, 0.1% (v/v) Tween-20) supplemented with 4 mM MgCl2.
Measurement of GTPase activity in vitro
The fluorescence-change based GAP assay [32, 33] was performed using a Tecan Infinite M1000 microplate reader (TECAN, Inc.) at 30 °C with proteins in a GAP reaction buffer (20 mM Tris–HCl, pH 7.5, 50 mM NaCl, 0.2 mM TCEP, 2 mM MgCl2) and 4 µM of the phospho-binding protein (PBP) (Life Technologies) to detect the inorganic phosphate (Pi) that released from the GTPase following GTP hydrolysis (Fig. S2). The reaction was done in a total volume of 50 µL. First, 0.3 µM of Plexin-B1 was added to the reaction and incubated at 30 °C until the baseline had stabilized (2–3 min). 0 to 4 µM of GTP-loaded Rap1b was then added to the mix and the release of Pi was monitored by the change in fluorescence [using 425 nm (λex) and 465 nm (λem)] at 1 min intervals for up to 60 min. To calculate the concentration of Pi released in nM/min, a standard curve was measured using 0 to 2.5 µM inorganic phosphate in the same GAP reaction buffer. The enzyme activity and Michaelis constants were calculated from the “steady state” of phosphate release (initial slope where the substrate concentration is in greater excess as compared to the enzyme concentration and yield maximum velocities). Kinetic constants KM, Vmax, and kcat were calculated using the Michaelis–Menten equation (Eq. 1) and cooperativity was calculated using the Hill equation (Eq. 2).
Equation 1: Michaelis–Menten equation: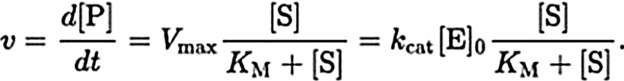
Where
v is the reaction rate
[P] is the concentration of product (Rap1b.GDP)formed
t is the time of the reaction
[S] is the substrate concentration, Rap1b.GTP
Kcat is the rate constant
KM is the Michaelis constant
Vmax is the maximum rate.
[E] is the initial enzyme concentration, the Plexin-B1 ICD or variants at 300 nM
Equation 2: Hill equation: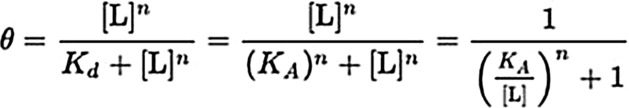
Where:
θ is the fraction of the receptor protein concentration that is bound by the ligand
[L] is the free unbound Rap1b concentration
Kd is the apparent dissociation constant derived from the law of mass action
KA is the Rap1b concentration producing half occupation of the enzyme
n is the Hill coefficient.
Measurement of the dissociation constant in vitro
Binding experiments were performed using a Monolith NT.115 Microscale Thermophoresis (MST) instrument (NanoTemper) at room temperature in phosphate buffer saline with 0.1% Tween-20 (PBS-T 0.1%). Proteins were labeled using the NanoTemper Monolith HIS-Tag Labeling Kit RED-trisNTA which labels His-tags with a fluorescent group. 40 nM of each labeled Plexin construct was mixed with a serial dilution of unlabeled GTPases or Plexin-B1 in 0.2 mL micro reaction tubes (NanoTemper) and then transferred to premium capillaries (NanoTemper). Microscale thermophoresis measures the change of the diffusion of molecules in microscopic temperature gradients upon protein ligand-binding/protein–protein association. The dissociation constant Kd was obtained by fitting the binding curve with the quadratic solution for the fraction of fluorescent molecules that formed the complex between proteins A and T, calculated from the law of mass action KD = [A]*[T]/[AT] where [A] is the concentration of free fluorescent molecule and [T] the concentration of free titrant and [AT] the concentration of complex of A and T.
DN-Ara assay
Plasmid pAraGFPCDF was first transformed in the AraC deficient E. coli strain SB1676. Plasmids for the DN-Ara [34] assay were a gift from Dr. B.W. Berger. The cells containing this GFP-plasmid were then made competent on media containing 50 µg/mL Spectinomycin and co-transformed with the plasmids pAraTMwt and pAraTMDN. The cells containing the three plasmids were selected on LB plates containing 50 µg/mL Spectinomycin, 50 µg/mL Ampicillin and 25 µg/mL Kanamycin. One colony from each plate was grown in 5 mL LB media at 37 °C for 18 h at 250 rpm. 50µL of culture from each sample was then transferred to 5 mL LB media and grown again for 18 h using the same conditions. Cell cultures were then diluted in the same media to 0.6 OD600nm and induced with 1 mM IPTG for 6 h at 37 °C and 250 rpm. A twofold dilution was made in LB and 100µL of culture form each sample was then transferred to a black 96-well, clear bottom (Greiner) plate. Measurements at 560 nm for cell density and GFP fluorescence at 585 nm (excitation) and 530 nm (emission) were collected using a M1000 Tecan plate fluorescence reader. The relative fluorescence was calculated as the ratio of the fluorescence at 530 nm/fluorescence at 560 nm and normalized by cell absorbance. The results were then divided by the negative control pGFPPDF/pTrc99/pTrc-RSF empty vectors.
Cell collapse assay
1 µg of recombinant Plexin-B1 FL WT pCDNA 3.1 plasmid or Plexin-B1 FL mutants pCDNA 3.1 (as described above) was transfected to 80% confluent COS 7 cells on coverslips using 3 µL Trans IT 2020 transfection reagent (Mirus Bio) for 48 h at 37 ºC. The cells were then treated with 25 nM soluble Sema4D (R&D Systems Reagents) for 35 min or not treated (control). The cells were then fixed and treated with PB1 C-terminal anti Rabbit as primary antibody and Goat anti-rabbit IgG H&L (Alexa Fluor 488, green) as secondary antibody. The nuclei were stained with DAPI (blue). After mounting the coverslips on glass, the results were acquired by digital images using a microscope equipped with a confocal imaging system. The counts are the morphometric quantification of collapsed cells. As done by others [35], we have only counted the positively receptor-expressing cells, and for each experiments we examined multiple slides to assess at least 50 cells expressing the plexin. The collapsed cells are defined as rounded cells having a diameter ≤ 15 µm.
Molecular dynamics simulation
Molecular Models of Plexin-B1 were constructed using the available Plexin-B1 structure (PDB entry 3hm6 and 3su8). Missing loops were built with Modeller [36]. Dimeric Plexin-B1 was modeled by sequence alignment and structure superimposition with dimeric Plexin-C1 of zebrafish (PDB entry 4m8n). The Plexin-B1 transmembrane helix was embedded into the membrane of 680 POPC and 170 POPS with the CHARMM-GUI [37]. The protein–membrane system was solvated by TIP3P water with 150 mM NaCl for a total of ~ 450,000 atoms. Four independent simulations were performed for dimeric Plexin-B1.
All simulations were performed with the NAMD/2.12 [38] package for initial equilibration of 50 ns. The simulations were then transferred to the Anton 2 supercomputer for production run of 2.0 µs. The CHAMRM36m [39] force field was used in the simulations for water and biomolecules. The van der Waals (vdW) potential was cut off at 12 Å and smoothly shifted to zero between 10 and 12 Å. The electrostatic interactions were calculated with the particle-mesh Ewald (PME) method with a real-space cut-off of 1.2 nm. The SHAKE algorithm was applied for all covalent bonds to hydrogen. A time step of 2 fs was employed and neighbor lists updated every 10 steps. The temperature was coupled by to a Langevin thermostat of 310 K, whereas the pressure control was achieved by a semi-isotropic Langevin scheme at 1 bar. After an equilibration time of 50 ns the trajectories were transferred to Anton2 [40] for calculation of the µs long trajectories. In order to calculate the orientation of a helix dimer relative to the membrane, the alpha carbons of the first four residues of the helix A and helix B are selected to calculate the center of mass of the N-terminus. Similarly, the last four residues of each of the two helices are used to calculate the average position of the C-terminus. The directional vector of a helix dimer is then the line connecting the N-terminal center to the C-terminal center. The orientation angle of the transmembrane or juxtamembrane helix dimer is then calculated by measuring the angle between the membrane normal direction and the helix dimer directional vector. The trajectories were analyzed with VMD [41] and with scripts for standard analysis.
Electronic supplementary material
Below is the link to the electronic supplementary material.
Acknowledgements
We thank Drs. Liqun Zhang and Prasanta K. Hota for early work on this project. This work is supported by a NIH R01 grant from the National Eye Institute R01EY029169 and previous grants from NIGMS (R01GM073071 and R01GM092851) to the Buck lab. The Tamagnone lab was supported by the Italian Association for Cancer Research (AIRC-IG grant #19923). Anton Computer time was provided by the Pittsburgh Supercomputing Center (PSC) through Grant R01GM116961 from the National Institutes of Health.
Author contributions
Z.L., J.M., and M.B designed the studies, interpreted the data and wrote the manuscript. J.M. conducted cellular experiments, GAP assay and dimerization assays, with L.T. carrying out additional cell collapse assay and contributing to data analysis, manuscript writing and revision. Z.L. performed the molecular dynamics simulation. S.K. designed the plasmids, performed the DN-Ara assay and worked on the initial implementation of the GAP assay.
Compliance with ethical standards
Competing interests
The authors declare no competing interests.
Footnotes
Publisher's Note
Springer Nature remains neutral with regard to jurisdictional claims in published maps and institutional affiliations.
Zhen-lu Li and Jeannine Müller-Greven equal contributions.
References
- 1.Tamagnone L, Comoglio PM. Signalling by semaphorin receptors: cell guidance and beyond. Trends Cell Biol. 2000;10:377–383. doi: 10.1016/S0962-8924(00)01816-X. [DOI] [PubMed] [Google Scholar]
- 2.Huber AB, Kolodkin AL, Ginty DD, Cloutier J-F. Signaling at the growth cone: ligand-receptor complexes and the control of axon growth and guidance. Annu Rev Neurosci. 2003;26:509–563. doi: 10.1146/annurev.neuro.26.010302.081139. [DOI] [PubMed] [Google Scholar]
- 3.Hota PK, Buck M. Plexin structures are coming: opportunities for multilevel investigations of semaphorin guidance receptors, their cell signaling mechanisms, and functions. Cell Mol Life Sci. 2012;69:3765–3805. doi: 10.1007/s00018-012-1019-0. [DOI] [PMC free article] [PubMed] [Google Scholar]
- 4.Deng S, et al. Plexin-B2, but not Plexin-B1, critically modulates neuronal migration and patterning of the developing nervous system in vivo. J Neurosci. 2007;27:6333–6347. doi: 10.1523/JNEUROSCI.5381-06.2007. [DOI] [PMC free article] [PubMed] [Google Scholar]
- 5.Franco M, Tamagnone L. Tyrosine phosphorylation in semaphorin signalling: shifting into overdrive. EMBO Rep. 2008;9:865–871. doi: 10.1038/embor.2008.139. [DOI] [PMC free article] [PubMed] [Google Scholar]
- 6.Pasterkamp R. R-Ras fills another GAP in semaphorin signalling. Trends Cell Biol. 2005;15:61–64. doi: 10.1016/j.tcb.2004.12.005. [DOI] [PubMed] [Google Scholar]
- 7.Tong Y, et al. Binding of Rac1, Rnd1, and RhoD to a novel Rho GTPase interaction motif destabilizes dimerization of the Plexin-B1 effector domain. J Biol Chem. 2007;282:37215–37224. doi: 10.1074/jbc.M703800200. [DOI] [PMC free article] [PubMed] [Google Scholar]
- 8.Wang Y, et al. Plexins are GTPase-activating proteins for rap and are activated by induced dimerization. Sci Signal. 2012;5:ra6. doi: 10.1126/scisignal.2002636. [DOI] [PMC free article] [PubMed] [Google Scholar]
- 9.Swiercz JM, Kuner R, Offermanns S. Plexin-B1/RhoGEF-mediated RhoA activation involves the receptor tyrosine kinase ErbB-2. J Cell Biol. 2004;165:869–880. doi: 10.1083/jcb.200312094. [DOI] [PMC free article] [PubMed] [Google Scholar]
- 10.Tong Y, et al. Structure and function of the intracellular region of the Plexin-B1 transmembrane receptor. J Biol Chem. 2009;284:35962–35972. doi: 10.1074/jbc.M109.056275. [DOI] [PMC free article] [PubMed] [Google Scholar]
- 11.He H, Yang T, Terman JR, Zhang X. Crystal structure of the plexin A3 intracellular region reveals an autoinhibited conformation through active site sequestration. Proc Natl Acad Sci. 2009;106:15610–15615. doi: 10.1073/pnas.0906923106. [DOI] [PMC free article] [PubMed] [Google Scholar]
- 12.Wang Y, Pascoe HG, Brautigam CA, He H, Zhang X. Structural basis for activation and non-canonical catalysis of the Rap GTPase activating protein domain of plexin. eLife. 2013;2:e01279. doi: 10.7554/eLife.01279. [DOI] [PMC free article] [PubMed] [Google Scholar]
- 13.Bell CH, Aricescu AR, Jones EY, Siebold CA. Dual binding mode for RhoGTPases in plexin signalling. PLoS Biol. 2011;9:e1001134. doi: 10.1371/journal.pbio.1001134. [DOI] [PMC free article] [PubMed] [Google Scholar]
- 14.Li S, Nakamura S, Hattori S. Activation of R-Ras GTPase by GTPase-activating Proteins for Ras, Gap1m, and p120GAP. J Biol Chem. 1997;272:19328–19332. doi: 10.1074/jbc.272.31.19328. [DOI] [PubMed] [Google Scholar]
- 15.Muller-Greven J, et al. Characterizing plexin GTPase interactions using gel filtration, surface plasmon resonance spectrometry, and isothermal titration calorimetry. Methods Mol Biol Semaphor Signal. 2017;1493:89–105. doi: 10.1007/978-1-4939-6448-2_6. [DOI] [PubMed] [Google Scholar]
- 16.Zhang L, Polyansky A, Buck M (2015) Modeling transmembrane domain dimers/trimers of plexin receptors: implications for mechanisms of signal transmission across the membrane. Plos One 10. [DOI] [PMC free article] [PubMed]
- 17.Alves CJ, Yotoko K, Zou H, Friedel RH. Origin and evolution of plexins, semaphorins, and Met receptor tyrosine kinases. Sci Rep. 2019;9:1970. doi: 10.1038/s41598-019-38512-y. [DOI] [PMC free article] [PubMed] [Google Scholar]
- 18.Barton R, Palacio D, Iovine MK, Berger BW. A cytosolic juxtamembrane interface modulates plexin A3 oligomerization and signal transduction. Plos One. 2015;10:e0116368. doi: 10.1371/journal.pone.0116368. [DOI] [PMC free article] [PubMed] [Google Scholar]
- 19.Okada T, et al. The Rho GTPase Rnd1 suppresses mammary tumorigenesis and EMT by restraining Ras-MAPK signalling. Nat Cell Biol. 2015;17:81–94. doi: 10.1038/ncb3082. [DOI] [PMC free article] [PubMed] [Google Scholar]
- 20.Fansa EK, Dvorsky R, Zhang S-C, Fiegen D, Ahmadian MR. Interaction characteristics of Plexin-B1 with Rho family proteins. Biochem Biophys Res Commun. 2013;434:785–790. doi: 10.1016/j.bbrc.2013.04.012. [DOI] [PubMed] [Google Scholar]
- 21.Whittington AC, et al. Dual allosteric activation mechanisms in monomeric human glucokinase. Proc Natl Acad Sci. 2015;112:11553–11558. doi: 10.1073/pnas.1506664112. [DOI] [PMC free article] [PubMed] [Google Scholar]
- 22.Neet KE, Ainslie GR., Jr Hysteretic enzymes. Methods Enzymol. 1980;64:192–226. doi: 10.1016/S0076-6879(80)64010-5. [DOI] [PubMed] [Google Scholar]
- 23.Hilser VJ, Anderson JA, Motlagh HN. Allostery vs. “allokairy”. Proc Nat Acad Sci. 2015;112:11430–11431. doi: 10.1073/pnas.1515239112. [DOI] [PMC free article] [PubMed] [Google Scholar]
- 24.Janssen BJC, et al. Structural basis of semaphorin–plexin signalling. Nature. 2010;467:1118–1122. doi: 10.1038/nature09468. [DOI] [PMC free article] [PubMed] [Google Scholar]
- 25.Wong OG-W, et al. Plexin-B1 mutations in prostate cancer. Proc Natl Acad Sci. 2007;104:19040–19045. doi: 10.1073/pnas.0702544104. [DOI] [PMC free article] [PubMed] [Google Scholar]
- 26.Blom N, Sicheritz-Pontén T, Gupta R, Gammeltoft S, Brunak S. Prediction of post-translational glycosylation and phosphorylation of proteins from the amino acid sequence. Proteomics. 2004;4:1633–1649. doi: 10.1002/pmic.200300771. [DOI] [PubMed] [Google Scholar]
- 27.Hoang HM, Umutesi HG, Heo J. Allosteric autoactivation of SOS and its kinetic mechanism. Small GTPases. 2019;13:1–16. doi: 10.1080/21541248.2019.1601954. [DOI] [PMC free article] [PubMed] [Google Scholar]
- 28.Bandaru P, Kondo Y, Kuriyan J. The interdependent activation of son-of-sevenless and ras. Cold Spring Harb Perspect Med. 2019;2:a031534. doi: 10.1101/cshperspect.a031534. [DOI] [PMC free article] [PubMed] [Google Scholar]
- 29.Zubeldia-Brenner L, Gutierrez-Uzquiza A, Barrio-Real L, Wang H, Kazanietz MG, Leskow FC. β3-chimaerin, a novel member of the chimaerin Rac-GAP family. Mol Biol Rep. 2014;41:2067–2076. doi: 10.1007/s11033-014-3055-3. [DOI] [PMC free article] [PubMed] [Google Scholar]
- 30.Goryachev AB, Pokhilko AV. Computational model explains high activity and rapid cycling of Rho GTPases within protein complexes. PLoS Comput Biol. 2006;2:e172. doi: 10.1371/journal.pcbi.0020172. [DOI] [PMC free article] [PubMed] [Google Scholar]
- 31.Lipshtat A, Jayaraman G, He JC, Iyengar R. Design of versatile biochemical switches that respond to amplitude, duration, and spatial cues. Proc Natl Acad Sci USA. 2010;107:1247–1252. doi: 10.1073/pnas.0908647107. [DOI] [PMC free article] [PubMed] [Google Scholar]
- 32.Brune M, Hunter JL, Corrie JET, Webb MR. Direct, real-time measurement of rapid inorganic phosphate release using a novel fluorescent probe and its application to actomyosin subfragment 1 ATPase. Biochemistry. 1994;33:8262–8271. doi: 10.1021/bi00193a013. [DOI] [PubMed] [Google Scholar]
- 33.Brune M, et al. Mechanism of inorganic phosphate interaction with phosphate binding protein from Escherichia coli†. Biochemistry. 1998;37:10370–10380. doi: 10.1021/bi9804277. [DOI] [PubMed] [Google Scholar]
- 34.Su P-C, Berger BW. A novel assay for assessing juxtamembrane and transmembrane domain interactions important for receptor heterodimerization. J Mol Biol. 2013;425:4652–4658. doi: 10.1016/j.jmb.2013.07.022. [DOI] [PubMed] [Google Scholar]
- 35.Barberis D, Artigiani S, Casazza A, Corso S, Giordano S, Love CA, Jones EY, Comoglio PM, Tamagnone L. Plexin signaling hampers integrin-based adhesion, leading to Rho-kinase independent cell rounding, and inhibiting lamellipodia extension and cell motility. FASEB J. 2004;18:592–594. doi: 10.1096/fj.03-0957fje. [DOI] [PubMed] [Google Scholar]
- 36.Webb B, Sali A. Protein structure modeling with MODELLER. Methods Mol Biol. 2017;1654:39–54. doi: 10.1007/978-1-4939-7231-9_4. [DOI] [PubMed] [Google Scholar]
- 37.Jo S, et al. CHARMM-GUI 10 years for biomolecular modeling and simulation. J Comput Chem. 2016;38:1114–1124. doi: 10.1002/jcc.24660. [DOI] [PMC free article] [PubMed] [Google Scholar]
- 38.Phillips JC, et al. Scalable molecular dynamics with NAMD. J Comput Chem. 2005;26:1781–1802. doi: 10.1002/jcc.20289. [DOI] [PMC free article] [PubMed] [Google Scholar]
- 39.Huang J, et al. CHARMM36m: an improved force field for folded and intrinsically disordered proteins. Nat Methods. 2016;14:71–73. doi: 10.1038/nmeth.4067. [DOI] [PMC free article] [PubMed] [Google Scholar]
- 40.Shaw DE et al (2014) Anton 2: raising the bar for performance and programmability in a special-purpose molecular dynamics supercomputer. IEEE, p 41–53
- 41.Humphrey W, Dalke A, Schulten K. VMD: Visual molecular dynamics. J Mol Graph. 1996;14:33–38. doi: 10.1016/0263-7855(96)00018-5. [DOI] [PubMed] [Google Scholar]
Associated Data
This section collects any data citations, data availability statements, or supplementary materials included in this article.