Abstract
In the vertebrate retina, the location of a neuron’s receptive field (RF) in visual space closely corresponds to the physical location of synaptic input onto its dendrites, a relationship called the retinotopic map. We report the discovery of a systematic spatial offset between the ON and OFF receptive subfields in F-mini-ON retinal ganglion cells (RGCs). Surprisingly, this property does not come from spatially-offset ON and OFF layer dendrites, but instead arises from a network of electrical synapses via gap junctions to RGCs of a different type, the F-mini-OFF. We show that the asymmetric morphology and connectivity of these RGCs can explain their RF offset, and we use a multi-cell model to explore the effects of receptive field offset on the precision of edge location representation in a population. This RGC network forms a novel electrical channel combining the ON and OFF feed-forward pathways within the output layer of the retina.
Introduction
Receptive fields (RFs) are a foundational concept in sensory neuroscience. The RF of a sensory neuron is shaped by the properties of its synaptic inputs from connected neurons. In the early visual system, retinotopic maps define a strict correspondence between the location of a cell’s dendrites and its RF location in visual space1. Retinal ganglion cells (RGCs), the output cells of the retina, form dendritic mosaics that tile retinal space and have corresponding RF mosaics that tile visual space2,3.
Superimposed on the mosaic organization of retinal neurons is the division into ON and OFF channels which respond to light increments and decrements, respectively. The ON and OFF pathways diverge at the first synapse in the visual system, the output of the photoreceptors, and they reconverge in multiple locations, including in ON-OFF RGCs that increase their firing for both increments and decrements. In the mouse, where they are best characterized, RGCs comprise greater than 40 functionally, morphologically, and transcriptomically distinct types4–9. All previously identified ON-OFF RGC types have aligned ON and OFF receptive fields10–13, and they all receive excitatory synaptic inputs from both ON and OFF bipolar cells. Inputs from ON and OFF bipolar cells are formed either at two distinct dendritic strata in the inner plexiform layer13 or at a single stratum in the middle of the inner plexiform layer where ON and OFF bipolar cell terminals overlap14.
We report on an RGC type that breaks both of these conventions. These RGCs have a systematic spatial offset between their ON and OFF RF subfields. The RGCs do not receive ON and OFF input from bipolar cells on spatially offset dendrites. Instead, the RF offset arises from a novel circuit composed of gap junctions with several RGCs of a single, different functional type. While RFs with offset ON and OFF subfields result in a modest amount of direction selectivity and orientation selectivity for certain stimuli at the level of single RGCs, modeling demonstrates a large enhancement in the encoding of edge position within a population of RGCs. Our multi-cell model reveals that offset ON and OFF RF subfields could help a population of RGCs encode edge position with precision down to 0.6 degrees of visual angle, less than 12% of the RF diameter of a single RGC.
Results
F-mini RGCs have both ON and OFF responses
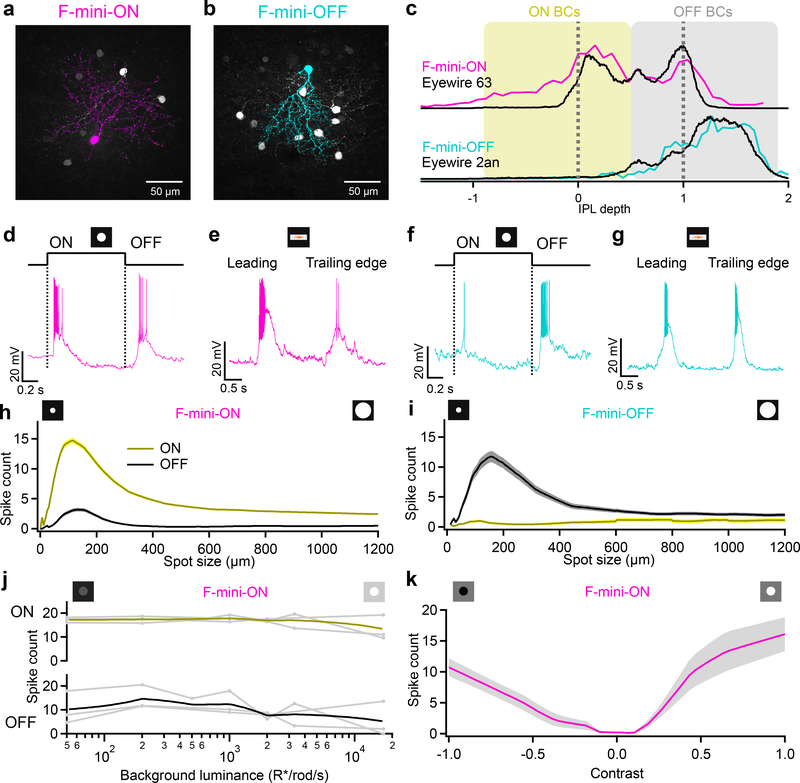
F-mini RGCs were recently identified as two different cell types: F-mini-ON and F-mini-OFF, based on their expression patterns of several transcription factors, their unique morphologies, and their light responses15. F-mini RGCs are the second and third most numerous RGC types in the mouse retina, together comprising 13% of RGCs8. We recorded light responses from functionally-identified F-mini RGCs in dark-adapted mouse retina (see Methods) and later confirmed their identity by morphological analysis (Fig. 1a–c) and immunohistochemistry (IHC) (Extended Data Fig. 1). Unlike in the initial reports, we found that both F-mini RGC types responded to both light increments (ON) and decrements (OFF) for small spots and moving bars (Fig. 1d–k, see Discussion). We focused primarily on F-mini-ON RGCs in search of a circuit mechanism for the ON-OFF responses.
Figure 1. F-mini-ON and F-mini-OFF RGCs have both ON and OFF light responses.
a, b, Images of F-mini-ON and F-mini-OFF RGCs from fixed tissue. Magenta and cyan color scheme for RGC types is consistent throughout. All cell images throughout are shown with the dorsal direction on the retina toward the top of the page. Targeted RGCs were traced and colored, overlaid on gray. Morphology was consistent in all images (n = 40, 20 cells) c, Stratification profiles of an F-mini-ON and an F-mini-OFF RGC from our cell fills (colored lines) and from the data in the Eyewire museum (black). Dashed lines indicate ON and OFF choline acetyltransferase (ChAT) bands. Shading shows the stratification regions of ON (yellow) and OFF (grey) bipolar cells (BCs) in the inner plexiform layer. d, F-mini-ON RGC in current clamp responding to the onset and offset of a positive contrast spot from darkness to 200 isomerizations R*/rod/s. e, F-mini-ON RGC responding to the leading and trailing edge of a positive contrast moving bar (140 μm x 500 μm, 1000 μm/s, 200 R*/rod/s). f, g, Same as d, e for an F-mini-OFF RGC. h, Spike counts in F-mini-ON RGCs responding to positive contrast spots of varying diameters. Mean onset responses in yellow; mean offset responses in black;shaded region is SEM (n = 172 cells). i, Same as h for F-mini-OFF RGCs (n = 85 cells). j, Spiking responses of F-mini-ON RGCs to a flashed spot at varying mean luminance, showing the variations in ON and OFF responses with light level (n = 3 cells, spot diameter = 130 μm). k, Spiking responses of F-mini-ON RGCs to onset of flashed spots of varying contrast from the background luminance, mean with shadedSD across cells (n = 8 cells).
To explore the robustness of the ON-OFF responses in F-mini-ON RGCs, we adapted the retina to different mean luminances across the range from scotopic to photopic. We found robust ON and OFF responses across this range (Fig. 1j). We also measured the contrast response functions of F-mini-ON RGCs on a photopic background and found similar contrast sensitivity for the ON and OFF responses (Fig. 1k).
The ON and OFF RFs of F-mini-ON RGCs are systematically displaced despite aligned dendritic strata
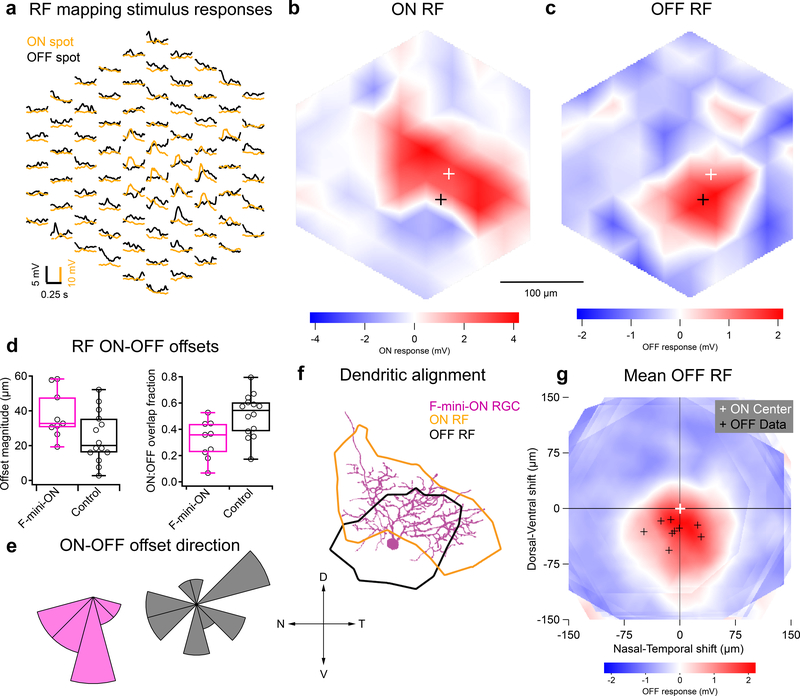
We mapped ON and OFF RFs in F-mini and other RGCs using a stimulus consisting of small spots of positive and negative contrast12. We identified a consistent spatial offset between the ON and OFF RF subfields in F-mini-ON RGCs (Fig. 2). F-mini-ON RGCs had an ON-OFF offset of 38 ± 14 μm (n = 9 cells, Fig. 2d), greater than that of control RGCs having an offset of 25 ± 15 μm (n = 14 cells, p = 0.047). We found a significant asymmetry in the offset of the F-mini-ON RGCs but not control RGCs (all mean ± SD, one-sample two-tailed t-test). The vertical component of the offset in F-mini-ON RGCs was always ventralward (OFF ventral to ON, −30 ± 13 μm, p = 9.2e-5Fig. 2e), with a horizontal component not significantly distributed to one side (−7.5 ± 24 μm, p = 0.37). Control ON-OFF RGCs lacked a systematic vertical or horizontal displacement (vertical: −4.0 ± 18 μm, p = 0.42, horizontal: −3.7 ± 23 μm, p = 0.56). The distribution of offset directions was uniform for control ON-OFF RGCs (p = 0.93, Rayleigh test) and highly non-uniform for F-mini-ON RGCs (p < .001, Fig. 2e). We also quantified the fractional overlap (intersection area / union area) between the ON and OFF RFs and found it to be lower in F-mini-ON RGCs than in other ON-OFF RGCs (n = 9, 14 cells, p < 0.01, two-sample t-test, Fig. 2d,e). A smaller sample of F-mini-OFF RFs also showed diffuse ON and ventrally displaced OFF subfields (Extended Data Fig. 2).
Figure 2. RF ON and OFF subfields measured by flashed spots are spatially offset.
a, Average responses of a F-mini-ON RGC to 30 μm spots of positive (orange) or negative (black) contrast at the indicated positions. b,c, Interpolated ON and OFF spatial RFs from the data in a. White and black crosses mark the ON and OFF centers-of-mass (COM), respectively. d, Population data showing the fractional overlap of the OFF RF relative to the ON RF for F-mini-ON RGCs (magenta) and other ON-OFF RGCs (grey) (n = 9, 14 cells, see Methods). e, Polar histograms showing the offset angle between the ON RF COM and the OFF RF COM for F-mini-ON RGCs (magenta) and other ON-OFF RGCs (grey). OFF ventral of ON is shown as a downward (ventral) angle. f, Image of the cell from a-c overlaid with its ON (orange) and OFF (black) RF contours. g, Average OFF RF for F-mini-ON RGCs aligned to the center-of-mass of each ON RF at the origin. Points are the center-of-mass for individual cells (n = 9). Scale bar is the same in a-c,f,g. Box plots in d show maximum, 75th percentile, median, 25th percentile, and minimum.
We sought to determine whether the RF offset might be explained by an offset within the dendritic area of an F-mini-ON RGC. RF locations in visual space are derived from bipolar cell and amacrine cell inputs arriving at the dendrites of the RGC. So, a spatial offset in the dendritic area could create a spatial offset in the RF2,3,16. We used the Eyewire museum electron microscopy reconstruction RGC dataset8 and measured the center of mass of the dendrites within ON and OFF BC layers for all bistratified RGC types. The population of F-mini-ON RGCs showed well aligned dendritic strata, similar to other bistratified RGCs (Fig. 3, Extended Data Fig. 3). Thus, F-mini-ON RGCs have RFs with spatially offset ON and OFF subfields, with the OFF subfield consistently ventral of the ON subfield, and this result is not simply explained by displacement of their dendritic strata.
Figure 3. Alignment between ON and OFF strata of bistratified RGCs.
a, Example projection image of an F-mini-ON RGC from Eyewire8, dendrites colored by stratification: green proximal/inner/ON, blue distal/outer/OFF, cyan between, red soma and axon. Centers of mass of inner and outer strata are marked by circled crosses. b, Dendritic offset distance by cell type, mean with SD, n = 16, 19, 23, 17, 7, 6, 3, 6 cells. RGC type names are followed by Eyewire anatomical types in parentheses. Magenta line is at 38 μm, the mean RF offset found in F-mini-ON RGCs. c, Offset values in μm from four small bistratified RGC types in Eyewire. Red crosses show mean and standard deviation of offsets.. Spatial data from the remaining four bistratified types is in Extended Data Fig. 3. Box plots in b show maximum, 75th percentile, median, 25th percentile, and minimum.
F-mini-ON and F-mini-OFF RGCs are directly heterotypically coupled through gap junctions
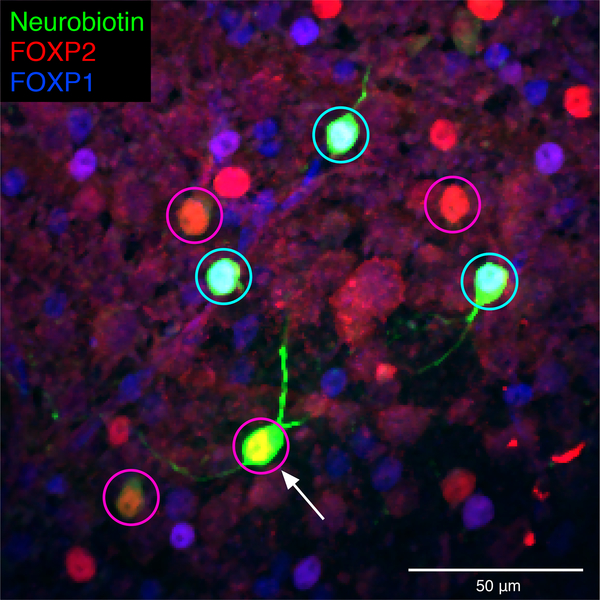
Many RGCs make gap junctions with other RGCs of the same type or with amacrine cells17, and these electrical synapses can affect RF properties18,19. Since dendritic morphology alone could not explain the ON-OFF RF offset in F-mini-ON RGCs, we sought to test whether gap junctions contributed to this unusual RF property. We filled individual F-mini-ON RGCs with the gap-junction permeable tracer Neurobiotin, delivered during whole-cell patch clamp recordings. In addition to the patched cell, Neurobiotin labelled several surrounding cells in the ganglion cell layer with a distinct morphology. We confirmed that the coupled cells were RGCs by the presence of an axon extending toward the optic nerve, and we confirmed their identity as F-mini RGCs by their light stimulus responses, morphology, and by the presence or absence of the transcription factors Forkhead box protein P1 and P2 (FOXP1 and FOXP2) (Figs. 1, 4, Extended Data Fig. 1).
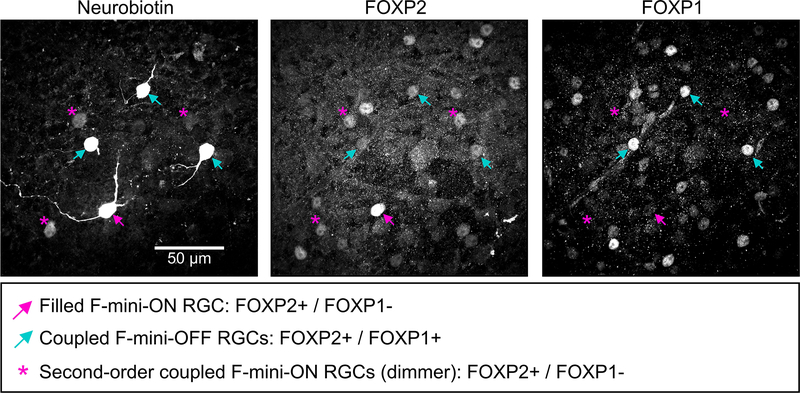
Figure 4. Heterotypic gap junctions among F-mini-RGCs are confirmed by immunohistochemistry.
Image of the ganglion cell layer in a patch of retina in which a single F-mini-ON RGC was filled with Neurobiotin (arrow). RGC somas labeled by the dye are circled: cyan F-mini-OFF (first degree connections) and magenta F-mini-ON (filled RGC and second degree connections). The transcription factor FOXP2 is found in all F-mini RGCs (red); FOXP1 is found in F-mini-OFF RGCs (blue). Results were consistent over several images (n = 5 filled networks on 4 retinas).
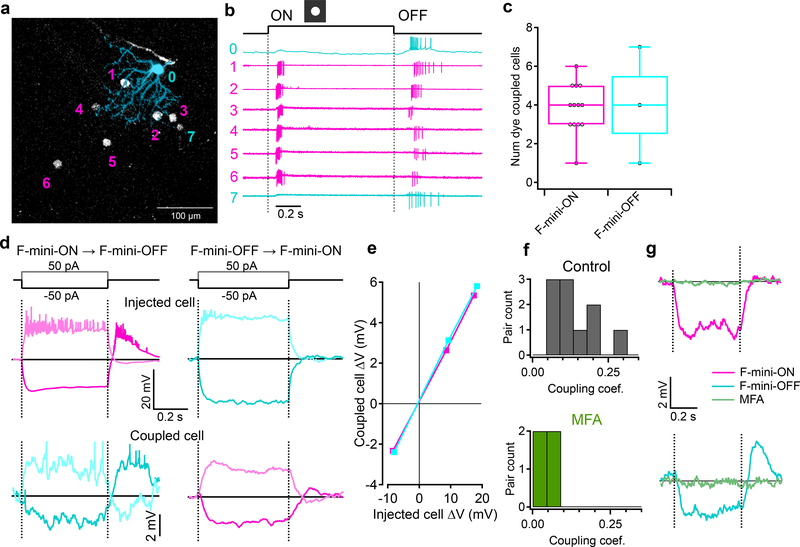
Gap junctions between F-mini RGCs were not only permeable to Neurobiotin (Fig. 1a,b, Fig. 4), but also to the larger fluorescent molecule Alexa Fluor 488 (Fig. 5a). This dye allowed us to identify coupled cells in live tissue by two-photon (2P) excitation20, and record their light responses sequentially or simultaneously (Fig. 5b). F-mini-ON RGCs were coupled to 3.85 ± 1.3 RGCs (n = 13 cells); F-mini-OFF RGCs to 4.0 ± 3 RGCs (n = 3 cells, Fig. 5c). In every case in which we attempted to classify a cell directly coupled to an F-mini RGC it was an F-mini RGC of the other type. For F-mini-ON RGC injections, all coupled cells tested by IHC were FOXP1+/FOXP2+, the molecular identity of F-mini-OFF RGCs (n = 19 cells). All coupled cells measured in live retina had the morphological signature (ventrally directed, compact, OFF-stratifying dendrites) and/or the physiological signature (primarily transient OFF with response with strong surround suppression) of F-mini-OFF RGCs15 (n = 54 cells). Similar experiments in F-mini-OFF RGCs revealed F-mini-ON RGCs verified by IHC as FOXP1-/FOXP2+ (n = 14 cells) or by physiology and morphology (n = 24 cells). Regions of dendritic contact between F-mini-ON and F-mini-OFF RGCs did not show immunoreactivity for antibodies against three connexin proteins known to exist in the inner retina, Cx36, Cx45, and Cx30.2 (Extended Data Fig. 4), so the identity of the connexin at these gap junctions remains an open question.
Figure 5. F-mini-ON and F-mini-OFF RGCs are electrically coupled to each other by gap junctions.
a, An example illustrating heterotypic network connectivity. The F-mini-OFF RGC labeled ‘0’ was filled with Alexa Fluor 488 (cyan), revealing 7 coupled somas (white). b, Cell-attached recordings from each of the labeled somas shown in a. Cells 1 through 6 show clear signs of being neighboring F-mini-ON RGCs. The soma of Cell 7 is dimmer, and is likely a second-order connected F-mini-OFF RGC. c, Distribution of the number of dye coupled cells observed in Neurobiotin and Alexa Fluor 488 cell fills of F-mini-ON and F-mini-OFF RGCs, n = 13, 3 cells. d, Average voltage traces from an RGC pair in which one F-mini RGC was injected with current (top row) and the coupled F-mini RGC of the opposite type (bottom row) showed a response. Current injections were +50 pA (lighter traces) and −50 pA (darker traces). e, Voltage change relationship across the electrical synapse in both directions for the pair in d. f, Distribution of the coupling coefficient (slope of line in e) for all recorded pairs, in control conditions (top) and in the presence of MFA (bottom). g, Example of MFA abolishing voltage deflection, showing voltage in F-mini RGCs (for −50 pA injection in coupled cell) in control conditions and in the presence of MFA (green). Image in a is a composite of a maximum projection image of the F-mini-OFF dendrites in cyan with a maximum projection image of the ganglion cell layer in white. Cell ‘0’ in b was recorded in current clamp mode. Box plots in c show maximum, 75th percentile, median, 25th percentile, and minimum.
Having found a dense heterotypically coupled network of RGCs, we sought to test for functional connectivity. We performed paired whole-cell current clamp recordings aided by 2P visualization of Alexa Fluor 488. Both depolarizing and hyperpolarizing current injections were transmitted between the coupled cells, and the resulting voltage transfer was symmetric, the hallmarks of a non-rectifying electrical synapse21 (Fig. 5d–f, p > 0.19 for both hyperpolarizing vs. depolarizing current, and injections into F-mini-ON vs. F-mini-OFF RGCs). Coupling coefficient expresses the fraction of the voltage change in one cell that is transmitted to the coupled cell. We measured a coupling coefficient of 0.14 ± 0.08 (range 0.05 – 0.31, n = 11 cell pairs) between F-mini-ON and F-mini-OFF RGCs (Fig. 5f), comparable to the strongest coupling coefficients reported in the inner retina, between amacrine cells22 (0.25) or between RGCs of the same type12 (0.14). Pharmacological block of gap junctions with meclofenamic acid (MFA)23 decreased the coupling coefficient to 0.04 ± 0.03 (n = 4 cell pairs, p = 0.0056, paired-sample one-tailed t-test, Fig. 5f,g) and also reduced noise correlations (p = 0.0068, paired-sample one-tailed t-test, Extended Data Fig. 5). While the reduction in noise correlations in MFA could, in principle, be due to a number of factors, including indirect coupling18, multiple lines of evidence (dye coupling with no intervening amacrine cells, paired recordings, and additional experiments described below) support the claim that heterotypic coupling between F-mini RGCs is direct. Thus, F-mini-ON and F-mini-OFF RGCs are not only dye-coupled, but they are also capable of passing substantial amounts of current through their gap junctions, which could potentially mix ON and OFF pathways directly at the level of the RGCs.
OFF responses in F-mini-ON RGCs arise from coupled F-mini-OFF RGCs
To determine how gap junctions with F-mini-OFF RGCs affect the light responses in F-mini-ON RGCs, we sought to measure light responses from the same F-mini-ON RGCs with and without coupling. We used two different manipulations to uncouple F-mini-ON RGCs from their electrical network: pharmacological gap junction block with MFA and physical ablation of coupled RGCs.
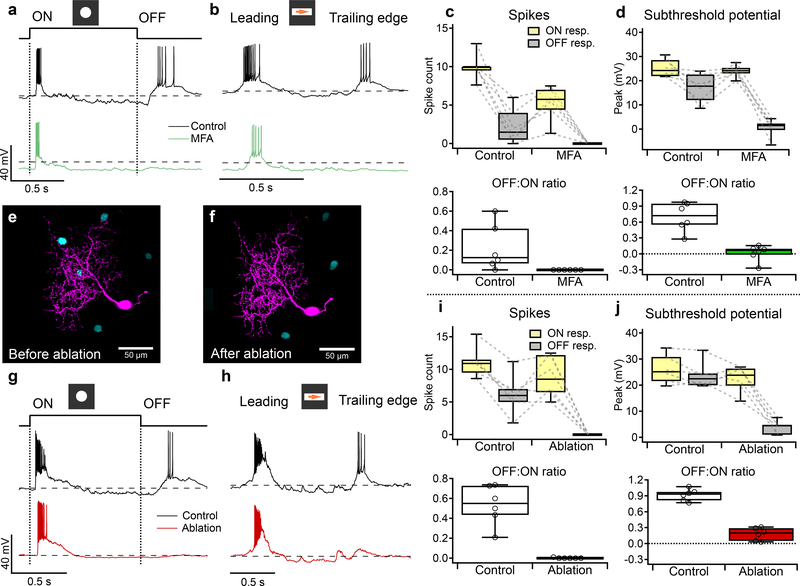
Our first strategy to isolate F-mini-ON RGCs from their coupled network used MFA, which decreases gap junction coupling (Fig. 6f,g). We recorded from F-mini-ON RGCs in current-clamp mode and stimulated the retina with positive contrast spots and moving bars (Fig. 6a,b). We bath applied MFA and observed that the OFF responses were selectively decreased (all mean ± SD, n = 6 cells, paired-sample one-tailed t-tests). We compared OFF:ON ratio in these RGCs and found that MFA selectively decreased OFF responses. The OFF:ON spiking ratio decreased from 0.22 ± 0.24 to 0.00 ± 0.00 (p = 0.034, Fig. 6c). The OFF:ON subthreshold peak response ratio decreased from 0.70 ± 0.27 to 0.02 ± 0.15 (p = 0.0011, Fig. 6d). In order to evaluate the effect of MFA on the ON pathway, we compared ON responses before and after MFA. The ON spiking decreased from 10.0 ± 1.73 to 5.29 ± 2.23 spikes (p = 0.0074, Fig. 6c). The ON subthreshold peak responses did not decrease from 25.2 ± 3.69 to 24.0 ± 2.52 (p = 0.28, Fig. 6d). The reduction in ON spike count despite an unchanged light-evoked depolarization can be attributed to a hyperpolarizing baseline shift (from −61 ± 2.37 mV in control to −66.2 ± 5.64 mV in MFA, p = 0.011), likely caused by nonspecific effects of MFA24,25. Non-F-mini RGCs showed a moderate reduction of spiking in MFA, consistent with reduced contrast sensitivity24, but the ON and OFF pathways were affected similarly (n = 3, p > 0.05 in all cases, Extended Data Fig. 6).
Figure 6. F-mini-ON RGCs receive ON input from chemical synapses and OFF input from electrical synapses.
a, Response of an F-mini-ON RGCs to an ON 120 μm spot before (black) and after MFA (green) application. Dashed line is −60 mV. b, Responses of the cell in a to a moving positive contrast bar before (black) and after MFA (green) application. c, (upper) Population data for F-mini-ON RGC spike responses to flashed spots as in a (n = 6 cells). Points connected by dotted lines are individual cells. (lower) OFF:ON ratio of in control and MFA conditions. d, Same as c for peaks of subthreshold voltage responses (n = 6 cells). e,f, Image of a recorded F-mini-ON RGC (magenta) before and after ablation of 3 of the coupled somas (cyan). g, Responses of an F-mini-ON RGC to an ON 120 μm spot at 2000 R*/rod/s before (black) and after ablation (red) of coupled somas. Dashed line is −60 mV. h, Responses of a different cell to a moving ON bar at 700 R*/rod/s before (black) and after ablation (red). i, (upper) Population data for F-mini-ON RGC spike responses to flashed spots as in c (n = 6 cells). (lower) OFF:ON ratio in control and ablation conditions. j, Same as i for subthreshold membrane voltage (n = 6 cells). Box plots in c,d,i,j show maximum, 75th percentile, median, 25th percentile, and minimum.
Our second strategy to isolate F-mini-ON RGCs from their coupled network used physical ablation26, which had the advantage of increased specificity. Using Alexa Fluor 488 fluorescence under 2P illumination, we were able to visualize the F-mini-OFF RGCs coupled to a targeted F-mini-ON RGC. In the ablation procedure, we recorded responses to positive contrast spots and moving bars in F-mini-ON RGCs (Fig 6g,h) in current-clamp mode before and after destroying the coupled cells by membrane rupture with sharp microelectrodes (Fig. 6e,f showing partial ablation; in general all connected cells were ablated). We compared OFF:ON ratio in these RGCs and found that ablation selectively decreased OFF responses (all mean ± SD, n = 6 cells, paired-sample one-tailed t-tests). The OFF:ON spiking ratio decreased from 0.53 ± 0.20 to 0.00 ± 0.00 (p = 0.00062, Fig. 6i). The OFF:ON subthreshold peak response ratio decreased from 0.92 ± 0.11 to 0.18 ± 0.12 (p = 0.000013, Fig. 6j). In order to evaluate the effect of ablation on the ON pathway, we compared ON responses before and after ablation. The ON spiking decreased slightly from 11.1 ± 2.35 to 8.87 ± 3.15 (p = 0.06, Fig. 6i). The ON subthreshold peak responses decreased slightly from 26.1 ± 5.53 to 22.5 ± 5.12 (p = 0.043, Fig. 6j). The reduction in ON responses is significant but small, and might be caused by a decrease in 2nd order connectivity, that is, input current from F-mini-ON RGCs connected through neighboring F-mini-OFF RGCs.
Results from both approaches demonstrated that F-mini-ON RGCs receive ON input through canonical chemical synaptic pathways and receive OFF input through a non-canonical pathway involving gap junctions with F-mini-OFF RGCs.
The spatial arrangement of coupled F-mini-RGCs and their dendritic fields can account for the ON-OFF RF offset in F-mini-ON RGCs
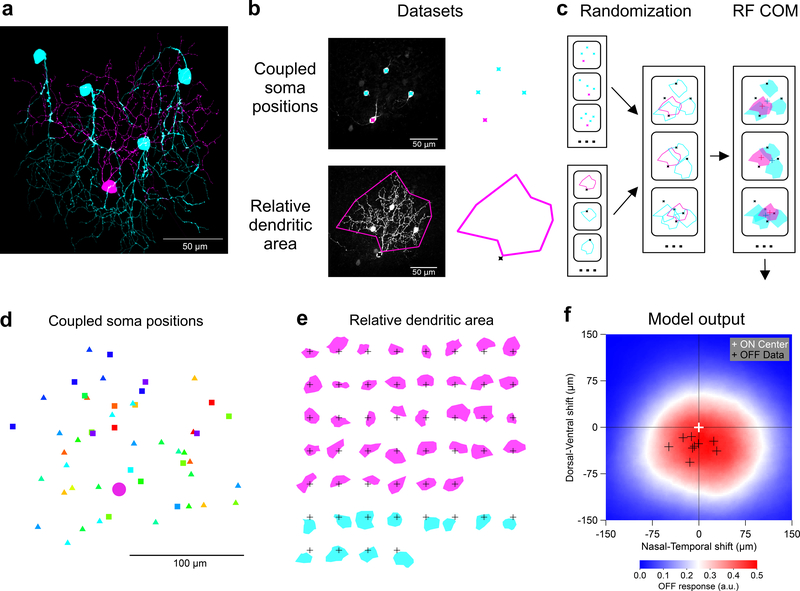
With this knowledge of the different circuits responsible for the ON and OFF components of the RFs of F-mini-ON RGCs, we returned to our observation of the spatial offset between the ON and OFF RF subfields in search of a mechanism. The distinctive asymmetric morphology and connection pattern of F-mini RGCs offered an important clue. In the ventral and central retina where we performed our measurements, F-mini-ON RGCs have dorsally directed dendrites, and F-mini-OFF RGCs have ventrally directed dendrites, relative to their somas15. We also observed in F-mini-ON RGCs that coupled soma positions were located dorsally to the filled soma. Using confocal microscopy images of dye-filled F-mini-ON RGCs, we observed that their dendrites generally lie dorsally to the dendrites of coupled F-mini-OFF RGCs (Fig. 7a). A measurement of this offset could explain the offset RF position. However, the dendritic tips of coupled cells are generally not well filled by intracellular dye, so single cell fills are not well suited for this measurement, and complete fills by manual dye filling is experimentally prohibitive. So, we sought to model this combined dendritic offset using accessible imaging morphology datasets (Fig. 7).
Figure 7. F-mini-ON RGCs RF offset is captured by a morphological model.
a, Traced microscope image from an experiment in which a single F-mini-ON RGC (magenta) was filled with Neurobiotin. Four coupled F-mini-OFF RGCs are in cyan. A spatial offset is apparent in the dendritic arbors of the two cell types relative to the soma of the F-mini-ON. b, Diagram of the imaging datasets used in the morphological model, described in d and e. c, RF model diagram (see Methods). Measurements of F-mini-ON coupled soma positions in d were randomly combined with convex polygon fits to the dendrites of F-mini-ON and F-mini-OFF RGCs in e, to create a purely anatomical prediction of the center-of-mass (COM) offset of ON and OFF RFs (red and blue crosses). d, Locations of labeled somas relative to the injected F-mini-ON RGCs (magenta circle) included both confirmed F-mini-OFF RGCs (squares) and RGC somas that were not further characterized (triangles) (n = 50 somas, 13 injected cells, colored by injected cell) Each point represents the position of a gap-junction labeled soma relative to the position of the filled F-mini-ON RGC. Results above suggest that all coupled cells were in fact F-mini-OFF RGCs, but only some of them (squares) were confirmed via electrophysiology or IHC. e, Area of dendrites relative to soma position for the measured population of F-mini-ON and F-mini-OFF RGCs (n = 38, 12 cells). Soma locations are marked by 50 μm crosses. f, Result from the model. Colored surface is mean OFF RF relative to the centered ON RF. True F-mini-ON RF offset data (black crosses) and format are from Fig. 2g.
To construct this model, we created two datasets. For each dye-filled F-mini-ON RGC, we measured the positions of neighboring brightly-labeled (1st order) connected somas (Fig. 7d, n = 50 coupled soma position from 13 injected F-mini-ON RGCs). Next, for both F-mini-ON and F-mini-OFF RGCs, we measured a polygon around the dendrites within their ON and OFF layer stratifications, respectively (Fig. 7e, n = 38, 12 cells). With the knowledge that the neighboring somas were F-mini-OFF RGCs, we could combine these datasets. We randomly generated combinations of measured soma offsets, F-mini-ON polygons, and F-mini-OFF polygons (Fig. 7c). The resulting ON to OFF RF subfield center of mass offset was on average 26 μm ventral (Fig. 7f), similar to the shift we measured in F-mini-ON RGCs (Fig. 2g, −30 ± 13 μm). This result demonstrates that the spatial structure of the F-mini RGC network is sufficient to account for the ON-OFF RF offset we observed in F-mini-ON RGCs.
The RF structure of F-mini-ON RGCs can account for their weak direction and orientation selectivity
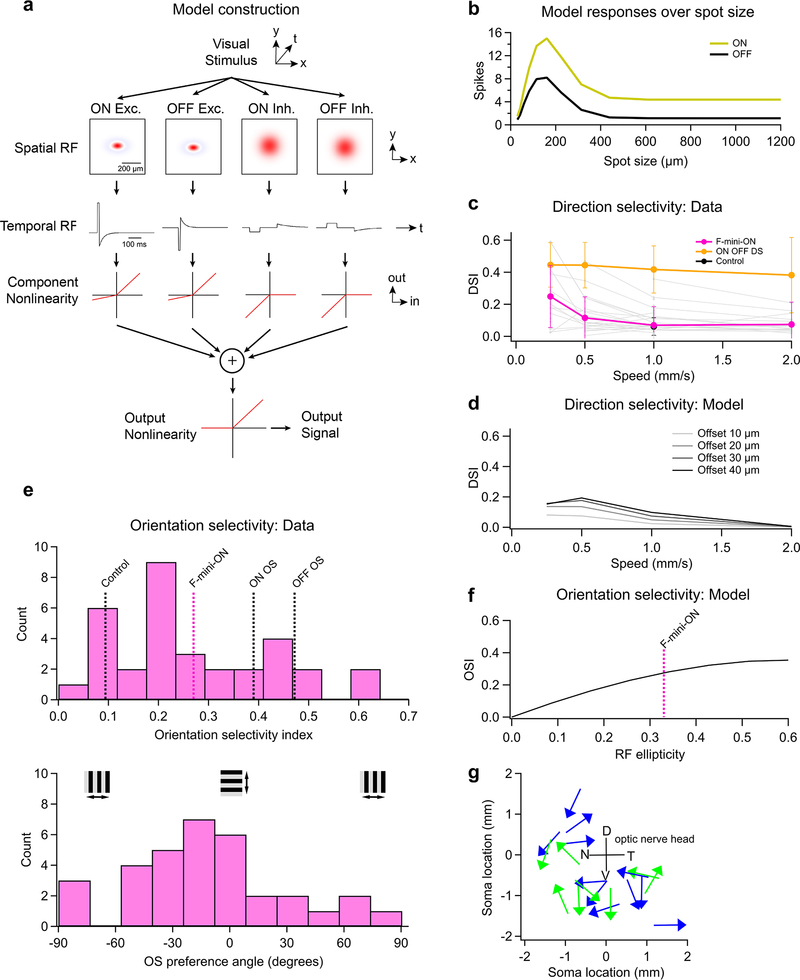
What visual features are represented by an RF structure with offset ON and OFF sub-regions? We first tried to answer this question at the level of single RGCs using a model that captured both the spatial structure of the ON-OFF RF center of F-mini-ON RGCs and suppression by their RF surround (Extended Data Fig. 7a,b, see Methods). The search for a component of visual stimulus space that is encoded by an RGC type has many avenues. Direction selectivity, which is an asymmetry in response spike count or rate with visual motion direction, has been reported in F-mini-ON RGCs15. We also measured mild direction selectivity in F-mini-ON RGCs only for slowly moving stimuli, a behavior the model replicated (Extended Data Fig. 7c,d). Direction preference was broadly distributed with no apparent relationship to retinal position (Extended Data Fig. 7g). We also found mild orientation selectivity in F-mini-ON RGCs with the presentation of drifting gratings (Extended Data Fig. 7e). In a version of our single-cell model that matched the axis of elongation of the F-mini-ON RFs, we were able to predict a similar degree of orientation selectivity to our measurements (Extended Data Fig. 7f). However, neither of these properties provides a satisfying explanation for this unique RF structure, since other specialized RGCs encode movement direction27 and orientation28,29 with much greater specificity and robustness over parameters like speed (Extended Data Fig. 7c,e).
A multi-cell model of F-mini-ON RGCs demonstrates that systematic ON-OFF offset RFs can aid in the encoding of edge position
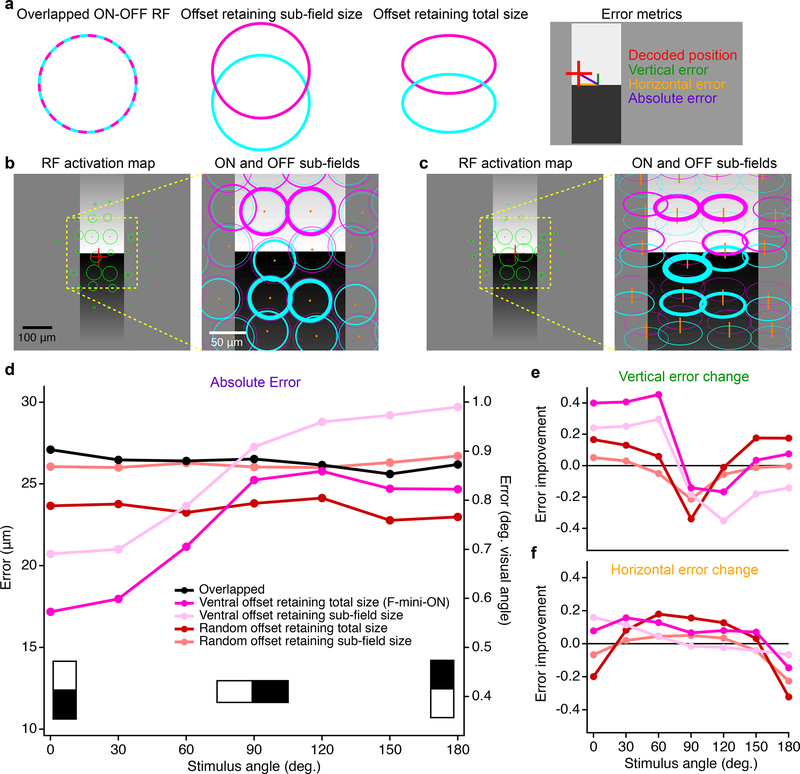
Next we constructed a multi-cell model to explore whether offset ON-OFF RFs could provide an encoding benefit in the population that is less apparent at the single-cell level. Specifically, we tested whether a population of RGCs with consistently offset ON-OFF RFs is more precise in representing the position of a dark-light edge than a population of RGCs with either overlapping ON-OFF RFs or with randomly offset RFs (Fig. 8). Our model used (1) overlapped ON and OFF RFs, (2) larger RFs resulting from offsetting the same ON and OFF subfields, or (3) RFs with the same overall size, but with offset ON and OFF subfields, as we measured in F-mini-ON RGCs (Fig. 8a). The two offset models used either a consistent ventral offset between ON and OFF subfields or a random distribution of offset directions, consistent with our measurements from F-mini-ON and control ON-OFF RGCs, respectively (Fig. 2d,e). All other aspects of the five models were identical. We presented our five RF models with edge stimuli at various orientations and spatial locations to generate a response lookup table for each.
Figure 8. Multi-cell model of object localization shows an advantage of offset ON-OFF RFs.
a, Schematics of the different RF structures and error metrics. b, RF activation map (left) for a single instantiation of the overlapped RF model. The stimulus is the black-white edge. Green circles show the positions of each RGC with the radius of the circle proportional to its response. Red cross indicates the center of mass of the RGC responses. Magnified portion (right) shows the ON (magenta) and OFF (cyan) subfields of each RF. Line thickness is proportional to activation of each subfield. c, RF activation map for the same positions and stimulus as in b, but for the offset RF model retaining total size. Orange lines in the magnified view (right) connect ON and OFF subfields from the same RGC. d, Absolute error in decoded edge position for each model. Points are means of 500 iterations of each model with different RGC and stimulus positions. Error bars for SEM are obscured by symbols; SD was similar for each point with a mean of 0.42 μm. e, Vertical component of the error in d shown as a change ratio relative to the overlapped RF result. f, Same as e for the horizontal component.
To generate a population of RGC responses, we simulated many of the above RGCs simultaneously. Positions of cells were generated as a noisy hexagonal grid based on the measured density of F-mini-ON RGCs8 (250 cells in an area of 1 mm2). Gaussian noise with a magnitude consistent with our spike data from F-mini-ON RGCs was added to each response. In each instantiation of the multi-cell model, the random seeds that defined position jitter and response noise were varied. To evaluate performance, we created a simple position decoder on the output responses of the model cell population (see Methods). We computed the decoded position as the center of mass of the RFs from model RGCs responding over a cutoff threshold (8 ± 1.5 cells, mean ± SD) with each RGC weighted by its response strength. Error was measured as the distance between decoded position and the true stimulus center.
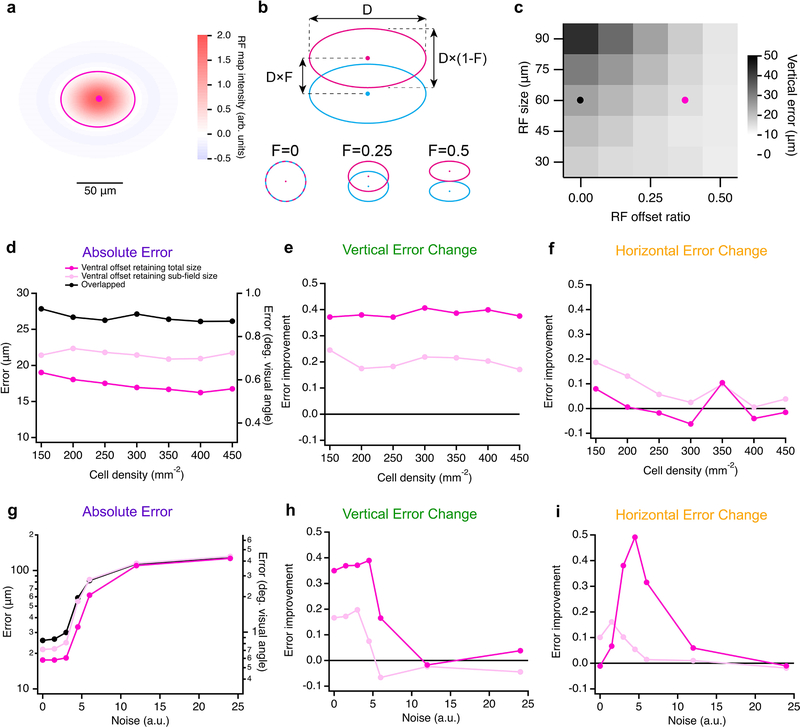
RGC models having offset ON-OFF RFs with consistent direction had lower error than those with overlapped or randomly offset RFs in representing the position of an edge stimulus (Fig. 8d–f). Along the (vertical) axis of separation of the RF subfields, F-mini-ON RGC model was 40% better than the overlapped RF model at representing the position of horizontal edges (Fig. 8d), particularly the vertical component perpendicular to the edge (Fig. 8e). This improvement came with no decrease in horizontal position decoding performance (Fig. 8f), but with a tradeoff in performance for edges having a contrast offset perpendicular or opposed to the RF offset. The F-mini-ON RGC population model was able to represent the position of an edge with precision down to 0.6 degrees of visual angle (Fig. 8f), less than 12% of the (2 sigma) RF diameter of a single F-mini-ON RGC. The improvement of the offset models relative to the overlapped RF model was robust across a broad range of cell densities, RF sizes, and noise amplitudes (Extended Data Fig. 8).
Discussion
Collectively, our results demonstrate that the F-mini-ON RGC mixes a canonical ON input via chemical synapses with a non-canonical OFF input via gap junctions with F-mini-OFF RGCs to create an RF with spatially offset ON and OFF subfields. The offset is consistent with the asymmetric morphology and connectivity of F-mini RGCs (Fig. 7). Our multi-cell model shows that the ON-OFF RF offset can improve the precision with which F-mini-ON RGC populations represent the position of an edge (Fig. 8). A causal link between this proposed role in encoding edge location and a specific behavior will require selective genetic access to F-mini RGCs. With advances in molecular profiling of RGCs9, the tools for such a study are on the horizon.
This report follows on the work of several groups investigating both of these RGC types in the mouse. Descriptions of their electrophysiological responses to visual stimuli have varied in approach and findings. In the Eyewire dataset, Bae et al. found both ON and OFF calcium responses in F-mini-ON RGCs to a moving bar8. The F-mini-OFF is labeled in the PVCre mouse line (type PV7)30. Using that line, Farrow et al. found both ON and OFF responses to small spots in F-mini-OFF RGCs31. Working with a Fox2Cre mouse line, Rousso et al. identified only primary polarity responses in F-mini RGCs15. Though we found the ON-OFF responses to be robust across a range of light levels and contrasts (Fig. 1j,k), differences in light adaptation state or other recording conditions may have caused this discrepancy.
Heterotypic RGC coupling was also recently identified in the guinea pig using multi-electrode array recordings and morphological tracing with Neurobiotin32. The coupled RGCs in the guinea pig study were both ON sustained cells – one of them was the ON alpha – so heterotypic coupling in that system does not mix ON and OFF signals. Nonetheless, the discovery of heterotypic RGC coupling in two different circuits in two different species suggests that it might be a conserved motif in the mammalian retina, augmenting our understanding of the organization of information in RGC populations.
Notably, F-mini-ON RGCs are bistratified despite the fact that we found no evidence of OFF bipolar cell input. Perhaps the OFF dendritic stratum is used primarily for making gap junctions with F-mini-OFF RGCs or chemical synapses with amacrine cells. This adds to a growing list of RGC types with dendrites in the outer half of the IPL with no apparent OFF bipolar cell input: sustained suppressed-by-contrast26, ON delayed33, ON orientation selective (both horizontal and vertical)28, OFF orientation selective (horizontal and vertical)29 and M1 intrinsically photosensitive RGCs34. The size of this list suggests a re-evaluation of the dogma that the stratification of an RGC alone is sufficient to predict the polarity of its bipolar cell inputs.
Recent work has shown that mice use vision to capture small, quickly moving prey objects, like crickets35,36, so perhaps precise edge localization with F-mini-ON RGCs plays a role in this behavior. While our multi-cell model used flashed stimuli, a similar mechanism could, in principle, aid in the precise localization of moving objects by the joint firing of coupled F-mini-RGCs. Direct electrical coupling between RGCs has long been known to be important for synchronizing spikes on the timescale of several milliseconds37–39, and tight spike synchrony has been shown to enhance transmission at retino-geniculate synapses40. Synchronous firing among RGCs has been proposed as a mechanism for improving the fidelity of the population code for direction selectivity41 and binding objects across space18. Precise timing between the spikes of coupled RGCs has recently been proposed as a mechanism for object localization with resolution much higher than predicted by the RF size of a single RGC42. Estimating the position of a moving object is, of course, a more complex computation because neural lag can be conflated with object speed. A subset of direction-selective RGCs uses homotypic gap junctions to help normalize this lag12,19. Simultaneous recordings from larger populations of F-mini RGCs could test our model for localization of static edges (Fig. 8) and reveal whether this network could play a role in the localization of moving objects.
Since the RF offset in F-mini-ON RGCs is along the vertical axis, our model showed enhanced object localization preferably along this axis (Fig. 8). It will be interesting to see whether future behavioral experiments reveal that mice show more precise object localization along the vertical than the horizontal axis of the visual field. Since rodents use compensatory eye movements to maintain the orientation of their eyes relative to the horizon43, a potential advantage of precise localization along the vertical axis is that it would provide information about changes in distance: approaching objects have increasing space between their dorsal and ventral edges with time, while receding objects have decreasing space. The direction of the ON-OFF asymmetry is also interesting as it relates to rodent visual ethology. Dark-below-light edges in retinal space were represented best by our model F-mini-ON RGC population (Fig. 8d). This corresponds to dark-above-light edges in visual space, consistent with the special behavioral relevance of “looming” dark objects in the upper visual field44.
The dynamics of the F-mini RGC network are another target for future studies. The strength of gap junctions in the retina, including those between RGCs, can be altered by neuromodulators17,20,45. If the F-mini RGC network is modulated, this could change its function with sensory or behavioral context. Finally, comparisons with other species will provide information about the evolution and function of this particular heterotypically-connected RGC circuit. FOXP2 is also found in a subset of RGCs in the ferret46 and macaque retinas15, so it is possible that the F-mini RGC circuit has a homolog in humans.
Methods
Animals and electrophysiology.
The retinas of wild-type mice (C57BL/6J, Jackson Labs) were used for all experiments. The mice were dark adapted overnight and euthanized by cervical dislocation in accordance with all animal care standards provided by Northwestern University’s Institutional Animal Care and Use Committee. Lighting in animal facilities was kept on a 14/10 hour cycle, with lights on at 6:00 am. Typical retina in vitro times were 12:00 pm through 7:00 pm. For all experiments, mice of either sex (approximately 69% male), and ages P30-P90 were used; no differences in results were observed with sex or age. Eyes were dissected in oxygenated Ames medium at 32°C. Dissections were performed in complete darkness using infrared (IR, 900 nm) illumination and photo converters. In the experimental rig, retinas were mounted in a shallow dish, below a microscope objective and above a digital projector, in oxygenated Ames’ medium from Sigma-Aldrich (A1420) at 32°C at a flow rate of 10 ml/min. Two glass electrodes on headstage amplifiers were mounted on micromanipulators on either side. Cell-attached and current clamp experiments were performed as previously described26.
Microscopy.
Two microscopes were used to visualize cell morphology. The in vitro microscope, a Scientifica SliceScope Pro 6000, used 980 nm illumination from a SpectraPhysics MaiTai Laser steered by a galvo scanner for 2P excitation and IR visualization. Software was SciScan version 1.5 by Scientifica in LabVIEW by National Instruments. Dyes for two-photon visualization were Alexa Fluor 488 and 568 Hydrazide from Invitrogen (A10436, A10437), the latter of which was found to be not gap junction permeable and was used for single-cell image isolation. Microscopy was continued on fixed retinas, which were stained with antibodies and fluorescent dyes for immunohistochemistry. The fixed-tissue microscope was a Nikon A1R confocal microscope with a 1.0 NA 40x oil immersion objective at the Northwestern Center for Advanced Microscopy. In Fig 1a–c and 7a, neurons were traced using Simple Neurite Tracer47 in ImageJ/Fiji. Stratification analysis in Fig. 1c used ChAT layers to computationally flatten traced neural morphology. In Fig. 4 individual image channels from confocal microscopy were contrast adjusted and despeckled with a 3×3 median filter to improve clarity, then max-intensity projected through 7 μm of depth.
Light stimulation.
Spatio-temporal light patterns were focused on the photoreceptors of the in vitro retina.The light patterns were generated by a computerized digital display, a DLP Lightcrafter 4500 from Texas Instruments, illuminated by a blue LED at 457nm (peak wavelength after optics), integrated by EKB Technologies Ltd. It had a resolution of 1140 × 912 pixels, operating at 60 Hz, frames modulated to 8 bits intensity depth. Overall light intensity was modulated using neutral density filters (Thorlabs) and calibrated regularly. Measured intensity values were converted to rhodopsin isomerizations per rod per second (R*/rod/s). Light stimuli were generated by MATLAB software packages: Schwartz Lab protocols (https://github.com/Schwartz-AlaLaurila-Labs/sa-labs-extension) interfacing with the Symphony 2 Data Acquisition System (https://symphony-das.github.io) drawing via Stage (http://stage-vss.github.io) and OpenGL to the screen. The microscope’s condenser brought the projector image to focus at the photoreceptor outer segments at a scale of 1.38 μm/pixel. Stimuli included circles (30 – 1200 μm in diameter) flashed with positive or negative contrast for 1.0 s, moving bars (140 – 1200 μm width by 600 – 1200 μm length, at 250 – 2000 μm/s speed), and small spots for RF mapping (see below). Stimulus for the light stimulation cross correlation analysis was a randomly moving light spot 80 μm diameter, 30 sec duration. The random motion path was a zero-centered 2D gaussian noise signal, lowpass filtered at 3 Hz cutoff frequency. Light stimuli were presented from darkness (< 2 rod isomerizations R*/rod/s) to a level of 200 R*/rod/s unless otherwise noted, in order to preserve the sensitivity of the retina.
Receptive field mapping.
Current-clamp recordings allowed us to measure subthreshold voltage responses with small spots to obtain high resolution RF maps. Visual stimulus spots were circles of positive and negative 100% contrast on a background of 1000 R*/rod/sec, with a diameter of 40 μm. A triangular grid of 30 μm spacing was used for F-mini RGCs. Larger spacing and spot sizes up to 80 μm were used for RGCs with larger RFs and lower sensitivity to small spots. Voltage responses to individual spots were separated and peak values were averaged to generate a value for each position. These values were displayed on the grid locations to create a 2D RF strength map. The center of mass of the map area above the 80–85th percentile of response strength was used to generate offset vectors for comparison to the model. The RF overlap index (Fig. 1k) uses the proportion of overlap relative to the total of the RF area within the 80th percentile of response strength. Control ON-OFF RGCs were of types UHD, HD2, and ON-OFF DS, which exhibit similar ON-OFF transient responses to small spots.
Cell identification.
Somas in the ganglion cell layer were surveyed in cell-attached mode using a set of basic light stimuli: flashing contrast steps in 160 μm spots, spots of varying sizes, and moving bars. F-mini RGCs could be identified by their characteristic responses to these stimuli. Once an F-mini RGC was identified, it was dye filled and recorded to verify type and collect data. Pairs were generally identified sequentially: (1) Identify F-mini-ON/OFF RGC by its light response, (2) fill with Alexa Fluor 488, confirming typology by morphology, (3) use dye to find coupled F-mini-OFF/ON RGCs, (4) patch and record original and dye-filled cells. Sequential filling of coupled F-mini RGCs with Alexa Fluor 488 allowed for identification of large networks of > 10 cells. Neurobiotin in a single F-mini RGC labels second order connected cells more dimly than first order ones, in fixed tissue, allowing for similarly large network identification.
Pharmacology.
Meclofenamic acid (MFA) from Sigma-Aldrich (M4531) was bath-applied at 100 μΜ to block gap junctions23 (Figs. 2, 3, Extended Data Figs. 5, 6). Electrophysiology results in MFA conditions were 5 through 45 minutes during application. MFA washes out incompletely, so no post-application data is reported.
Ablation.
Neighbor ablation is a physical technique for neuronal inactivation where a micropipette is used to rupture the cellular and nuclear membranes of the dye-illuminated somas26. This causes the membrane of the entire cell to dissociate, and stops it from having a membrane potential or transmitting and receiving signals within the dendrites. Neuron death was confirmed by lack of Alexa Fluor 488 in 2P imaging. Some responses continued for one stimulus epoch before being silenced. Where incomplete network ablation occurred, changes to response properties were partial. These data were not used further.
Immunohistochemistry.
Target neurons were filled with Neurobiotin from Vector Laboratories (SP-1150) 3% w/v and 280 mOsm in our standard potassium aspartate internal solution26. For whole mount immunohistochemistry (IHC), post-in vitro retinas were fixed in 4% paraformaldehyde for 15 minutes, then rinsed in phosphate buffer. Primary antibodies for cell typology were FOXP1 to guinea pig (1:10,000) from Prof. Bennett Novich48 and FOXP2 to rabbit (1:200) from Millipore (ABE73)49. Primary antibodies for connexin typology were Cx30.2 to rabbit (1:50) from Invitrogen (40–7400)50, Cx36 to rabbit (1:250) from Invitrogen (51–6200)51, and Cx45 to mouse (1:200) from Invitrogen (41–5800)52. Retinas were soaked with primary antibodies in normal donkey serum (NDS) + Triton X-100 from Sigma-Aldrich (T8787) for 3 days at 4°C. Secondary antibodies/fluorophores were (for typology) donkey anti-rabbit Alexa Fluor 568 (1:500) from Life Technologies (A10042), goat anti-guinea pig Alexa Fluor 647 (1:400) from abcam (ab150187), (for connexins) donkey anti-rabbit Alexa Fluor 568 (1:500) from abcam (ab175470), donkey anti-rabbit Alexa Fluor 647 (1:500) from Jackson ImmunoResearch (711–605-152), donkey anti-mouse Cyanine Cy3 (1:500) from Jackson ImmunoResearch (715–165-150), and (for both) Streptavidin DyLight Conjugate 488 (1:500) from Thermo Science (21832). Retinas were soaked in secondary antibodies in NDS + Triton X-100 for one day at 4°C. Retinas were mounted on glass slides in Fluoromount Aqueous mounting medium from Sigma-Aldrich (F4680) and stored at −20°C.
Stratification offset analysis.
Offsets are measured as a vector from proximal/inner COM to distal/outer COM, which in most RGCs is ON to OFF dendrites. Mean and SD are shown by red crosses. All figure data is from the Eyewire dataset8, exported via the Eyewire museum mesh tool. Meshes were flattened and offset by eye.
Morphological receptive field model.
Two types of datasets were used. Receptive fields relative to soma location of F-mini-ON and F-mini-OFF RGCs were estimated using the area between the tips of the dendritic fields (n = 38 F-mini-ON cells, n = 12 F-mini-OFF cells). These were outlined manually using 2P or confocal image stacks. Locations of F-mini RGCs in coupled networks were traced from images of dye-filled somas to create maps of soma locations (n = 11 networks). Random combinations of network soma locations, F-mini-ON dendrite offsets, and F-mini-OFF dendrite offsets were generated 5000 times and averaged to generate a mean OFF RF relative to ON RF (Fig. 7f). The model ignores any possible interdependence of F-mini-ON and F-mini-OFF RGC dendritic fields (meta-mosaics), and assumes that F-mini-OFF RGCs receive OFF input via bipolar cells at their dendritic tips.
Single-cell RF model.
A computational model (Extended Data Fig. 7a) was used to generate single cell responses to an edge, moving bar, and drifting grating stimulus. The model simulated four pathways of input to a single RGC: ON and OFF, excitation and inhibition for each. Excitation was modeled as a small 2D gaussian of direct excitation with a larger 2D gaussian subtracted to model presynaptic inhibition. Direct inhibition was modeled as a larger 2D gaussian. The visual stimulus was multiplied by the spatial RFs, then those signals were integrated across space and temporally filtered by convolution. Temporal filter kernels were parameterized curves with values extracted from typical F-mini-ON voltage-clamp light-step responses, over a 3.0 sec simulation time. A semi-rectifying nonlinearity was applied to each ON and OFF subfield, then the responses were summed. OFF delay relative to ON was estimated from spike latencies. RF sizes and surround strength was adjusted manually to match F-mini-ON responses to spots of multiple sizes. This model is meant to explore RF map concepts analytically over many variables, and is not meant to precisely emulate recorded RGCs.
Multi-cell decoding model.
The multi-cell model composed responses from many single-cell RF instances and decoded them using their center-of-mass. Gaussian noise was added to each modeled cell’s response. The decoded location of the stimulus was compared to the true location to generate an error value. Trials of randomly placed cells and stimulus were used, with 500 trials for each parameter configuration. Cells RF centers were laid out on an equilateral triangular grid with a gaussian jitter of 10 μm sigma. Receptive field strengths were integral normalized across shape parameters. Comparisons across parameters used a density of 250 RGCs/mm2, noise of 2 (arbitrary units, but similar to spiking output), and a stimulus angle of 0 (horizontal, ON upper). RGC responses fell to baseline outside of the model region, which had an area of 0.36 mm2 with 600 μm side length. The stimulus was placed randomly uniformly within the central 300 by 300 μm square region. The edge stimulus was a 150 μm length edge of positive and negative 100% contrast, falling off in a linear gradient above and below the edge for 150 μm. Cells with responses above 30% of the highest response (8 cells ± 1.5 SD) were used to decode the position. Rousso et al15 found a range of densities of between 100 and 350 RGCs/mm2 for F-mini-ON RGCs. Eyewire museum’s patch of retina, the E2198 dataset8, has a density for F-mini-ON RGCs (anatomical type 63) of approximately 240 RGCs/mm2. Decoder input cell threshold was 0.3 times the highest response, resulting in 8.5 ± 1.5 SD RGCs at the default parameters.
Analysis and statistics.
Analysis was performed with a custom MATLAB software package. Figures were generated in Igor 8.0 from Wavemetrics. Visual and electrical stimulus code is available at https://github.com/Schwartz-AlaLaurila-Labs/sa-labs-extension and https://symphony-das.github.io. All data are reported as mean ± standard deviation (SD) unless otherwise noted. No statistical methods were used to pre-determine sample sizes but our sample sizes are similar to those reported in previous publications1,15,19,20. In general, data distribution was assumed to be normal but this was not formally tested; data points are shown on figures. Data collection was not randomized due to the nature of the experiments. Data collection and analysis were not performed blind to the conditions of the experiments. Cells were excluded from analysis if confidence in typology was insufficient. All data points shown are individual retinal ganglion cells or cell pairs presented as the mean of three or more repeated stimulus presentations. Box plots in figures show maximum, 75th percentile, median, 25th percentile, and minimum. Comparisons for statistical significance were performed with a paired or unpaired Student’s t-test, as appropriate, unless otherwise noted. All t-tests p-values are evaluated at the 95% confidence interval. Direction and orientation selectivity indices were calculated as the normalized magnitude of the vector sum of the responses across directions or orientations. For measurements of connexin overlap, RGCs were traced using Simple Neurite Tracer in Fiji software. Receptive field ellipticity was measured using the 80th percentile response contour, finding the longest line contained within that (a), then the longest such line perpendicular to that line (b). The ellipticity is then lengths (a - b)/a. Subthreshold membrane potential measurements (RF maps and Fig. 6d,j) were normalized to a prestimulus baseline mean value and used a spike-removal lowpass filter of 100 Hz cutoff frequency.
Code availability.
Software code for the analyses supporting the findings of this work are available at https://github.com/SchwartzNU/ProjectData_Fmini.
Data availability.
Data for ganglion cell typology in the mouse is available at http://RGCTypes.org. A subset of the datasets that support the findings of this study are available at https://github.com/SchwartzNU/ProjectData_Fmini. The remainder of the datasets are available from the corresponding author upon reasonable request.
Extended Data
Extended Data Fig. 1. Coupled cells are immunoreactive for F-mini RGC markers.
Images of the ganglion cell layer in a patch of retina in which a single F-mini-ON RGC was filled with Neurobiotin (magenta arrowhead). Left panel shows the Neurobiotin channel, with three brightly labelled coupled cells (white arrowheads) and three dimly labelled cells that likely represent second-order connections (magenta asterisks). Middle panel shows the same region with immunoreactivity for FOXP1, which labels F-mini-OFF RGCs, but does not label F-mini-ON RGCs15. Right panel shows immunoreactivity for FOXP2, which labels both F-mini RGC types. This experiment was performed on five F-mini RGC networks in four retinas: four F-mini-ON RGCs and one F-mini-OFF RGC injected. Three networks were stained for FOXP2 and FOXP1; two networks for FoOXP2 only. Neurobiotin labeled 9.0 ± 6.4 somas per retina, and was found in varying amounts in neurons; indicating first and second order connectivity. FOXP2 was present in 43 of 45 RGCs that were labeled with Neurobiotin. Coupled cells from these networks that could be morphologically identified by using the visible primary dendrites, and all showed the expected patterns of FoxP1 expression. 8/8 F-mini-ON RGCs were FOXP1 negative and 14/14 F-mini-OFF RGCs were FOXP1 positive.
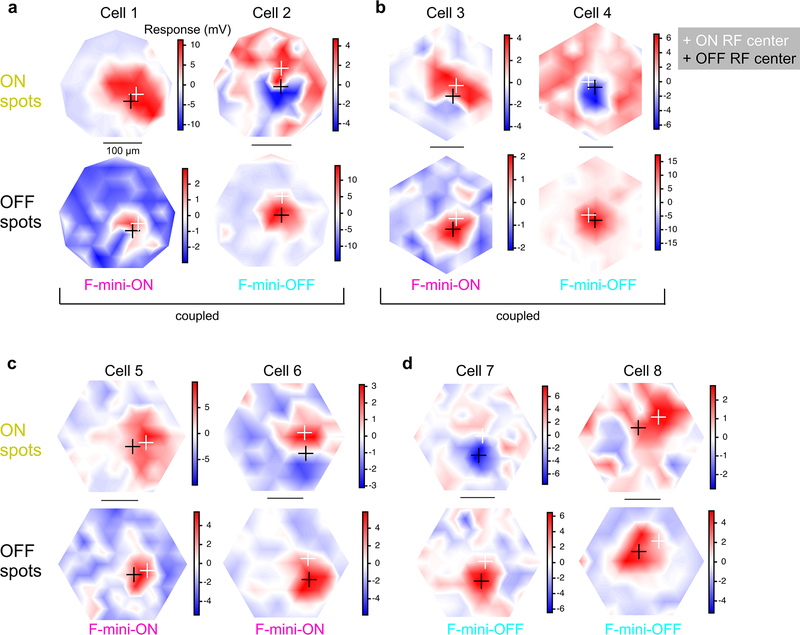
Extended Data Fig. 2. Example RF maps from F-mini-ON and F-mini-OFF RGCs.
Receptive field maps of peak response to 40 μm flashed spots over the RF area, averaged over 2 or 3 repeats. a, A GJ coupled F-mini-ON and F-mini-OFF recorded simultaneously. b, Another such RGC pair. c, Two unconnected F-mini-ON RGCs. d, Two unconnected F-mini-OFF RGCs. On all plots, the cross markers are at the center of mass of responses over the 80th percentile (ON, white; OFF, black). Color scale is in mV change from baseline. All scale bars are 100 μm.
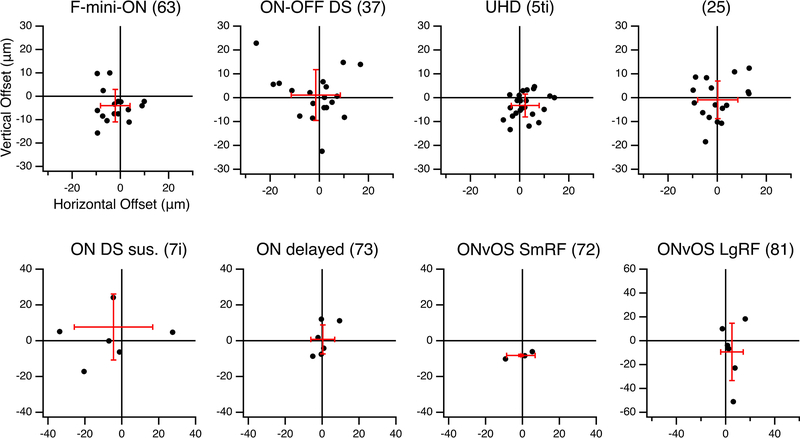
Extended Data Fig. 3. Alignment between ON and OFF strata of bistratified RGCs.
Offset values in μm from each bistratified RGC in Eyewire by type, followed by Eyewire anatomical type name in parentheses. Offsets are measured as a vector from proximal/inner COM to distal/outer COM, which in most RGCs is ON to OFF dendrites. Mean and SD of offsets are shown by red crosses. All figure data is from the Eyewire dataset8, exported via the Eyewire Museum mesh tool. Meshes were flattened and offset computationally with parameters fit by eye to maximize flatness.
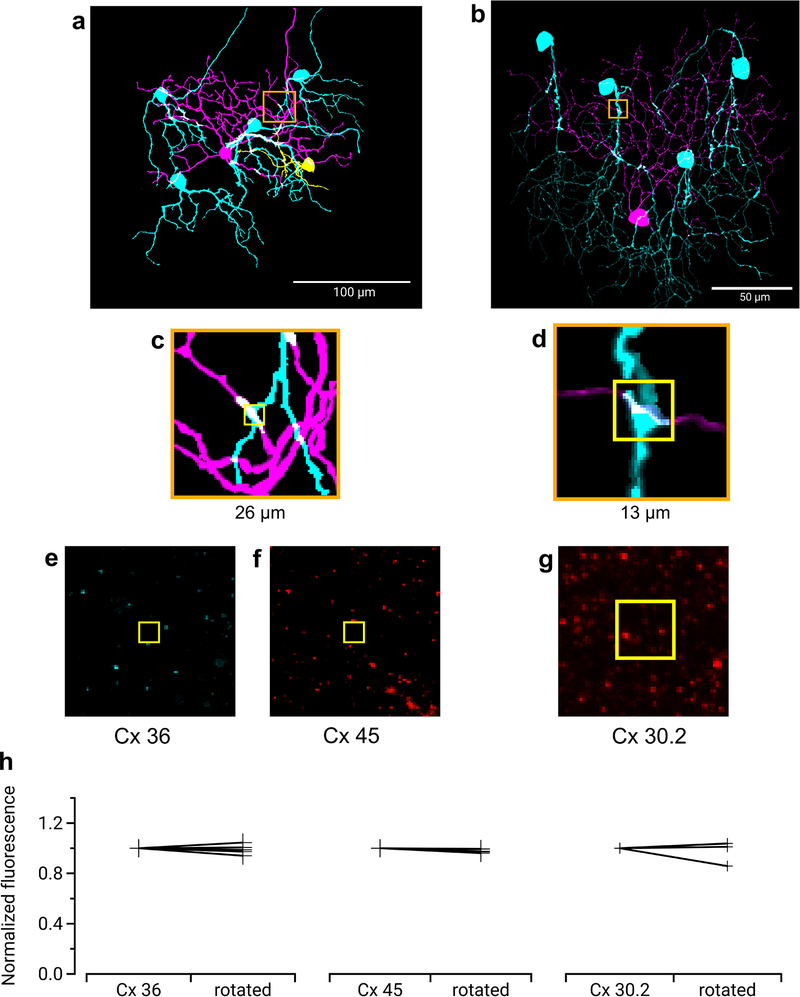
Extended Data Fig. 4. Immunohistochemistry for three types of Connexin at RGC contact points shows negative results.
Three connexins were evaluated for presence at the regions of contact between an F-mini-ON and multiple F-mini-OFF RGCs, n = 1 of each experiment. a,b, Full depth maximum intensity projection images of a Neurobiotin-filled F-mini-ON RGC (magenta),the connected F-mini-OFF RGCs (cyan), and a cell of unclassified type due to insufficiently filled dendrites (yellow). Tracing, segmentation, and masking were performed manually. Image brightness was scaled separately by cell type for illustration here but not for analysis. c,d Thin projection images of regions in orange squares in a,b showing an example RGC crossing point with yellow square for spatial reference. Stack depth is 3.5 μm. e-g, The same region and depth as in c,d, showing the IHC channels for the three connexin proteins. h, Quantification of overlap between connexin images and RGC contact region masks. Values are similar before and after a 90 degree rotation of the connexin image. Points mark the overlap of the single F-mini-ON RGC with each F-mini-OFF RGC in the image.
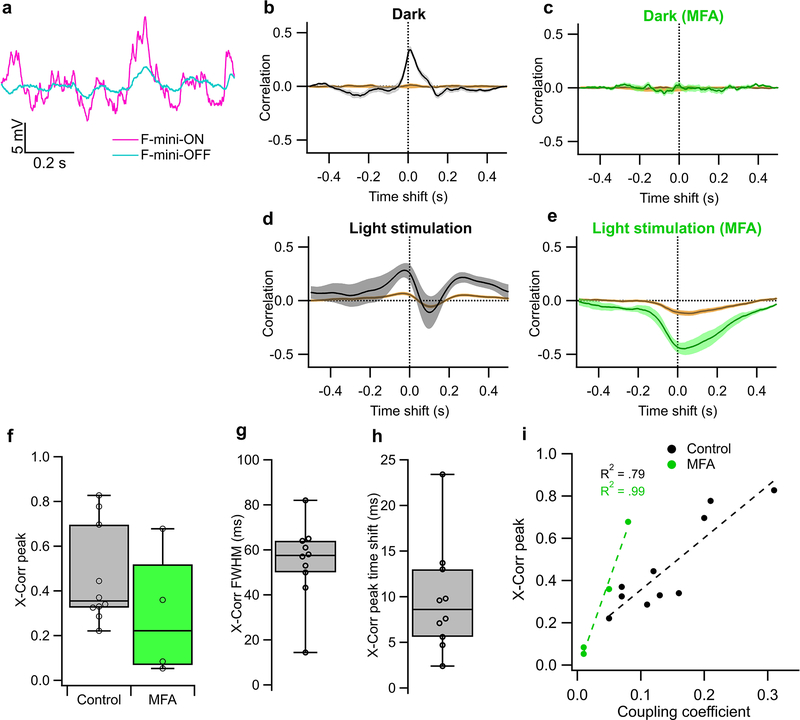
Extended Data Fig. 5. Noise correlations between F-mini-ON and F-mini-OFF RGCs.
a, Traces from a simultaneously recorded pair of F-mini-ON (magenta) and F-mini-OFF (cyan) RGCs in current clamp in darkness (no stimulus). b-e. Example cross correlation of the simultaneous voltage from the cells in a. Brown trace is for shuffled trials. Shaded regions are SEM across trials. Time shift is F-mini-ON - F-mini-OFF (positive values are F-mini-ON earlier). b, Results in darkness. c, Results in darkness in the presence of MFA. d, Results under randomly moving object light stimulation. e, Results under the same light stimulation in the presence of MFA. f, Population data showing peak cross-correlation in control and in MFA. Values in MFA are significantly lower than corresponding values in control (n = 4 cell pairs, p = 0.0068, paired-sample one-tailed t-test). g, Full width at half max and h, time shift (right) of cross correlation peak in control conditions. Error bars in f-h are SEM across cell pairs and points are each cell pair. i, Relationship between cross-correlation peak and coupling coefficient in darkness measured from current injections as in Fig. 2e–h. Box plots in f,g,h show maximum, 75th percentile, median, 25th percentile, and minimum.
Extended Data Fig. 6. MFA does not selectively eliminate OFF responses in non-F-mini RGCs.
a, Example of an ON-OFF direction selective RGC responding to the onset and offset of a dark spot from a mean luminance of 2000 R*/rod/s in control conditions (black) and in MFA (green). b, Population data of spike counts and c, subthreshold potential responses to an OFF light step as in a for 3 ON-OFF DS RGCS. Baseline voltage level shift mean in control RGCs was −59.9 to −61.8 mV (n = 3 cells). Box plots in b,c show maximum, 75th percentile, median, 25th percentile, and minimum.
Extended Data Fig. 7. A single cell model generates responses similar to those observed in F-mini-ON RGCs.
a, Diagram of single cell receptive field offset model showing the parameters for each of four RGC input component pathways. b, Responses of the model to flashed spots of varying sizes showing a qualitative match of surround properties to F-mini-ON RGCs as seen in Extended Data Figure 2a. c, Measured direction selectivity mean in F-mini-ON and ON-OFF DS RGCs, varying over speed (error bars are SD). Individual F-mini-ON RGCs are shown in gray (n = 103 F-mini-ON and n = 279 ON-OFF DS). d, Model response DSI over object speed showing similar DSI magnitude and low-speed preference properties to measured responses. e, (upper) Orientation selectivity of the population of F-mini-ON RGCs. Dashed lines are published means for OS and control RGCs28,29. (lower) Distribution of OS preference angle. g, Moving bar DS preference angle distribution across retina space of F-mini-ON RGCs. Blue = left eye, green = right eye. D,V,N,T denote dorsal, ventral, nasal, and temporal, respectively.
Extended Data Fig. 8. Multi-cell model results are robust over several parameters.
a, Illustration of the difference of gaussians RF map used in the single cell model, with an ellipse at the central 2σ contour. b, Diagram of RF offset and scaling properties in the model: the diameter (D) and the offset ratio (F) between ON (magenta) and OFF (cyan) sub-fields. c, Heatmap of vertical position error (for horizontally oriented stimuli) across models with a range of RF size (D) and RF offset ratio (F). Black and magenta points are the parameters used in the following panels and those in Fig. 5d–f. d, Absolute error, e, vertical error change ratio, and f, horizontal error change ratio for the three RF models across a range of cell density. g, Absolute error, h, vertical error change, and i, horizontal error change ratio for the three RF models across a range of noise values.
Acknowledgements
We thank the entire Schwartz Lab group for discussions, advice, and support.
We thank Prof. Bennett Novich for generously providing the FOXP1 antibody.
Imaging work was performed at the Northwestern University Center for Advanced Microscopy, generously supported by NCI CCSG P30 CA060553 awarded to the Robert H Lurie Comprehensive Cancer Center. Multiphoton microscopy was performed on a Nikon A1R multiphoton microscope, acquired through the support of NIH 1S10OD010398–01.
This work was supported by NIH National Eye Institute F31 EY029593, NIH National Eye Institute T32 EY025202, and NIH DP2 EY026770.
Footnotes
Competing interests
The authors declare no competing interests.
References
- 1.Schwartz GW et al. The spatial structure of a nonlinear receptive field. Nat. Neurosci. 15, 1572–1580 (2012). [DOI] [PMC free article] [PubMed] [Google Scholar]
- 2.Wassle H, Peichl L & Boycott BB Dendritic territories of cat retinal ganglion cells. Nature 292, 344–345 (1981). [DOI] [PubMed] [Google Scholar]
- 3.Gauthier JL et al. Receptive Fields in Primate Retina Are Coordinated to Sample Visual Space More Uniformly. PLoS Biol. 7, e63–e63 (2009). [DOI] [PMC free article] [PubMed] [Google Scholar]
- 4.Roska B & Werblin F Vertical interactions across ten parallel, stacked representations in the mammalian retina. Nature 410, 583–587 (2001). [DOI] [PubMed] [Google Scholar]
- 5.Masland RH The fundamental plan of the retina. Nat. Neurosci. 4, 877–886 (2001). [DOI] [PubMed] [Google Scholar]
- 6.Baden T et al. The functional diversity of retinal ganglion cells in the mouse. Nature 529, 345–350 (2016). [DOI] [PMC free article] [PubMed] [Google Scholar]
- 7.Sanes JR & Masland RH The Types of Retinal Ganglion Cells: Current Status and Implications for Neuronal Classification. Annu. Rev. Neurosci. 38, 221–246 (2015). [DOI] [PubMed] [Google Scholar]
- 8.Bae JA et al. Digital Museum of Retinal Ganglion Cells with Dense Anatomy and Physiology. Cell 173, 1293–1306.e19 (2018). [DOI] [PMC free article] [PubMed] [Google Scholar]
- 9.Tran NM et al. Single-Cell Profiles of Retinal Ganglion Cells Differing in Resilience to Injury Reveal Neuroprotective Genes. Neuron 104, 1039–1055.e12 (2019). [DOI] [PMC free article] [PubMed] [Google Scholar]
- 10.Sivyer B, Venkataramani S, Taylor WR & Vaney DI A novel type of complex ganglion cell in rabbit retina. J. Comp. Neurol. 519, 3128–3138 (2011). [DOI] [PMC free article] [PubMed] [Google Scholar]
- 11.Puller C, Manookin MB, Neitz J, Rieke F & Neitz M Broad Thorny Ganglion Cells: A Candidate for Visual Pursuit Error Signaling in the Primate Retina. Journal of Neuroscience 35, 5397–5408 (2015). [DOI] [PMC free article] [PubMed] [Google Scholar]
- 12.Trenholm S, McLaughlin AJ, Schwab DJ & Awatramani GB Dynamic Tuning of Electrical and Chemical Synaptic Transmission in a Network of Motion Coding Retinal Neurons. Journal of Neuroscience 33, 14927–14938 (2013). [DOI] [PMC free article] [PubMed] [Google Scholar]
- 13.Field GD et al. Spatial properties and functional organization of small bistratified ganglion cells in primate retina. J. Neurosci. 27, 13261–13272 (2007). [DOI] [PMC free article] [PubMed] [Google Scholar]
- 14.Marvin JS et al. An optimized fluorescent probe for visualizing glutamate neurotransmission. Nat. Methods 10, 162–170 (2013). [DOI] [PMC free article] [PubMed] [Google Scholar]
- 15.Rousso DL et al. Two Pairs of ON and OFF Retinal Ganglion Cells Are Defined by Intersectional Patterns of Transcription Factor Expression. Cell Rep. 15, 1930–1944 (2016). [DOI] [PMC free article] [PubMed] [Google Scholar]
- 16.Brown SP, He S & Masland RH Receptive Field Microstructure and Dendritic Geometry of Retinal Ganglion Cells. Neuron 27, 371–383 (2000). [DOI] [PubMed] [Google Scholar]
- 17.Bloomfield SA & Völgyi B The diverse functional roles and regulation of neuronal gap junctions in the retina. Nat. Rev. Neurosci. 10, 495–506 (2009). [DOI] [PMC free article] [PubMed] [Google Scholar]
- 18.Roy K, Kumar S & Bloomfield SA Gap junctional coupling between retinal amacrine and ganglion cells underlies coherent activity integral to global object perception. Proceedings of the National Academy of Sciences 114, E10484–E10493 (2017). [DOI] [PMC free article] [PubMed] [Google Scholar]
- 19.Trenholm S, Schwab DJ, Balasubramanian V & Awatramani GB Lag normalization in an electrically coupled neural network. Nat. Neurosci. 16, 154–156 (2013). [DOI] [PubMed] [Google Scholar]
- 20.Jacoby J, Nath A, Jessen ZF & Schwartz GW A Self-Regulating Gap Junction Network of Amacrine Cells Controls Nitric Oxide Release in the Retina. Neuron 100, 1149–1162.e5 (2018). [DOI] [PMC free article] [PubMed] [Google Scholar]
- 21.Phelan P et al. Molecular mechanism of rectification at identified electrical synapses in the Drosophila giant fiber system. Curr. Biol. 18, 1955–1960 (2008). [DOI] [PMC free article] [PubMed] [Google Scholar]
- 22.Elgueta C, Leroy F, Vielma AH, Schmachtenberg O & Palacios AG Electrical coupling between A17 cells enhances reciprocal inhibitory feedback to rod bipolar cells. Sci. Rep. 8, 3123 (2018). [DOI] [PMC free article] [PubMed] [Google Scholar]
- 23.Pan F, Mills SL & Massey SC Screening of gap junction antagonists on dye coupling in the rabbit retina. Vis. Neurosci. 24, 609–618 (2007). [DOI] [PMC free article] [PubMed] [Google Scholar]
- 24.Kuo SP, Schwartz GW & Rieke F Nonlinear Spatiotemporal Integration by Electrical and Chemical Synapses in the Retina. Neuron 90, 320–332 (2016). [DOI] [PMC free article] [PubMed] [Google Scholar]
- 25.Peretz A et al. Meclofenamic Acid and Diclofenac, Novel Templates of KCNQ2/Q3 Potassium Channel Openers, Depress Cortical Neuron Activity and Exhibit Anticonvulsant Properties. Molecular Pharmacology vol. 67 1053–1066 (2005). [DOI] [PubMed] [Google Scholar]
- 26.Jacoby J, Zhu Y, DeVries SH & Schwartz GW An Amacrine Cell Circuit for Signaling Steady Illumination in the Retina. Cell Rep. 13, 2663–2670 (2015). [DOI] [PMC free article] [PubMed] [Google Scholar]
- 27.Vaney DI, Sivyer B & Taylor WR Direction selectivity in the retina: symmetry and asymmetry in structure and function. Nat. Rev. Neurosci 13, 194–208 (2012). [DOI] [PubMed] [Google Scholar]
- 28.Nath A & Schwartz GW Cardinal Orientation Selectivity Is Represented by Two Distinct Ganglion Cell Types in Mouse Retina. J. Neurosci. 36, 3208–3221 (2016). [DOI] [PMC free article] [PubMed] [Google Scholar]
- 29.Nath A & Schwartz GW Electrical synapses convey orientation selectivity in the mouse retina. Nat. Commun. 8, 2025 (2017). [DOI] [PMC free article] [PubMed] [Google Scholar]
- 30.Katz ML, Viney TJ & Nikolic K Receptive Field Vectors of Genetically-Identified Retinal Ganglion Cells Reveal Cell-Type-Dependent Visual Functions. PLoS One 11, e0147738 (2016). [DOI] [PMC free article] [PubMed] [Google Scholar]
- 31.Farrow K et al. Ambient illumination toggles a neuronal circuit switch in the retina and visual perception at cone threshold. Neuron 78, 325–338 (2013). [DOI] [PubMed] [Google Scholar]
- 32.Puller C et al. Electrical Coupling of Heterotypic Ganglion Cells in the Mammalian Retina. J. Neurosci. 40, 1302–1310 (2020). [DOI] [PMC free article] [PubMed] [Google Scholar]
- 33.Mani A & Schwartz GW Circuit Mechanisms of a Retinal Ganglion Cell with Stimulus-Dependent Response Latency and Activation Beyond Its Dendrites. Curr. Biol. 27, 471–482 (2017). [DOI] [PMC free article] [PubMed] [Google Scholar]
- 34.Lauritzen JS et al. ON cone bipolar cell axonal synapses in the OFF inner plexiform layer of the rabbit retina. J. Comp. Neurol. 521, 977–1000 (2013). [DOI] [PMC free article] [PubMed] [Google Scholar]
- 35.Hoy JL, Yavorska I, Wehr M & Niell CM Vision Drives Accurate Approach Behavior during Prey Capture in Laboratory Mice. Curr. Biol. 26, 3046–3052 (2016). [DOI] [PMC free article] [PubMed] [Google Scholar]
- 36.Hoy JL, Bishop HI & Niell CM Defined cell types in superior colliculus make distinct contributions to prey capture behavior in the mouse. bioRxiv 626622 (2019). [DOI] [PMC free article] [PubMed] [Google Scholar]
- 37.Shlens J, Rieke F & Chichilnisky EJ Synchronized firing in the retina. Curr. Opin. Neurobiol. 18, 396–402 (2008). [DOI] [PMC free article] [PubMed] [Google Scholar]
- 38.DeVries SH Correlated firing in rabbit retinal ganglion cells. J. Neurophysiol. 81, 908–920 (1999). [DOI] [PubMed] [Google Scholar]
- 39.Mastronarde DN Correlated firing of retinal ganglion cells. Trends Neurosci. 12, 75–80 (1989). [DOI] [PubMed] [Google Scholar]
- 40.Rathbun DL, Warland DK & Usrey WM Spike timing and information transmission at retinogeniculate synapses. J. Neurosci. 30, 13558–13566 (2010). [DOI] [PMC free article] [PubMed] [Google Scholar]
- 41.Zylberberg J, Cafaro J, Turner MH, Shea-Brown E & Rieke F Direction-Selective Circuits Shape Noise to Ensure a Precise Population Code. Neuron 89, 369–383 (2016). [DOI] [PMC free article] [PubMed] [Google Scholar]
- 42.Tong R & Trenholm S High resolution visual information via a gap junction-mediated spike order code. 2020.08.14.250910 (2020) doi: 10.1101/2020.08.14.250910. [DOI] [Google Scholar]
- 43.Wallace DJ et al. Rats maintain an overhead binocular field at the expense of constant fusion. Nature 498, 65–69 (2013). [DOI] [PubMed] [Google Scholar]
- 44.Yilmaz M & Meister M Rapid Innate Defensive Responses of Mice to Looming Visual Stimuli. Curr. Biol. 23, 2011–2015 (2013). [DOI] [PMC free article] [PubMed] [Google Scholar]
- 45.Mills SL & Massey SC Differential properties of two gap junctional pathways made by AII amacrine cells. Nature 377, 734–737 (1995). [DOI] [PubMed] [Google Scholar]
References (Methods)
- 46.Sato C, Iwai-Takekoshi L, Ichikawa Y & Kawasaki H Cell type-specific expression of FoxP2 in the ferret and mouse retina. Neurosci. Res. 117, 1–13 (2017). [DOI] [PubMed] [Google Scholar]
- 47.Longair MH, Baker DA & Armstrong JD Simple Neurite Tracer: open source software for reconstruction, visualization and analysis of neuronal processes. Bioinformatics 27, 2453–2454 (2011). [DOI] [PubMed] [Google Scholar]
- 48.Rousso DL, Gaber ZB, Wellik D, Morrisey EE & Novitch BG Coordinated actions of the forkhead protein Foxp1 and Hox proteins in the columnar organization of spinal motor neurons. Neuron 59, 226–240 (2008). [DOI] [PMC free article] [PubMed] [Google Scholar]
- 49.Lu MM, Li S, Yang H & Morrisey EE Foxp4: a novel member of the Foxp subfamily of winged-helix genes co-expressed with Foxp1 and Foxp2 in pulmonary and gut tissues. Mech. Dev. 119 Suppl 1, S197–202 (2002). [DOI] [PubMed] [Google Scholar]
- 50.Bhattacharyya S et al. Using Gjd3-CreEGFP mice to examine atrioventricular node morphology and composition. Sci. Rep 9, 2106 (2019). [DOI] [PMC free article] [PubMed] [Google Scholar]
- 51.Han Y & Massey SC Electrical synapses in retinal ON cone bipolar cells: subtype-specific expression of connexins. Proc. Natl. Acad. Sci. U. S. A. 102, 13313–13318 (2005). [DOI] [PMC free article] [PubMed] [Google Scholar]
- 52.de Andrade GB, Kunzelman L, Merrill MM & Fuerst PG Developmentally dynamic colocalization patterns of DSCAM with adhesion and synaptic proteins in the mouse retina. Mol. Vis. 20, 1422–1433 (2014). [PMC free article] [PubMed] [Google Scholar]
Associated Data
This section collects any data citations, data availability statements, or supplementary materials included in this article.
Data Availability Statement
Data for ganglion cell typology in the mouse is available at http://RGCTypes.org. A subset of the datasets that support the findings of this study are available at https://github.com/SchwartzNU/ProjectData_Fmini. The remainder of the datasets are available from the corresponding author upon reasonable request.


