Abstract
This paper presents a study of early epidemiological assessment of COVID-19 transmission dynamics in Indonesia. The aim is to quantify heterogeneity in the numbers of secondary infections. To this end, we estimate the basic reproduction number and the overdispersion parameter at two regions in Indonesia: Jakarta–Depok and Batam. The method to estimate is based on a sequential Bayesian method, while the parameter is estimated by fitting the secondary case data with a negative binomial distribution. Based on the first 1288 confirmed cases collected from both regions, we find a high degree of individual-level variation in the transmission. The basic reproduction number is estimated at 6.79 and 2.47, while the overdispersion parameter of a negative-binomial distribution is estimated at 0.06 and 0.2 for Jakarta–Depok and Batam, respectively. This suggests that superspreading events played a key role in the early stage of the outbreak, i.e., a small number of infected individuals are responsible for large numbers of COVID-19 transmission. This finding can be used to determine effective public measures, such as rapid isolation and identification, which are critical since delay of diagnosis is the most common cause of superspreading events.
Subject terms: Diseases, Health care
Introduction
The first two confirmed cases of COVID-19 in Indonesia was announced in March 2, 2020 by the president himself. Jakarta and its buffer zones including Depok have become the epicenter of the outbreak. In its early transmission, about 50% of cases were from the cities. The virus quickly spread to all 34 provinces, with more than 450,000 confirmed cases and 15,000 deaths as of November 12, 2020. As a country with the highest death toll in South East Asia and one with the lowest global testing rate, the first government effort to control the disease was by establishing a COVID-19 response acceleration task force led by the head of the National Disaster Management Agency. The government further introduced Large-Scale Social Restrictions, which included measures such as closing public places, restricting public transport, and limiting travel to and from restricted regions. On May 19, the first milestone of 10,000 PCR tests per day was reached. In June 2020, WHO announced that only Jakarta meets the minimum requirement of 1 test per 1000 population per week for a reliable positivity rate calculation.
As the Indonesian government struggles to mitigate the COVID-19 epidemic in the country, it becomes critical to understand its infection spreads. Here, we present a first quantitative analysis of early transmission dynamics of the disease and the evidence of superspreading events in Indonesia based on contact tracing of secondary cases. The aim is to quantify heterogeneity in numbers of secondary infections. Infection clusters are difficult to predict and thus difficult to prevent. Nevertheless, understanding their environmental and behavioral drivers have been recently recognized to be extremely important to inform strategies for prevention and control1,2 as the reproduction number is no longer enough3. Previous studies in China and Hong Kong show identifying and interrupting superspreading events are critical importance of preventing the spread of the infection4,5.
Methods
With regard to transmission, whenever we find a new COVID-19 case, we labelled them as index cases. Aiming to contain the transmission, we then perform contact tracing to identify persons who have close contact with the index cases and send them for testing when necessary. In our study, any close contacts of the index case with positive COVID-19 test based on the Indonesian Guideline for COVID-19 Control were defined as secondary cases. Thereafter, we can calculate the average number of secondary cases generated from a set of index cases. In our analysis of Jakarta, we combine data from Depok that is a main buffer city of the capital. Outside the epicentre, we present data from Batam that has received thousand test kits and protective equipment from Singapore as a comparison. There were 218 cases from 4092 PCR tests, as of June 26.
We use a sequential Bayesian method based on the discrete Susceptible-Infectious-Recovered (SIR) model to estimate the basic reproduction number 6. Time series of the active cases at day n is assumed to follow the model , where is the instantaneous reproduction number and is the infectious time taken to be 9 days herein7. Assuming a Poisson distribution for the arrival of active cases and using Bayes’ theorem, the posterior probability of given a confirmed case is computed through
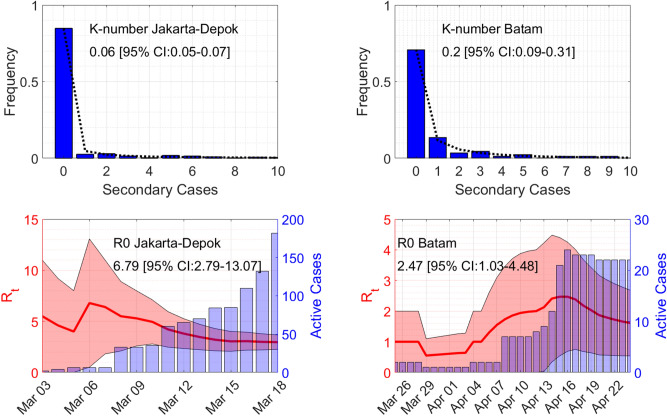
The formula comes from the assumption that the prior distribution of at day n is taken from the posterior of day with a uniform prior at day 1. Estimated is then the maximum of , see Fig. 2.
Figure 2.
Estimates of the overdispersion parameter and the basic reproduction number . Lines in the top figures show maximum-likelihood fits for the negative binomial distribution.
The parameter is then defined as the overdispersion parameter in the negative binomial distribution8, which can be found by fitting the distribution to the secondary cases data. The overdispersion parameter describes the observation that variation is higher than would be expected. Small (typically less than one) means high individual-level variation in the distribution of the number of secondary infections, and vice verse. The number of secondary cases by one person x can be expressed in terms of the overdispersion parameter and the probability p as
We use a MATLAB® function nbinfit to estimate the overdispersion parameter . The function uses derivative-free method to find the maximum of the likelihood function.
Results
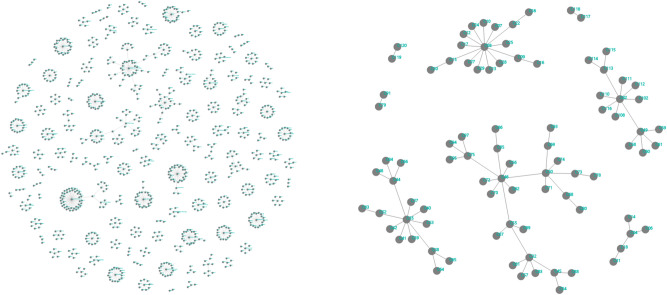
Based on 1288 confirmed cases in March and April 2020 in the regions Jakarta–Depok (population 12.6 millions) and Batam (population 1.4 millions), we find a high degree of individual-level variation in the transmission. Early in the outbreak, superspreaders transmit the majority of coronavirus cases, as can be seen from Fig. 1. Defining a superspreader as an individual who infects at least eight other individuals, there were 44 clusters in Jakarta–Depok region (2–31 March, 2020) and 3 clusters in Batam city (19 March–7 April 2020), as can be seen from Table 1.
Figure 1.
Networks of secondary infections based on local transmissions in Jakarta–Depok (left) and Batam (right) regions.
Table 1.
Secondary cases data of the two regions based on local transmissions.
| Jakarta–Depok | Batam | ||
|---|---|---|---|
| Secondary cases | Frequency | Secondary cases | Frequency |
| 0 | 1017 | 0 | 63 |
| 1 | 31 | 1 | 12 |
| 2 | 36 | 2 | 3 |
| 3,6 | 17 | 3 | 4 |
| 4,13 | 4 | 4.7–9.13 | 1 |
| 5 | 22 | 5 | 2 |
| 7 | 11 | ||
| 8,11,12 | 3 | ||
| 9 | 8 | ||
| 10 | 7 | ||
| 14,17,20,21,26,27,36,43 | 1 | ||
| 15,16,19,23 | 2 | ||
| Total | 1199 | Total | 89 |
We estimated the reproduction number to be at 6.79 and 2.47, while the overdispersion parameter of a negative-binomial distribution is obtained at 0.06 and 0.2 for Jakarta–Depok and Batam, respectively (see Fig. 2), suggesting that a small number of infected individuals are responsible for large amounts of the disease transmission. Our finding is consistent with other researcher has found in China9. Indeed, between 10–15% of all infections were responsible for 80% of onward transmission events.
Discussion
The fact that Indonesia has a moderate number of positive cases, compared to other countries with roughly the same population size such as Russia, USA, and Brazil, can be caused by three reasons: a low number of tests, the success of Large-Scale Social Restrictions, and overdispersion of the COVID-19 transmission. Our result clearly indicates that the transmission is overdispersed, even though it does not exclude the other possibilities. Therefore, close-interaction activities such as traditional markets, religious gathering, and wedding parties need to be adapted if not restricted, as they can become transmission hot spots. Effective response factors to reduce the transmission include aggressive implementation of non-pharmaceutical interventions such as rapid identification and isolation of cases. Furthermore, timeliness is critical to prevent or limit their extent since delay of diagnosis is the most common cause of superspreading clusters10.
Supplementary Information
Acknowledgements
We would like to thank Public Health Office of Jakarta Province, Communication, Information and Statistic Office of Jakarta Province, Jakarta Smart City Unit, Human Settlements and Spatial Planning Office of Jakarta Province, Public Health Offices of Batam, and Depok Task Force for COVID-19 Control for providing the data, feedback, and discussions. This work was supported by National Research and Innovation Agency (BRIN), project number 133/FI/P-KCOVID-19 2B3/IX/2020, 835/IT1 B07/KS.00.00/2020.
Author contributions
A.H., H.S., and M.F.K. analysed the data, calculated and , and discussed the results, N.N., B.L., D.T., and W.W. collected the data. All authors reviewed the manuscript.
Data and code availability
Secondary cases data (both in Excel and Power BI) and a MATLAB® code to produce Figs. 1 and 2 are available at: https://github.com/agusisma/covidindonesia.
Competing interests
The authors declare no competing interests.
Footnotes
Publisher's note
Springer Nature remains neutral with regard to jurisdictional claims in published maps and institutional affiliations.
Supplementary Information
The online version contains supplementary material available at 10.1038/s41598-020-79352-5.
References
- 1.Meo S, et al. Biological and epidemiological trends in the prevalence and mortality due to outbreaks of novel coronavirus covid-19. J. King Saud Univ. Sci. 2020;32:2495–2499. doi: 10.1016/j.jksus.2020.04.004. [DOI] [PMC free article] [PubMed] [Google Scholar]
- 2.Bashir M, Benjiang M, Shahzad L. A brief review of socio-economic and environmental impact of covid-19. Air Qual. Atmos. Health. 2020 doi: 10.1007/s11869-020-00894-8. [DOI] [PMC free article] [PubMed] [Google Scholar]
- 3.Adam D. A guide to R—the pandemic’s misunderstood metric. Nature. 2020;583:346–348. doi: 10.1038/d41586-020-02009-w. [DOI] [PubMed] [Google Scholar]
- 4.Frieden T, Lee C. Identifying and interrupting superspreading events-implications for control of severe acute respiratory syndrome coronavirus 2. Emerg. Infect. Dis. 2020;26:1059–1066. doi: 10.3201/eid2606.200495. [DOI] [PMC free article] [PubMed] [Google Scholar]
- 5.Adam D, et al. Clustering and superspreading potential of SARS-CoV-2 infections in Hong Kong. Nat. Med. 2020 doi: 10.1038/s41591-020-1092-0. [DOI] [PubMed] [Google Scholar]
- 6.Susanto H, et al. How many can you infect? Simple (and naive) methods of estimating the reproduction number. Commun. Biomath. Sci. 2020;3:28–36. [Google Scholar]
- 7.To KK-W, et al. Temporal profiles of viral load in posterior oropharyngeal saliva samples and serum antibody responses during infection by sars-cov-2: an observational cohort study. Lancet. Infect. Dis. 2020;20:565–74. doi: 10.1016/S1473-3099(20)30196-1. [DOI] [PMC free article] [PubMed] [Google Scholar]
- 8.Lloyd-Smith J. Maximum likelihood estimation of the negative binomial dispersion parameter for highly overdispersed data, with applications to infectious diseases. PLoS ONE. 2007;2:e180. doi: 10.1371/journal.pone.0000180. [DOI] [PMC free article] [PubMed] [Google Scholar]
- 9.Endo A, Abbott S, Kucharski A, Funk S. Estimating the overdispersion in covid-19 transmission using outbreak sizes outside china. Wellcome Open Res. 2020 doi: 10.12688/wellcomeopenres.15842.1. [DOI] [PMC free article] [PubMed] [Google Scholar]
- 10.Lloyd-Smith J, Schreiber S, Kopp P, Getz WM. Superspreading and the effect of individual variation on disease emergence. Nature. 2005;438:355–359. doi: 10.1038/nature04153. [DOI] [PMC free article] [PubMed] [Google Scholar]
Associated Data
This section collects any data citations, data availability statements, or supplementary materials included in this article.
Supplementary Materials
Data Availability Statement
Secondary cases data (both in Excel and Power BI) and a MATLAB® code to produce Figs. 1 and 2 are available at: https://github.com/agusisma/covidindonesia.


