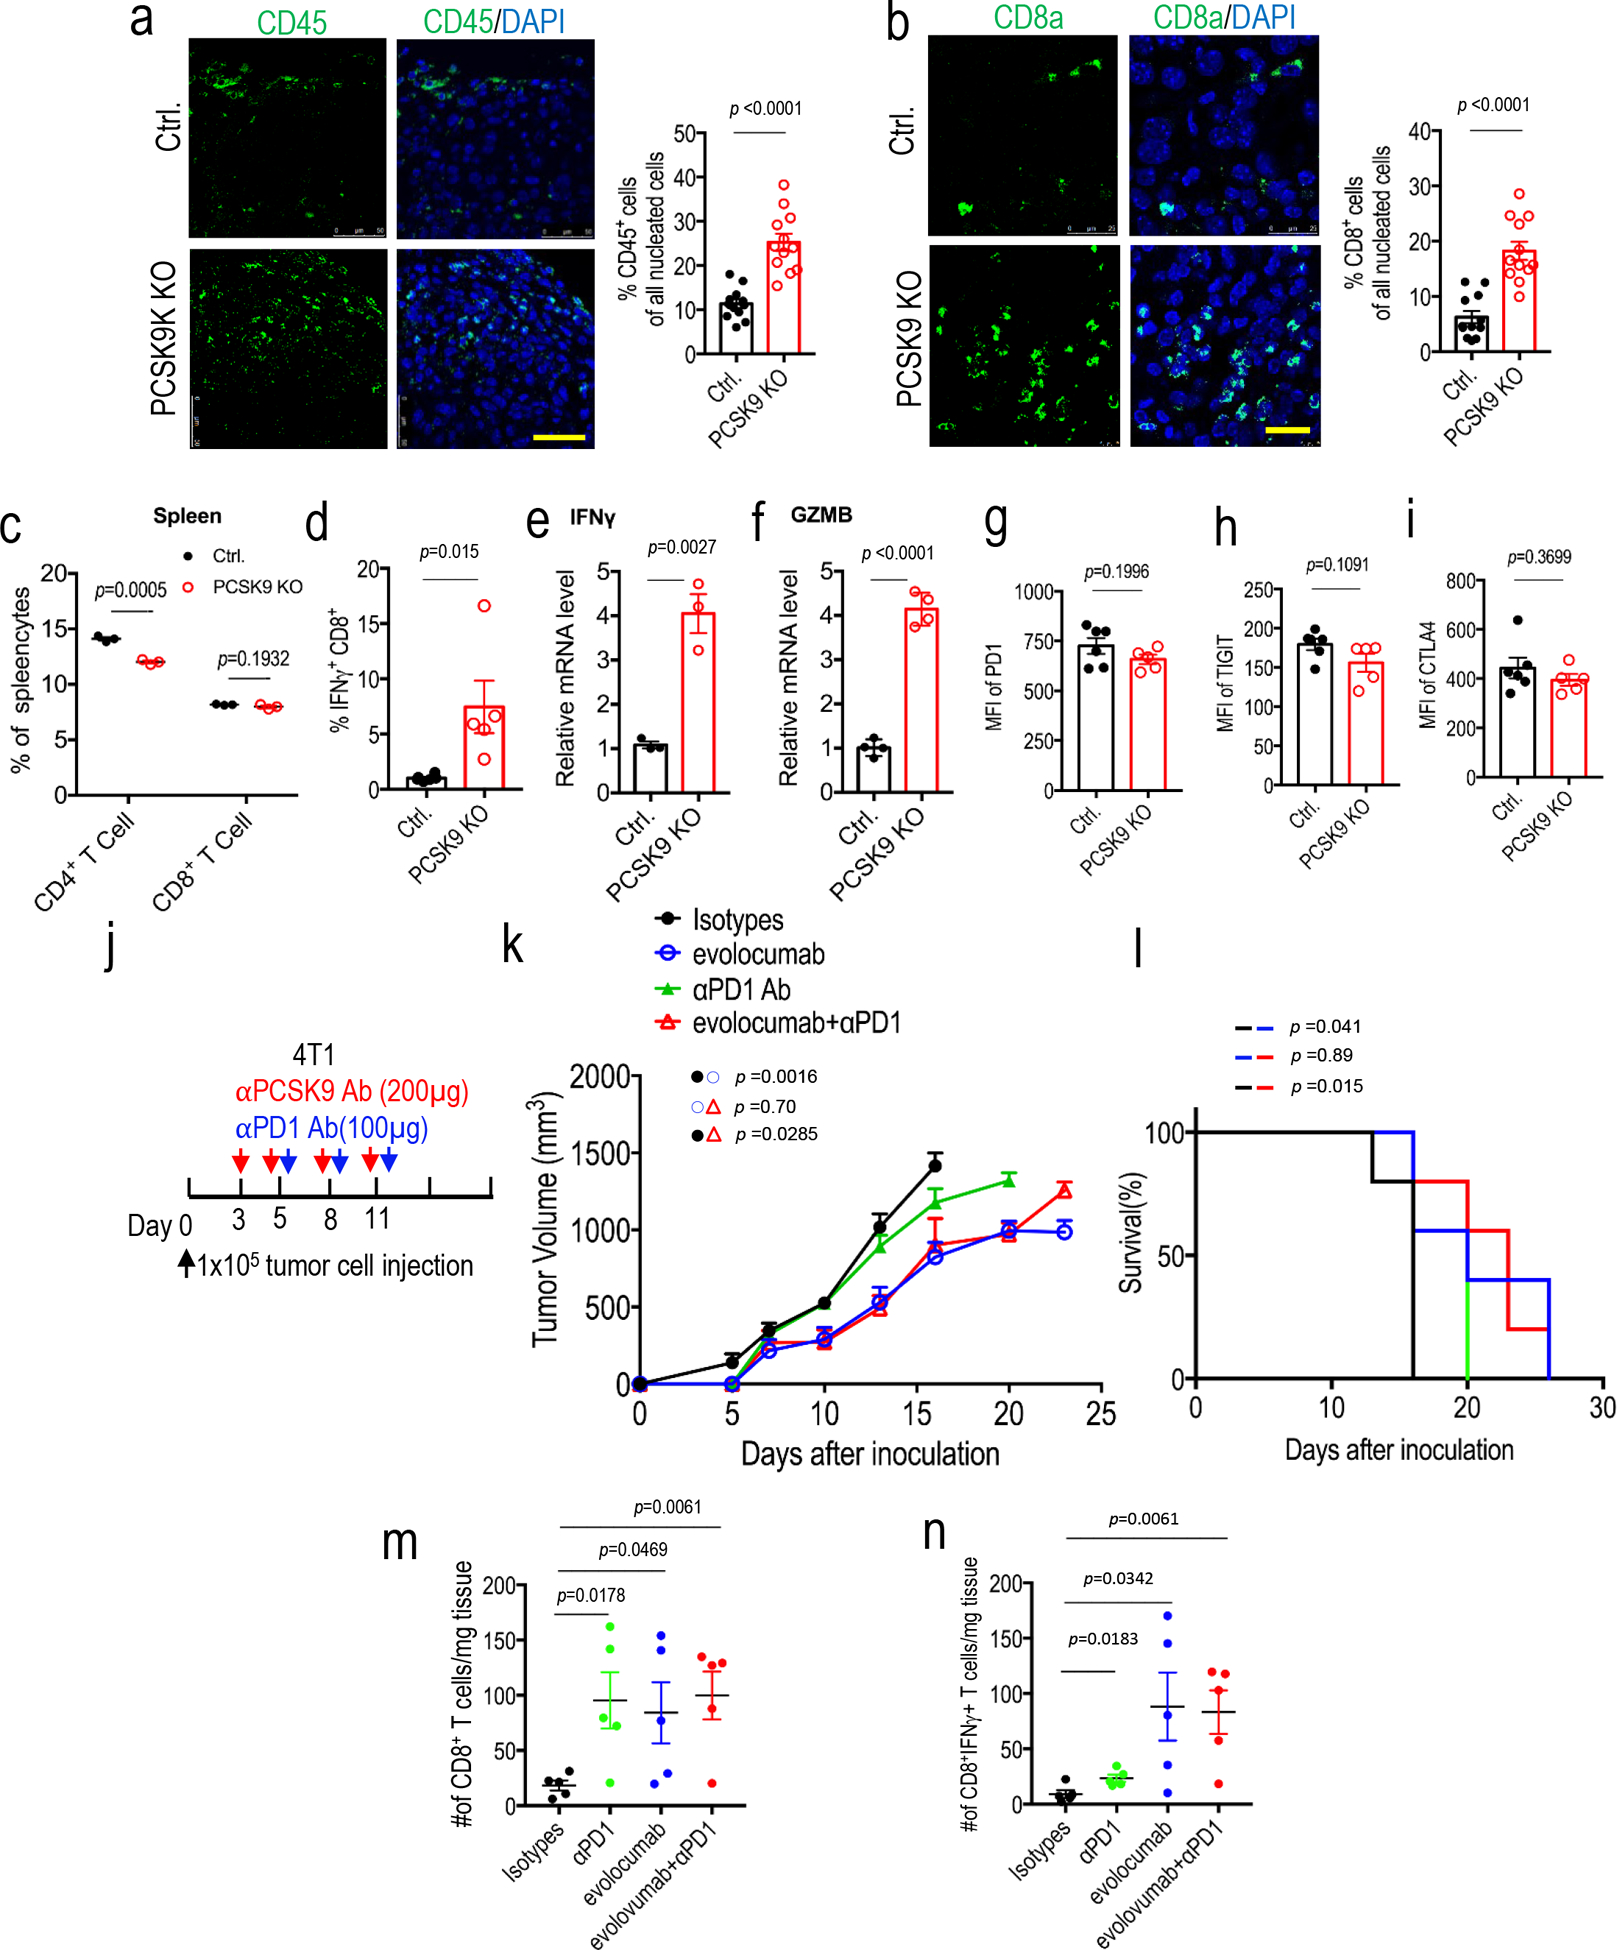
Extended Data Fig. 6. Additional data on the characterization of lymphocyte infiltration into murine tumors.

a. Immunofluorescence staining (left panel) and quantitative estimate (right panel) of CD45+ leukocytes in control and PCSK9KO tumors grown in syngeneic C57BL/6 mice. Scale bar = 50 μm. n=3 biologically independent samples. Four fluorescent fields for each of the three samples were counted. Error bars, mean ± S.E.M. P value calculated using unpaired two-sided t-test. b.Immunofluorescence staining (left panel) and quantitative estimate (right panel) of CD8a+ cells in control and PCSK9KO B16F10 tumors. Scale bar = 20 μm. n=3 biologically independent samples. Four fluorescent fields for each of the three samples were counted. Error bars, mean ± S.E.M. P value calculated using unpaired two-sided t test. c. Quantitative estimates of CD4+ and 452 CD8+ T cells in the spleens of mice bearing control and PCSK9KO B16F10 tumors as determined by flow cytometry. n=3 mice per group. Error bars, mean ± SEM. P values calculated using unpaired two-sided t-test. d. Flow cytometry determination of the percentage of intratumoral CD8+ T cells that were IFNγ+. n=6,5 tumors in the two groups. Error bars, mean ± S.E.M. P value calculated by unpaired two-sided t-test. e, f. Q-RT-PCR analysis of intratumoural IFNG (e) and GZMB (f) mRNA levels in control and PCSK9KO tumors. n=3 and 4 tumors for INFG and GZMB groups, respectively. Error bars, mean ± S.E.M. P values were determined by unpaired two-sided t test. g-i. Flow cytometry characterization of the cell surface expression levels of exhaustion markers for intratumoural CD8+ T cells in vector control and PCSK9KO tumors. n=6, 5 tumors. Error bars, mean ± S.E.M. P values were determined by unpaired two-sided t test. j. Evolocumab and anti-PD1 treatment schedule for syngeneic 4T1 tumor model. k. Growth of 4T1 tumors treated with anti-PD1 and/or evolocumab. n=5 mice per group. P values were determined by two-way ANOVA test. l. Kaplan-Meier survival curve for mice in k. P values were determined by log-rank test. m. Frequency of CD8+ T cells in 4T1 tumors treated with anti-PD1 and/or evolocumab. n=5 tumors per group. Error bars, mean ± SEM. P values were determined by unpaired two-sided t test. n. Frequency of IFNγ+CD8+ T cells in 4T1 tumors treated with anti-PD1 and/or evolocumab. n=5 tumors per group. Error bars, mean 469 ± SEM. P values were determined by unpaired two-sided t test.
