

Abstract
Clostridioides difficile infections (CDI) are the leading cause of nosocomial antibiotic-associated diarrhea. C. difficile produces dormant spores that serve as infectious agents. Bile salts in the gastrointestinal tract signal spores to germinate into toxin-producing cells. As spore germination is required for CDI onset, anti-germination compounds may serve as prophylactics. CamSA, a synthetic bile salt, was previously shown to inhibit C. difficile spore germination in vitro and in vivo. Unexpectedly, a single dose of CamSA was sufficient to offer multi-day protection from CDI in mice without any observable toxicity.
To study this intriguing protection pattern, we examined the pharmacokinetic parameters of CamSA. CamSA was stable to the gut of antibiotic-treated mice but was extensively degraded by the microbiota of non-antibiotic-treated animals. Our data also suggest that CamSA’s systemic absorption is minimal since it is retained primarily in the intestinal lumen and liver. CamSA shows weak interactions with CYP3A4, a P450 hepatic isozyme involved in drug metabolism and bile salt modification. Like other bile salts, CamSA seems to undergo enterohepatic circulation. We hypothesize that the cycling of CamSA between the liver and intestines serves as a slow-release mechanism that allows CamSA to be retained in the gastrointestinal tract for days. This model explains how a single CamSA dose can prevent murine CDI even though spores are present in the animal’s intestine for up to four days post-challenge.
Keywords: Clostridioides difficile, CDI, bile salts, drug therapy, intestine, liver, metabolism, microbiome
Introduction
Clostridioides (formerly Clostridium) difficile is an anaerobic bacterium and the causative agent of C. difficile infection (CDI). CDI is the leading cause of nosocomial antibiotic-associated diarrhea worldwide1,2. In the United States alone, there are approximately 500,000 CDI cases annually, with associated costs estimated at $6.3 billion in treating and managing the disease3–5. The costs associated with treating CDI are also expected to rise due to the increasing incidence of CDI relapse. Approximately 25% of treated patients will relapse within 30 days and 45-65% of these relapsed patients experience additional CDI recurrences5–8.
In order to transmit infection between mammalian hosts and to survive in the external environment, C. difficile must produce oxygen-tolerant spores9,10. In addition to surviving under aerobic conditions, the spores are also exceptionally resistant to other harsh environmental factors including intestinal degradative enzymes, stomach acid, detergents, disinfectants, UV light, and antibiotics3,11,12.
Following the ingestion of C. difficile spores by a mammalian host, the spores eventually enter the small intestine where they are exposed to a variety of bile salts. Taurocholate, a naturally occurring bile salt, is believed to stimulate the spores to transform into vegetative C. difficile cells, through a process known as germination2,13,14. The vegetative C. difficile cells then produce toxins that damage the intestinal epithelium, resulting in the onset of CDI symptoms3,15.
Bile salts are produced in the liver and facilitate the digestion of fats by emulsifying hydrophobic moieties16. Bile salts are stored in the gallbladder and then secreted into the duodenum. Bile salts then traffic into the ileum where a majority (~95%) of the bile salts are reabsorbed by ileal enterocytes, in a process called enterohepatic circulation (EHC)17,18. Bile salts absorbed in this manner are deposited into the portal bloodstream, where they become partly bound to albumin19,20. Once in the portal vein, bile salts are transported back to the liver and taken up by hepatocytes21,22. This movement of bile salts between the liver and the intestines plays an essential role in bile salt recycling and homeostasis23.
Although absorption of bile salts from the small intestine is an efficient process, bile salt uptake by hepatocytes following EHC is imperfect. While bile salts are found primarily in the liver and intestines, up to 0.5 mg of bile salts can be found in systemic circulation due to spillover from EHC16,19.
During their transit through the small intestine, bile salts are commonly processed and metabolized by the gastrointestinal (GI) microbiota21,24. Several species of bacteria produce bile salt hydrolases (BSHs) that deconjugate the C-24 side chain moieties by hydrolyzing the amide bond (Fig. 1). Other bacterially-catalyzed bile salt modifications can also include dehydroxylation, oxidation, and epimerization of the steroid backbone21,23,25. Following bacterial metabolism, the resulting bile salts can be re-absorbed by the small intestine, transported back to the liver, processed, and reused26. As a result, the bile salt pool is composed of a continuously changing variety of related compounds.
Figure 1. Potential intestinal bacterial metabolism of CamSA.
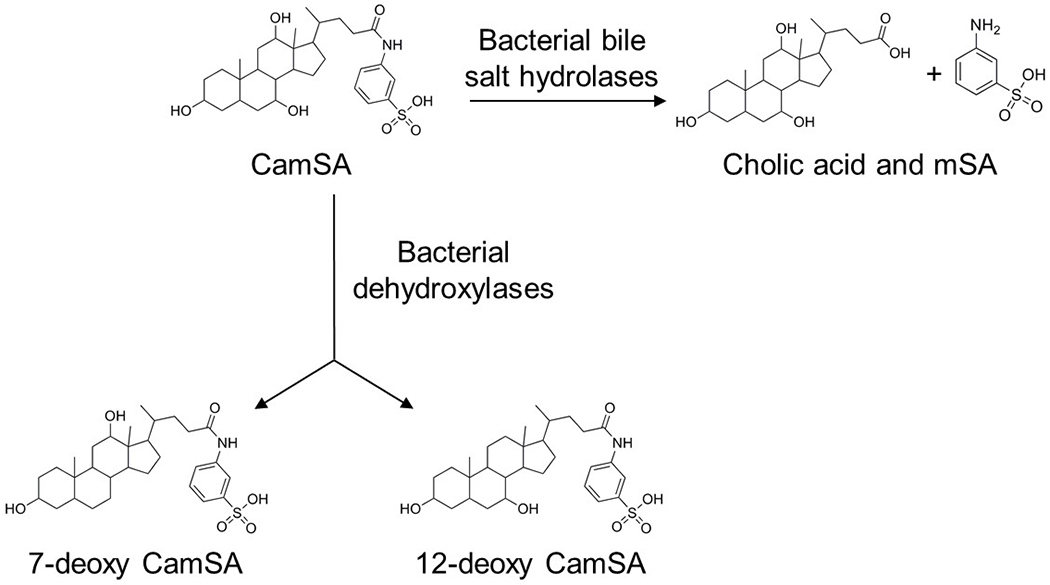
Bile salt hydrolases expressed by the GI microbiota can hydrolyze CamSA’s amide bond, resulting in cholate and metanilic acid (mSA). CamSA could potentially also be dehydroxylated at C-7 and C-12 by the gut microbiota to yield 7-deoxy-CamSA and 12-deoxy-CamSA, respectively.
As an antibiotic-associated infection, it is presumed that the bacteria found naturally in the GI tract provide a protective barrier against C. difficile colonization3,27. Indeed, antibiotic-depletion of the GI microbiota results in elevated levels of taurocholate and decreased levels of chenodeoxycholate (CDCA)25,28. Taurocholate, a primary conjugated bile salt, triggers the germination of C. difficile spores, ultimately resulting in vegetative C. difficile cells and the onset of CDI symptoms13,14,29. Conversely, CDCA, a primary unconjugated bile salt, has been shown to inhibit C. difficile spore germination in vitro30,31. The delicate balance between taurocholate, chenodeoxycholate, and other endogenously occurring bile salts is believed to dictate C. difficile spore germination and CDI progression in vivo14,24,25,31.
Since C. difficile spore germination inside a host is required for the establishment of disease, one approach to CDI management could be to block this process11,32–34. CamSA, a metanilic acid (mSA) derivative of taurocholate, was previously identified by our laboratory from a series of bile salt analogs with modifications along the side chain and/or cholate backbone (Fig. 1)30. CamSA is a potent inhibitor of taurocholate-mediated C. difficile spore germination in vitro and in vivo30,32.
Because CamSA can block C. difficile spore germination, we tested for its ability to prevent CDI in rodents. In the hamster model, treatment with CamSA alone was unable to prevent the onset of CDI but was able to double the mean time of death of infected animals. However, when CamSA was administered in conjunction with sub-clinical doses of vancomycin, 70% of the hamsters were protected and did not develop CDI symptoms even a month post-challenge35.
Interestingly, a single 50 mg/kg dose of CamSA was sufficient to completely prevent CDI symptoms in mice even though CamSA-treated mice shed C. difficile spores, but no vegetative cells, 72 hours post-challenge32. This indicates that C. difficile spore germination is inhibited in vivo for several days following a single CamSA dose27.
To remain active in the GI tract, CamSA should resist modification in vivo. Due to the susceptible amide bond, CamSA could be hydrolyzed into cholate and mSA by bacterial BSHs (Fig. 1)21. Indeed, approximately 80% of CamSA was hydrolyzed after 24 hours when incubated with pure cultures of either Bifidobacterium longum or Lactobacillus gasseri, two BSH-producing enteric bacteria27.
In order to be an effective CDI prophylactic, CamSA should be retained in the intestinal lumen to co-localize with C. difficile spores. Limited absorption from the GI tract may also reduce the possibility of systemic side effects and host toxicity. Our previous in vitro studies using Caco-2 monolayers support this model and suggested that CamSA is retained in the intestinal lumen27. Even more, differential uptake across the monolayer suggested that any systemic CamSA might be actively transported back into the intestinal lumen27.
In this study, we further characterized CamSA’s pharmacokinetic parameters. We observed that CamSA and its degradation product, mSA, are excreted slowly in the feces of both antibiotic-treated and antibiotic-untreated mice over the course of seven days. In antibiotic-treated mice, CamSA is found primarily in the intestines and the liver. Under these conditions, the degradation product mSA was only detected at very low levels in the kidneys. We suggest that systemic absorption, distribution, and degradation of CamSA is minimal in antibiotic-treated mice since the animals’ GI microbiota are compromised by antibiotic treatment. In contrast, in animals not treated with antibiotics, ex vivo and in vivo data show that CamSA is slowly degraded by the normal murine GI microbiota. Under non-antibiotic conditions, CamSA and its degradation product mSA can be found in the liver and intestines. Lower levels of mSA are also found in systemic circulation and kidneys. Given the presence of CamSA and mSA in the liver, we assayed for potential interactions between the two compounds and CYP3A4, a major liver P450 isozyme involved in drug metabolism and bile acid processing.
CamSA concentrations oscillate between the intestinal lumen and the liver. This suggests that CamSA likely simulates and is recognized as a bile salt and undergoes EHC in mice. Additionally, when mice were fed a diet containing cholestyramine, a bile salt sequestrant, neither CamSA nor mSA could be detected in liver. This further supports the idea that CamSA undergoes EHC. In this way, EHC could allow for a CamSA reserve to be established within an animal model. This pool could also serve as a mechanism for CamSA to be slowly released over an extended period following dosage. This is consistent with our data showing that a single CamSA dose is sufficient to protect mice from CDI. Steady bioavailability could allow CamSA to remain in the GI tract long enough to prevent CDI recurrences in susceptible patients.
Materials and Methods
Chemicals and Reagents.
CamSA, 7-deoxy-CamSA, and 12-deoxy-CamSA were synthesized by the Abel-Santos laboratory30. Sodium cholate, chenodeoxycholate (CDCA), taurocholate, metanilic acid (mSA), cholestyramine, cefoperazone, HistoDenz, PMA, and HPLC-grade solvents were obtained from Sigma-Aldrich Corporation (St. Louis, MO, USA). Artificial gastric juice was obtained from Ricca Chemical Company (Arlington, TX, USA). The Vivid™ CYP3A4 Green Screening Kit (Cat #P2857) was obtained from Thermo Fisher Scientific (Waltham, MA, USA). Clindamycin phosphate and ketoconazole was obtained from TCI (Portland, OR, USA). Metronidazole was obtained from Spectrum Chemical (Gardena, CA, USA). Microbiological media, colistin, vancomycin, gentamicin, sodium thioglycolate, ammonium acetate, HCl, sodium bicarbonate, and kanamycin were obtained from VWR (Radnor, PA, USA). C. difficile strain 630 was obtained from the American Type Culture Collection (ATCC).
Preparation of C. difficile Spores.
Frozen stocks of C. difficile strain 630 were streaked onto pre-reduced BHIS (brain heart infusion supplemented with 0.5% yeast extract, 0.1% L-cysteine, and 0.05% sodium taurocholate) plates and incubated overnight at 37°C in an anaerobic environment (10% CO2, 10% H2, and 80% N2) to yield single colonies. Liquid cultures of C. difficile were prepared by inoculating degassed BHIS (BHI supplemented with 5 mg/ml yeast extract) broth with a single C. difficile colony and incubated overnight. Aliquots (200 μl) from an overnight C. difficile culture were spread onto pre-reduced BHIS plates and incubated for 7 days to allow for sporulation. The resulting bacterial lawns were harvested by flooding the plates with ice-cold de-ionized water (DIH2O). The samples were pelleted by centrifugation at 8,800 xg and the supernatants were decanted. This procedure was repeated three times. Spores were then purified by density centrifugation through a 20% to 50% HistoDenz gradient. After discarding the HistoDenz solution, the spore pellet was washed three times with DIH2O, suspended in a sodium thioglycolate solution (0.5 g/l), and stored at 4°C until further use. Spores prepared through this method were consistently >95% pure.
Animal Manipulations.
Animal protocols were performed in accordance with the Guide for Care and Use of Laboratory Animals outlined by the National Institutes of Health. Protocols were reviewed and approved by the Institutional Animal Care and Use Committee (IACUC) at the University of Nevada, Uas Vegas. Weaned female C57BU/6N mice were obtained from Charles River Uaboratories (Wilmington, MA, USA) and housed in groups of five mice per cage, unless otherwise noted, at the University of Nevada, Uas Vegas animal care facility. All water, food, bedding, cages, and enrichment were sterilized prior to contact with animals. Upon arrival at the facility, the mice were quarantined and allowed to acclimate for at least one week prior to experimentation.
Metabolism of CamSA by Fecal Microbiota.
To determine the effect of antibiotics on microbiota-mediated CamSA degradation, we first provided mice (n=10) with autoclaved and sterile-filtered water containing kanamycin (0.4 mg/ml), gentamycin (0.035 mg/ml), colistin (850 U/ml), metronidazole (0.215 mg/ml), and vancomycin (0.045 mg/ml)36,37. Animals were allowed to drink the antibiotic cocktail ad libitum for three consecutive days with the antibiotic water refreshed daily to ensure biome disruption32. Mice received autoclaved water for the remainder of the experiment. A single dose of clindamycin (10 mg/kg) was administered by intraperitoneal (IP) injection on the fourth day of the experiment. Feces were collected from animals prior to treating with antibiotics, one day after the clindamycin shot, and one week after the clindamycin shot. Approximately 100 mg of feces was suspended in artificial gastric juice (5 ml) with or without 10 mM CamSA to produce a fecal slurry. Immediately after mixing, 100 μl of each slurry was removed, centrifuged, and 0.5 μl samples of the supernatant were spotted on silica thin layer chromatography (TUC) plates in triplicate and allowed to air dry (t = 0). Fecal slurries were maintained at 37 °C in an anaerobic chamber. Samples were collected and spotted on TUC plates after incubation for 0.5, 1, 2, 3, 4, 6, 8, 24, 48, 72 and 96 hours. Pure 10 mM CamSA and cholate solutions were spotted on each TUC plate as controls. CamSA spots were preliminarily identified by exposing to UV-light. TUC plates were then developed with 75% ethyl acetate/methanol. CamSA and cholate were visualized by spraying with 10% w/v phosphomolybdic acid (PMA)/ethanol solution followed by heating at 100 °C for 2 minutes. PMA treatment results in visible spots for bile salts. The relative amount of CamSA was determined by the color intensity of each spot using a GE Healthcare Typhoon 9410 Variable Mode Imager in densitometer mode and analyzed using ImageQuant TL 5.2 software27. Percent CamSA was derived by dividing the intensity of TLC spots obtained at different times by the intensity of the TLC spot before incubation.
Efficacy of Potential CamSA Metabolites in the Prevention of Murine CDI.
Purified C. difficile spores of strain 630 were prepared as described above. Groups of five mice were treated with antibiotic cocktail as described above. One day following the clindamycin injection (day 4 of the experiment), mice received neat DMSO (vehicle), 50 mg/kg CamSA, 50 mg/kg 7-deoxy-CamSA, 50 mg/kg 12-deoxy-CamSA, 50 mg/kg cholate, 50 mg/kg mSA, or a combination of cholate (50 mg/kg), and mSA (50 mg/kg) by oral gavage. On day 5, animals received 108 CFUs of C. difficile spores by oral gavage. One-hour post-challenge, animals received a second dose of DMSO or appropriate bile salt. A third dose was administered 24 hours post-challenge (day 6 of the experiment). Disease signs were scored using the rubric previously described27,32. Animals scored with “severe” CDI, displaying severe weight loss and wet tail, were immediately euthanized. Animals that were asymptomatic were monitored for up to 14 days post-challenge to track any delayed onset of CDI.
Antibiotic Animal Model to Test for CamSA ADME Parameter.
The murine CDI induction model used in this study was adapted from procedures published by Theriot et al38. Briefly, mice (n=5 per treatment group) were given either 0 mg/ml (“non-cpx” cohort) or 0.5 mg/ml (“cpx” cohort) solution of the cephalosporin antibiotic cefoperazone in water provided ad libitum for at least 5 days prior to CamSA administration. The water was refreshed every three days, or as needed. On the day of administration, mice were given 50 mg/kg CamSA dissolved in DIH2O via oral gavage and were separated into individual cages containing enrichment. Cpx mice remained on antibiotic water throughout the duration of the experiment.
Following CamSA administration, total mouse feces from each individual mouse was collected every 2 hours for the first 24 hours, then periodically over the course of a week. Fecal samples collected from cpx mice were stored at 4°C, while fecal samples collected from non-cpx mice were stored at −20°C to prevent BSH-associated CamSA degradation until they were processed. At the time of processing, individual total fecal samples were resuspended in DIH2O and vortexed until completely homogenized. The suspension was centrifuged to pellet insoluble fecal matter. The supernatant, containing mSA and/or CamSA, was filtered through a 0.2 μm PES syringe filter to remove particulates. The resulting filtrates from cpx mice were stored at room temperature and filtrates from non-cpx mice were stored at 4°C until separation and quantification by HPLC-MS. Reversed phase high-performance liquid chromatography (RP-HPLC) separation was conducted using a PRP-1 column from Hamilton Company (Reno, NV, USA). HPLC analyses and mass spectra were obtained using an Expression-L compact mass spectrometer (CMS) from Advion (Ithaca, NY).
A separate set of animals (n=5 per treatment group) were treated as above, and one animal per treatment group was sacrificed at 4, 12, 22, 32, and 120 hours post-CamSA administration. Livers (with attached gallbladders), kidneys, and stomachs with attached intestines were collected and stored at −20°C until processed. Blood was collected via heart puncture or by whole-heart harvest and stored at −20°C until processed. At the time of processing, livers with gallbladders, hearts, and kidneys were thawed and homogenized in DIH2O using a tissue grinder. Chyme was manually separated from the intestines and stomachs, mixed with DIH2O, and vortexed until completely homogenized. All homogenized samples were then centrifuged to pellet solid material. Acetonitrile was added to the liver homogenates to precipitate proteins, and then centrifuged until clarified. The supernatants collected from the blood/heart, kidney, and chyme samples were all filtered through a 0.2 μm PES syringe filter. The supernatants collected from the livers following acetonitrile treatment were filtered through a 0.2 μm nylon syringe filter to remove insoluble particulates. The resulting filtrates were then stored at 4°C until analysis by HPLC-MS.
Detection and Quantification of CamSA and mSA.
Processed mouse feces, liver, blood, kidney, and chyme preparations were subjected to RP-HPLC. Due to the large number of samples used in our study, we needed to develop an efficient method for separating CamSA and its metabolite mSA from fecal matter. Briefly, 10 μl samples were injected and separated using a Hamilton PRP-1 polystyrene divinylbenzene (PSDVB) column (4.1 x 250 mm; 7 μm). Separations were carried out using an isocratic elution of 40% acetonitrile (ACN), 5 mM ammonium acetate, and 0.1% formic acid with a flow rate of 1.3 ml/min at ambient temperature. Elution of CamSA and mSA was monitored by UV-visible absorption at 254 nm. Mass spectrometer (MS) detection was operated in the negative ionization mode following electrospray ionization (ESI) using source voltages of +3500 V and −2500 V, capillary voltage of 120 V, and source gas and capillary temperatures of 250°C. The presence of a sulfonate functional group in mSA and CamSA allowed both compounds to be ionized by the loss of a proton. Thus, the peak areas corresponding to the molecular weights of deprotonated CamSA (562.7 Da) and deprotonated mSA (172.2 Da) were identified and quantified using Data Express (Advion), and plotted against concentration, allowing for a standard curve to be established. Using these protocols, we were able to detect CamSA and mSA signals to a lower limit of approximately 70 ng (data not shown).
Interaction of CamSA and mSA with CYP3A4.
To test for interactions with CYP3A4, CamSA, mSA, and taurocholate were separately resuspended in DIH2O. Aliquots (40 μl) of CamSA, mSA, or taurocholate standards at increasing concentrations were added to 96-well clear bottom, black plates containing P450 BACULOSOMES® (baculovirus-infected microsomes) expressing a human isozyme of CYP3A4. The plates were incubated at room temperature for 10 minutes to allow the test compounds to interact with CYP3A4 in the absence of enzyme turnover. As a control for CYP3A4 inhibition, microsomes were treated with 10 μM ketoconazole, a known inhibitor of CYP3A439. Following the addition of the Vivid® Substrate to each well, fluorescence (excitation, 485 nm; emission 520 nm) was measured every minute for 1 hour. All experimental conditions were performed in triplicate and the final volume in each well was 100 μl.
Interaction of CamSA with Cholestyramine In Vitro.
To determine whether CamSA and/or mSA would bind to cholestyramine, varying concentrations of CamSA or mSA were mixed with a 20 mg/ml aqueous suspension of cholestyramine and incubated overnight at 37°C to mimic in vivo conditions. Following incubation, the samples were centrifuged to pellet the cholestyramine resin and supernatants were collected. To test the stability of the CamSA-cholestyramine complex in acidic environments, such as the upper GI tract, pelleted resins were treated using a modified version of the method by Manes and Schneider to recover bile salts from cholestyramine resin40. Specifically, the resin pellets were resuspended in 0.5 N aqueous HC1 and incubated for 1 hour at 37 °C with periodic vortexing every 15 minutes. The sample was centrifuged to pellet the cholestyramine resin, and the supernatants were collected. The resin was washed again with fresh 0.5 N aqueous HC1. Supernatants from the two washes were pooled for each sample and neutralized using 1 M aqueous sodium bicarbonate. All samples were filtered through a 0.2 μm PES syringe filter and then stored at 4°C until analysis by HPLC-MS. To test the ability to recover bound CamSA and mSA from the cholestyramine resin, we repeated this process using 0.5 N ethanolic HC1.
Finally, to test the ability to recover resin-bound CamSA from mouse feces, feces from a cpx mouse was mixed with a 20 mg/ml aqueous suspension of cholestyramine resin and varying concentrations of CamSA and then homogenized by vortexing. The resulting homogenized samples were incubated at 37 °C. Samples were then washed with 0.5 N ethanolic HC1 and processed using the same method as above.
Effect of Cholestyramine on CamSA ADME Parameters In Vivo.
Six individually housed cpx mice were started on feed containing 4% w/w (n=3) or 0% w/w (n=4) cholestyramine 24 hours prior to CamSA administration. The mice remained on cholestyramine feed throughout the duration of the experiment. Total feces from each individual mouse was collected every 2 hours for the first 22 hours post-CamSA administration and stored at 4°C. Individual total fecal samples were then resuspended in 0.5 N ethanolic HC1 and incubated at 37°C for 1 hour with periodic vortexing. The suspension was centrifuged to pellet insoluble fecal matter. The supernatants were collected and neutralized using 1 M sodium bicarbonate. The samples were then concentrated by evaporation, and the final volume of each sample was adjusted to 400 pi with DIEEO. The concentrated samples were then filtered through a 0.2 μm PES syringe filter to remove particulates, and stored at 4°C until analysis by HPLC-MS. Animals were sacrificed at 22 hours post-CamSA administration, and livers with attached gallbladders were harvested and stored at −20°C. Liver samples were processed and filtered as previously described.
Results
Metabolism of CamSA by Gastrointestinal Microbiota.
A single dose of CamSA, an artificial bile salt, offers multiday protection from murine CDI by inhibiting C. difficile spore germination. To be effective at preventing C. difficile spore germination in vivo, CamSA should remain unmodified during the transit through the GI tract. When incubated with artificial gastric or intestinal juices, no CamSA degradation was observed for 24 hours under both conditions tested27. However, CamSA was slowly hydrolyzed to cholate and mSA when incubated with supernatants of growing cultures of Lactobacillus gasseri and Bifidobacterium longum, two BSH-producing gut bacteria27. Given this finding, we wanted to determine CamSA’s stability in the murine microbiota with and without antibiotic treatment. When administered to healthy mice that had not been treated with antibiotics, CamSA was slowly hydrolyzed to cholate and mSA by the murine GI microbiota (Fig. 2). The percent CamSA recovered at 8 hours is significantly lower than its starting value (P = 0.0016, paired t-test). In comparison, the GI microbiota from mice that had been treated with an antibiotic cocktail were unable to efficiently hydrolyze CamSA. In fact, it took over 96 hours to degrade 50% of the total dosed CamSA by the gut microbiota of these antibiotic-treated mice (P = 0.0039, paired t-test). Furthermore, there is a significant difference in CamSA’s stability in the murine microbiota by 8 hours between mice treated with or without antibiotics (P < 0.0000001, 2-sample t-test). Fecal samples were also obtained from antibiotic-treated animals one week after their last antibiotic dose to determine if the recovered microbiota affected CamSA hydrolysis. These samples degraded CamSA at a similar rate as feces from animals that had never received antibiotics (data not shown).
Figure 2. Hydrolysis of CamSA by fecal bacteria.
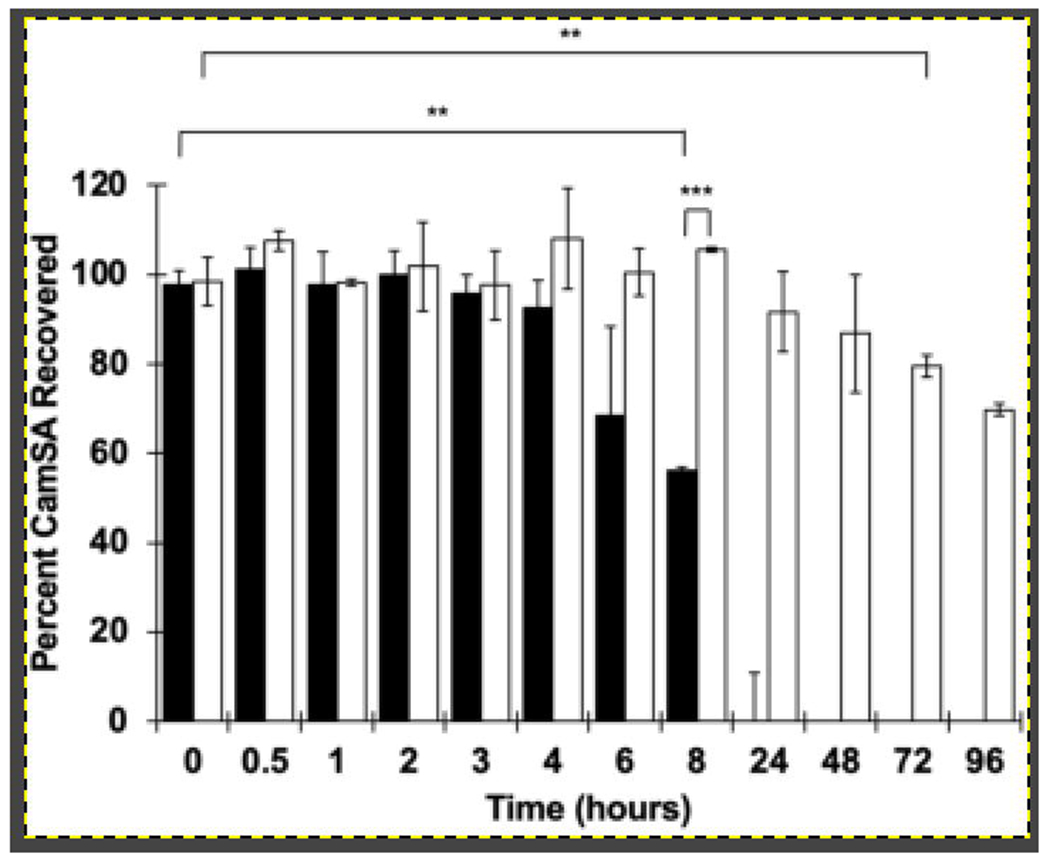
CamSA is slowly hydrolyzed into cholate and mSA by the GI microbiota of naive mice but is stable against the microbiota of mice treated with an antibiotic cocktail. CamSA was incubated with feces collected from mice without antibiotic treatment (black bars), or feces from antibiotic-treated mice (white bars). The data represent the averages from three independent measurements, and error bars represent the standard deviations. Statistical significance was determined using matched-pair t-tests and a two-sample t-test assuming unequal variances. Family-wise error rate is set at 0.01. **P < 0.01; ***P < 0.001.
Efficacy of Potential CamSA Metabolites in the Prevention of Murine CDI.
CamSA and some of its potential microbial degradation metabolites were assayed for their ability to prevent CDI by inhibiting C. difficile strain 630 spore germination in vivo. When challenged with C. difficile strain 630 spores, CamSA-treated mice developed little to no signs of CDI (Fig. 3). In contrast, mice treated with an equimolar mixture of cholate and mSA to mimic BSH-based deconjugation of CamSA developed severe CDI and reached clinical endpoint 48 hours post-challenge (Fig. 3). As expected, mice treated with either cholate or mSA alone also reached clinical endpoint within 48 hours (data not shown). Two potential dehydroxylated metabolites of CamSA were also examined. Mice treated with 12-deoxy-CamSA developed similar symptoms as mice treated with the mixture of cholate and mSA and reached clinical endpoint 48 hours post-challenge. Mice treated with 7-deoxy-CamSA also developed CDI, but the symptoms were not as severe. There are highly significant differences (P < 0.00001, 2-sample t-tests) in CDI severity between mice treated with 12-deoxy-CamSA or a mixture of cholate and mSA versus mice treated with 7-deoxy-CamSA or intact CamSA at 24- and 48-hours post-challenge, respectively.
Figure 3. Effect of potential CamSA metabolites on CDI severity in spore challenged mice.
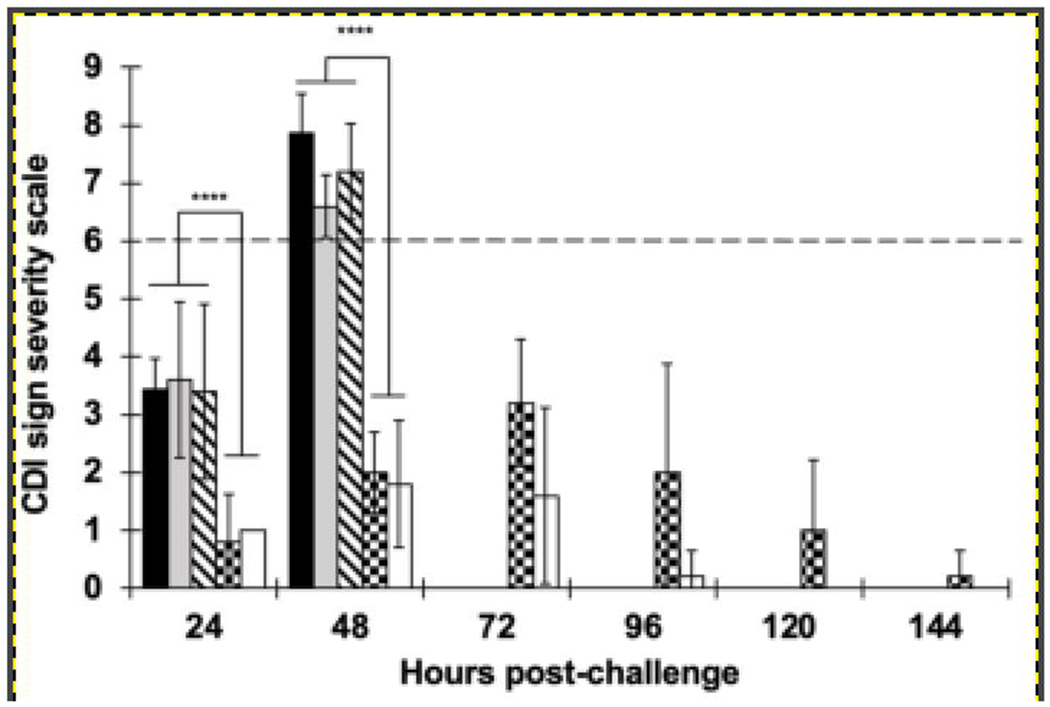
CamSA could be deconjugated and/or dehydroxylated by the GI microbiota. To test for the effect of CamSA metabolites, CDI-susceptible mice were treated with DMSO (black bars), cholate/mSA mixtures (gray bars), 12-deoxy-CamSA (diagonal-dashed bars), 7-deoxy-CamSA (checkered bars), or intact CamSA (white bars). Clinical endpoint (dashed line) was set at > 6 in the CDI severity scale27,32. Mice treated with 12-deoxy-CamSA or a mixture of cholate and mSA developed severe CDI signs (score > 6) similar to DMSO-treated animals and reached clinical endpoint 48 hours post-challenge. In contrast, mice treated with 7-deoxy-CamSA developed only moderate CDI signs. CamSA treated mice developed little to no signs of CDI. The data represent the averages from independent measurements, and error bars represent the standard deviations. Statistical significance was determined using two sample t-tests assuming unequal variances. ****P < 0.0001.
Metabolism and Excretion of CamSA.
After administration of CamSA to cefoperazone-treated (cpx) mice, we recovered approximately 30% of the total dosed CamSA from feces over the course of a week (Fig. 4A). mSA was not observed in feces at any time point throughout the course of these experiments with cpx mice. In contrast, most of the CamSA recovered from untreated (non-cpx) mice had been deconjugated and was detected as mSA (Fig. 4C). However, we were still able to detect low levels of intact CamSA from the feces of non-cpx mice (Fig. 4B). Altogether, between mSA and CamSA, approximately 15% of the total dosed drug was recovered from feces of non-cpx mice over the course of a week.
Figure 4. Average CamSA and mSA recovery in feces.
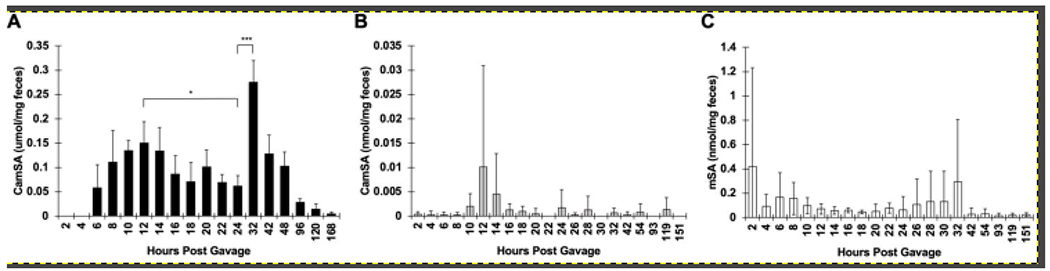
Mouse feces was collected at predetermined time points following CamSA administration. (A) CamSA recovered from cpx mice, (B) CamSA recovered from non-cpx mice, and (C) mSA recovered from non-cpx mice. The data represents the averages from five independent samples (n=5) for each treatment group, and error bars represent the standard deviations. Statistical significance was determined using a paired t-test. *P < 0.05; **P < 0.01; ***P < 0.001.
Surprisingly, we observed a well-synchronized, time-dependent oscillating pattern of CamSA concentrations in the feces of cpx mice. CamSA excretion starts at around 6 hours post-administration and reaches a maximum between 8 and 14 hours. CamSA concentration in feces then decreases and reaches a minimum between 18 and 24 hours. CamSA concentration increases again reaching a second excretion maximum at 32 hours post-administration (Fig. 4A). CamSA excretion at 24 hours is significantly lower than the excretion at 12 hours (P = 0.01, paired t-test) and at 32 hours (P = 0.00003, paired t-test).
A similar oscillating pattern for mSA concentrations was observed in the feces of non-cpx mice (Fig. 5C), However, whereas all cpx mice exhibited a synchronized CamSA excretion pattern (Fig. 5A), non-cpx mice show individual variability, with animals excreting maximum CamSA (Fig. 5B) and mSA (Fig. 5C) at different time points. Most non-cpx mice exhibited at least one large early peak, indicating high concentrations of mSA in feces, within the first 12 hours, followed by a period of low Msa concentrations and then a second spike of higher mSA concentrations between 24 and 42 hours post-CamSA administration (Fig. 5C).
Figure 5. Total CamSA and mSA recovered from individual animal feces.

Mouse feces was collected at predetermined time points following CamSA administration. (A) CamSA recovered from cpx mice. The average of this data is shown in Fig. 4A and shows synchrony in CamSA excretion between individual mice. (B) CamSA recovered from non-cpx mice. The maximum amount of CamSA recovered at a single time point is four-fold lower than for cpx mice. CamSA recovery is asynchronous between individual animals but show a similar excretion trend. (C) mSA recovered from non-cpx mice. The amount of mSA recovered from non-cpx mice is approximately 40-fold higher than the amount of CamSA recovered from the same animals, indicating CamSA degradation by the mouse microbiota. mSA recovery is asynchronous between individual animals but shows a similar excretion trend. Lines connecting dots were included to aid visualization of data from each time point and do not indicate concentrations between time points. Each colored line represents an individual mouse and no statistical significance tests are appropriate for these line graphs. Average of the data with corresponding statistical significance tests are shown in Fig. 4A, 4B and 4C.
Absorption and Distribution of CamSA.
Given that only 30% of the CamSA dose was recovered from feces of cpx mice and 15% from non-cpx mice, we rationalized that CamSA and/or mSA could be absorbed from the intestinal lumen and distributed to other tissue and organ groups. Liver, blood/heart, kidney, and chyme samples were collected at predetermined time points and analyzed for the presence of CamSA and mSA. Due to time limitations in the collection, processing, and analysis of multiple tissue samples, a single animal was used per time point to sample organ and tissue data.
CamSA was detected from liver samples of cpx mice in all five time points tested, with hepatic CamSA concentration peaking at 22 hours (Fig. 6). The total amount of CamSA recovered from the cpx liver samples was approximately 10-fold less than what was recovered from the feces of cpx mice. Both CamSA and mSA were detected in the livers of non-cpx treated mice (Fig. 6A). Similarly, the total combined amount of CamSA and mSA recovered from the non-cpx liver samples was approximately 10-fold less than what was recovered from the feces of non-cpx animals. We were unable to detect CamSA or mSA in the blood of cpx mice at any time point. In the non-cpx mice, CamSA was not detected in blood at any time point, and mSA was only detected in blood at the 22-hour time point (Fig. 6B).
Figure 6. Total CamSA and mSA quantified from mouse organs.
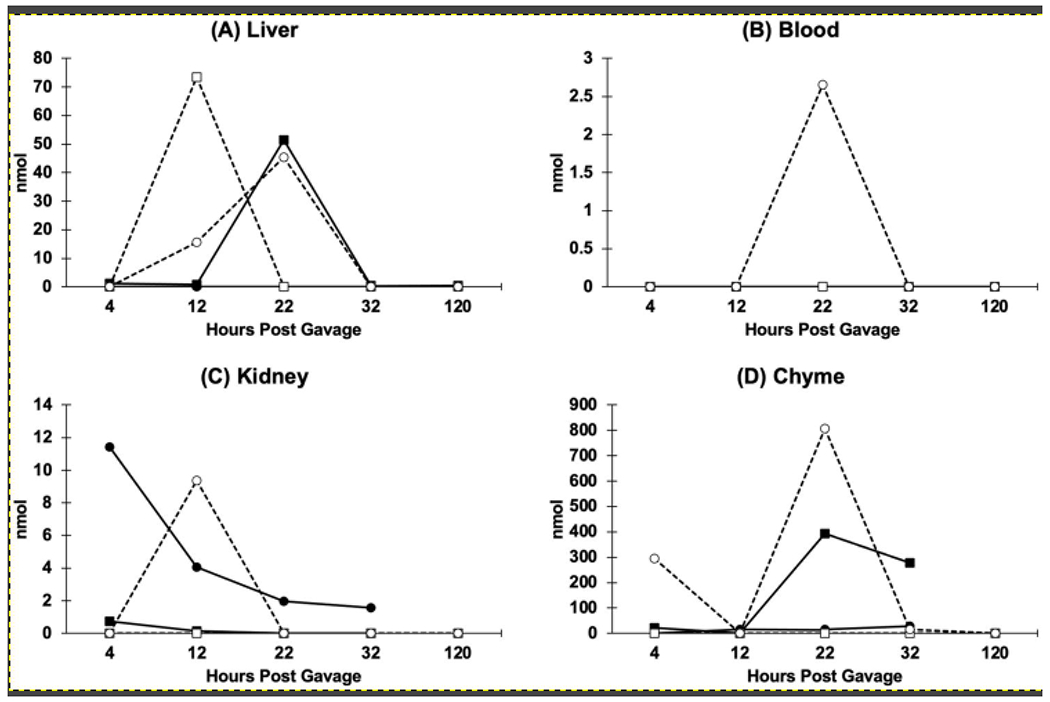
Mice were sacrificed at 4, 12, 22, 32, and 120 hours post-CamSA administration, and (A) livers, (B) blood, (C) kidneys, and (D) intestines were collected at the time of sacrifice. Tissues were homogenized and extracted. CamSA (squares) and mSA (circles) from cpx (closed symbols) and non-cpx (open symbols, dashed lines) animals were quantified by HPLC-MS. Each time point represents a single animal and hence no statistical tests are appropriate. Lines connecting dots were included to aid visualization of data from each time point and do not indicate concentrations between time points.
In both cpx and non-cpx mice, mSA, rather than CamSA, was detected in kidney samples (Fig. 6C). CamSA was only present at negligible amounts in two of the time points, 4- and 12-hours, in cpx mice (Fig. 6). Collectively, the amount of CamSA and mSA recovered from the kidneys of cpx mice was approximately two orders of magnitude less than what was recovered from the feces of cpx mice. In non-cpx mice, mSA was only detected in kidney at the 12-hour time point, also at approximately two orders of magnitude lower than what was recovered from the feces of non-cpx mice.
Similar to feces, CamSA was predominantly recovered from the chyme of cpx animals, while mSA was mostly found in chyme of non-cpx animals (Fig. 6D). More specifically, larger amounts of CamSA were detected in the chyme of cpx mice at 22- and 32-hours, and most mSA was detected in the chyme of non-cpx mice at 4- and 22-hours (Fig. 6D). Collectively at all time points, CamSA and mSA recovered from the chyme of cpx mice represented about one-third of the amount previously recovered from the feces of cpx mice (or 10% of the total dosed CamSA), whereas mSA recovered from the chyme of non-cpx mice represented about 85% of the amount previously recovered from the feces of non-cpx mice (or 13% of the total dosed CamSA).
Interaction of CYP3A4 with CamSA and mSA.
Given that CamSA was found in the liver, we wanted to determine if CamSA interacted with detoxifying liver cytochrome enzymes. Based on our described test conditions, we detected a weak interaction for both CamSA and mSA with CYP3A4. Through these initial assays however, we were unable to differentiate whether this interaction occurred through inhibition of CYP3A4 activity, or if CamSA or mSA served as an alternative substrate. Under the assumption that CamSA could inhibit CYP3A4 activity, the IC50 was determined (IC50 = 0.62 ± 0.11 mM) (Fig. 7A). Under a similar assumption, the IC50 of mSA was determined (IC50 = 17.5 ± 1.1 mM) (Fig. 7B). As a control, we also determined the effect of taurocholate on CYP3A4 activity. CYP3A4 was approximately 10-fold less susceptible to inhibition by taurocholate (IC50 = 5.99 ± 0.23 mM) compared to CamSA when assayed under similar conditions (Fig. 7C). CYP3A4 is completely inhibited when treated with 10 μM ketoconazole.
Figure 7. Effect of CamSA and taurocholate on CYP3A4 activity.
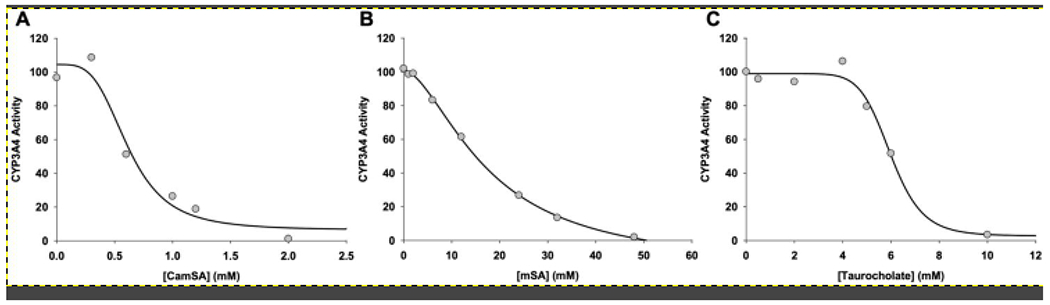
BACULOSOMES® expressing CYP3A4 were assayed for their ability to convert a non-fluorescent Vivid Substrate® into a highly fluorescent byproduct in the presence of (A) CamSA, (B) mSA, or (C) taurocholate. As a control, CYP3A4 was incubated with ketoconazole at a final concentration of 10 μM39. At this concentration of ketoconazole, CYP3A4 activity was completely inhibited.
Interaction of CamSA with Cholestyramine.
The CamSA degradation product, mSA, bound completely to the cholestyramine resin in vitro at all concentrations tested. Furthermore, the binding of mSA to cholestyramine was irreversible and, as a consequence, we were unable to recover any mSA from the resin even when the complex was stripped under strong acidic conditions. Hence, we focused our cholestyramine studies only on the recovery of CamSA.
A 4:3 cholestyramine-to-CamSA mass ratio resulted in nearly complete sequestration of CamSA in vitro. This suggested that all the CamSA expected in the GI tract of mice in vivo following a standard dose would be bound to the resin if their diet was supplemented with 4% cholestyramine. When 0.5 N aqueous HCl was used to strip CamSA from cholestyramine resin in the absence of feces, less than 1% of CamSA was recovered. However, when 0.5 N ethanolic HCl was used as a more stringent stripping agent, up to 75% of the total dosed CamSA could be recovered. Unfortunately, when this procedure was repeated in the presence of fecal matter, we recovered less than 10% of the total dosed CamSA. Consistent with our in vitro experiments, 0.5 N ethanolic HCl treatment proved unreliable to quantitatively recover CamSA from freshly collected fecal samples from gavaged mice (data not shown).
We detected CamSA from liver samples from three of the four mice that did not receive cholestyramine in their feed (Fig. 8). The quantities were comparable to what we previously observed from liver at 22 hours post-CamSA administration in a cpx mouse (Fig. 6A). Interestingly, under the same conditions, we were unable to detect CamSA in the livers from cpx mice that received cholestyramine.
Figure 8. Effect of cholestyramine on CamSA and mSA recovery in liver.
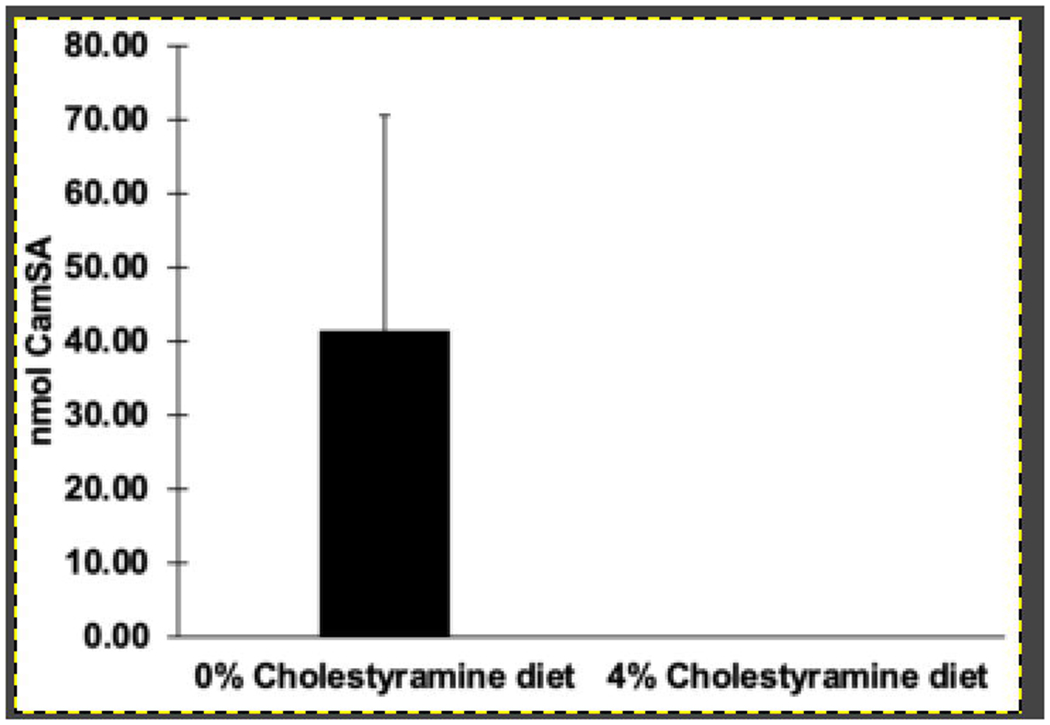
Mice that had been fed with 0% cholestyramine (n=4) or 4% cholestyramine (n=3) were sacrificed 22 hours post-CamSA administration, and their livers with attached gallbladders were collected. CamSA recovered from liver was quantified by HPLC-MS.
Discussion
The pharmacokinetics of most drugs follow a two-step model: a rapid increase followed by an exponential decrease of drug concentration41. Due to rapid drug clearance, most drugs must be administered as multiple doses to maintain therapeutic levels. In contrast, a single 50 mg/kg dose of CamSA, a potent inhibitor of C. difficile strain 630 spore germination, was sufficient to completely protect mice from CDI, even though animals continually shed C. difficile spores in their feces throughout the course of four days27,30,32. Because of these unexpected results, we sought to elucidate the pharmacokinetic parameters of CamSA by characterizing its absorption, distribution, metabolism, and excretion in the murine model of CDI.
For anti-germinants to be effective at preventing C. difficile spore germination in vivo, they should remain unmodified during transit through the GI tract. A previous study performed by Howerton et al. demonstrated that CamSA was stable against artificial gastric and intestinal juices, but could be hydrolyzed by two bacteria-produced BSHs in vitro21.
To address the stability of CamSA to the complete murine microbiota, CamSA was incubated with feces collected from mice with and without antibiotic treatment. In these experiments, CamSA was more resistant to hydrolysis by the GI microbiota of animals treated with an antibiotic cocktail than to the GI microbiota of animals not given antibiotics (Fig. 2). Even more, feces collected from animals one week after the last treatment with an antibiotic cocktail degraded CamSA at similar rate as feces from animals that had never received antibiotics, indicating a reestablished biome capable of degrading CamSA. Hence, it seems that antibiotic treatment depletes BSH-producing bacteria, allowing CamSA to remain stable in mice.
Since we showed that CamSA is barely hydrolyzed by the GI microbiota of mice that had been treated with an antibiotic cocktail, we wanted to confirm that an intact CamSA structure is needed to protect mice from CDI. Due to the highly complex nature of a fecal metabolite composition, we only tested the most likely degradation products of CamSA for anti-germination and CDI prevention activity. In vitro germination assays showed 12-deoxy-CamSA could inhibit C. difficile spore germination with an IC50 = 6.5 ± 0.20 mM, approximately 100-fold weaker than CamSA30. In vitro analysis of cholate and mSA found neither compound could inhibit spore germination. In fact, in our hands and in agreement with other previously published studies, cholate could stimulate spore germination and induce colony formation13,31. Spore germination is neither induced nor inhibited with mSA in vitro. When assessing these compounds in vivo, we found that the dehydroxylated and hydrolyzed CamSA metabolites are less efficacious than intact CamSA in preventing murine CDI (Fig. 3). These data strongly suggest that CamSA, and not its metabolites, is responsible for CDI prevention.
Since CamSA could prevent CDI in the mouse model, we hypothesized that this anti-germinant should be found primarily in the intestinal lumen where it co-localizes with C. difficile spores. Hence, we expect a majority of the total dosed CamSA to be excreted in the feces. The intricate makeup of feces necessitated a method for separating and detecting CamSA and its metabolites from the complex fecal matrices. Thus, we developed a RP-HPLC/MS method that allowed for intact CamSA and its degradation product mSA to be quantified in feces and tissues
Cholate, the other byproduct of CamSA deconjugation (Fig. 1), was not analyzed by RP-HPLC/MS since cholate is a naturally occurring bile salt found in the mouse GI tract. Furthermore, cholate is not UV active which complicates its detection in complex matrices. Nevertheless, cholate can be detected by ESI-MS due to its ionizable carboxylate group. Using our HPLC protocols on a defined mixture, cholate elutes 2 minutes after CamSA, thus ensuring that cholate does not interfere with the quantification of either the mSA or CamSA signal (data not shown). In any case, if CamSA becomes deconjugated, mSA and cholate would be produced at equimolar ratios. Hence, quantification of mSA allows us to indirectly calculate the amount of cholate formed from CamSA.
We found two very distinct fates for CamSA depending on the antibiotic status of the tested animals. We initially quantified CamSA from the feces of both cefoperazone-treated (cpx) and -untreated (non-cpx) mice. Following CamSA administration, we recovered approximately 30% of the total dosed CamSA from cpx mice over the course of a week (Fig. 4A). Using our cpx mice as a model, we expected the deconjugation of CamSA to be minimal following depletion of the gut flora (Fig. 2). Indeed, we were unable to detect any mSA in the feces of cpx mice, indicating that the gut dysbiosis caused by antibiotic administration allows CamSA to remain stable for up to seven days in mice.
In contrast, most of the CamSA recovered from non-cpx mice had been deconjugated and detected as mSA (Fig. 4C). This was expected as the non-cpx mice should have an intact microbiome capable of hydrolyzing CamSA’s amide bond (Fig. 2). We were, however, still able to detect minute amounts of CamSA from the feces of non-cpx animals (Fig. 4B). Because both intact CamSA and its degradation product mSA were excreted in the feces of non-cpx mice, we calculated the total amount of CamSA as the sum of both compounds. Altogether, between mSA and CamSA, we recovered approximately 15% of the total dosed drug from the feces of non-cpx mice over the course of a week (Fig. 4B–C). Hence, in untreated animals, the normal gut biome leads to the hydrolysis of most CamSA and the release of mSA within two days.
Although CDI in humans is associated with the use of multiple different classes of antibiotics including cephalosporins, the established murine model of CDI requires pre-treatment with either an antibiotic cocktail or cefoperazone to trigger intestinal dysbiosis36–38. Although the antibiotic regimens are different, the resulting murine CDI signs are indistinguishable between the two models. We found similar agreements between our data. While the ex vivo data identifying potential CamSA degradation by fecal microbiota were obtained from the antibiotic cocktail mouse model (Fig. 2), we observed a similar in vivo CamSA degradation pattern in the cefoperazone mouse model (Fig. 4A). In both cases, a lack of antibiotic treatment results in the degradation of CamSA into mSA, whereas antibiotic treatment leads to the stabilization of intact CamSA.
Since we could only recover a fraction of the total dosed CamSA from the feces in both cpx and non-cpx animals, we hypothesized that CamSA might have been absorbed into systemic circulation from the intestinal lumen. Previous studies using an in vitro Caco-2 assay for intestinal permeability suggested that CamSA has limited intestinal permeability and should be retained in the intestinal lumen27. Moreover, the permeability coefficients further suggest that CamSA is actively pumped into the intestinal lumen. Nevertheless, it is possible that CamSA may be absorbed into systemic circulation from the intestinal lumen. Thus, we analyzed blood samples for CamSA and mSA. In accordance with the Caco-2 permeability data, we were unable to detect any CamSA from the blood of either cpx or non-cpx animals (Fig. 6). Similarly, mSA levels were below our detection levels for all samples except for a single time point from one non-cpx animal. We hypothesize that at the 22-hour time point, a small amount of spillover from EHC could have occurred. In line with this hypothesis, we consistently observed the highest quantities of CamSA/mSA in the liver samples at this time point.
The presence of small amounts of mSA in the blood prompted us to quantify CamSA and mSA from other murine tissues. We were able to detect low levels of CamSA and mSA at several distinct time points in the livers of both cpx and non-cpx animals (Fig. 6). Significantly, the presence of CamSA in the liver and absence from the bloodstream suggests a mechanism whereby CamSA could bypass systemic circulation to localize into the liver. Indeed, a majority of bile salts are absorbed from the ileum and colon through the mesenteric vein and transported back to the liver sinusoids through the portal vein42. Given the structure of CamSA, these data suggest that CamSA is being recognized as a bile salt by the EHC and partitioned between the intestines and the liver.
The liver serves as the body’s major detoxification organ and these processes are catalyzed by cytochrome P450 (CYP) enzymes43,44. Inhibition of these enzymes can lead to drug-drug interactions resulting in drug-induced toxicity45. CYP3A4 is the most abundant liver CYP and has been shown to interact with and metabolize bile salts44,46,47. Specifically, CYP3A4 is involved in the detoxification of bile salts in the liver by oxidation or hydroxylation46.
The presence of CamSA and mSA in the liver prompted us to study whether our prophylactic compound or its metabolite could affect CYP3A4 activity. We identified a weak interaction between CYP3A4 and CamSA. These assays, however, could not distinguish if the apparent interaction occurred through CYP3A4 inhibition, or if either CamSA or mSA served as alternative substrates for CYP3A4. Assuming that CamSA inhibited CYP3A4 activity either competitively or noncompetitively, the IC50 value was determined to be 0.62 mM (Fig. 7). This IC50 represents concentrations that are at least 1,000-fold higher than the CamSA concentration required for inhibiting C. difficile spore germination in vitro30. From our data, the highest CamSA concentration found in the liver was calculated to be approximately 140 μM. Similarly, the IC50 value of mSA was determined to be 17.5 mM, and the highest mSA concentration found in the liver was approximately 20 μM. Thus, under our normal dosage regime, we do not expect CamSA or its degradation product mSA to notably affect CYP3A4 activity in vivo, even though the precise mechanism of the interactions with the enzyme remain to be determined.
Since traces of mSA were found in the blood (Fig. 6), mSA could have been distributed to the liver following absorption from systemic circulation. However, we cannot rule out the possibility that EHC could also transport mSA to the liver in a manner similar to CamSA. In this scenario, the presence of mSA in the blood could be attributed to spillover from EHC.
The presence of mSA in systemic circulation would also explain the low levels of mSA in some kidney samples. This is a typical process; a variety of compounds that spill over into systemic circulation, including bile salts, are often captured and filtered out by the kidneys until they are ultimately excreted in the urine.
We also examined the chyme from cpx and non-cpx animals. As expected, we detected CamSA and mSA at levels comparable to feces. The amount of CamSA and mSA recovered from chyme was at least 10-fold higher than in other organs and 300-fold higher than what was detected in blood. From the chyme of cpx animals, we recovered approximately 10% of the total administered drug in the form of CamSA across five time points (Fig. 6D). Most of the drug recovered from the chyme of non-cpx animals was detected as mSA, showing that CamSA is degraded during its intestinal passage by the normal gut flora. We recovered approximately 13% of the total administered drug from the chyme of non-cpx mice across five time points.
It should be noted that feces collection was performed in a nearly continuous manner (every two hours) for multiple animals, whereas chyme was only collected at selected discontinuous time points where each time point corresponded to a single and different animal. Nevertheless, the total amount of CamSA and mSA recovered in both experiments were within a three-fold difference of one another.
Collectively from the feces, organs, and chyme, we were able to recover approximately 40% and 25% of the total administered CamSA from cpx and non-cpx animals, respectively. We were unable to test for other potential CamSA metabolites and this could account for some of the missing CamSA. Furthermore, given that only one animal was sacrificed per time point to sample for organ and chyme, the accounting of CamSA can only be determined semi-quantitatively. Additional sampling experiments will need to be conducted to better quantify the distribution of CamSA and its metabolites in vivo.
CamSA did not exhibit excretion kinetics similar to most orally-administered drugs, where there is first a rapid increase in drug concentration, followed by an exponential decline as the drug is metabolized and/or excreted. Instead, we found that intact CamSA was retained in the antibiotic-treated mouse for an astonishing 7 days post-administration.
Enterohepatic circulation involves the absorption and transfer of a compound from the intestine into the liver, secretion into bile, and transport back into the intestine. This circulation can be clinically relevant to the pharmacokinetics of a drug by affecting the drug’s bioavailability and prolonging the time necessary to completely eliminate the drug48. In addition, EHC can affect the specific metabolic degradation pathway of a drug49.
The synchronized, periodic nature of CamSA excretion in feces of cpx mice suggests CamSA undergoes EHC in mice (Fig. 4A). This hypothesis is further supported by the fact that CamSA is present in the cpx murine liver and absent from systemic circulation. Most importantly, the circulation of CamSA through the liver and gallbladder would potentially allow these organs to serve as a reservoir for the drug, thereby increasing the duration of its pharmacological activity if CamSA levels in the intestine can be continuously replenished by biliary excretion50. A similar pattern was previously described by Roth et al, suggesting the EHC of ochratoxin A in mice51. We suggest that since CamSA has a cholate backbone, it is recognized by EHC and recycled between the intestines and the liver. EHC serves as a continual, pulsing release mechanism allowing CamSA levels to asynchronously oscillate in the murine intestine.
The permanence of CamSA in the GI tract could potentially explain how a single dose of CamSA provides multi-day protection from CDI in mice even though they continually shed C. difficile spores in their feces for several days post-challenge27,32. While EHC may be associated with an increase in the vulnerability of liver cells to drug toxicity52, CYP3A4 assays and previous research on CamSA-treated mice did not indicate any signs of acute toxicity or damage to GI tissue32.
While the CamSA concentrations secreted by non-cpx mice were relatively low, we noticed a very similar periodic pattern for the concentrations of the deconjugation product, mSA. However, the excretion pattern was less synchronized (Fig. 5B–C). Due to this high degree of individual excretion variability at each time point, we decided to examine the data for each individual mouse (Fig. 5). Once again, we see synchronized waves of CamSA secretion in the feces of cpx mice (Fig. 5A). While the secretion pattern of mSA from non-cpx mice is far less synchronized, each animal generally experiences multiple peaks of high mSA secretion in feces, the first occurring between 0 and 12 hours post-CamSA administration and another occurring between 24 and 42 hours post-CamSA administration, with a period of low excretion between them (Fig. 5B–C). Furthermore, the concentration of mSA in the feces of non-cpx mice is mostly undetectable beyond the first two days post CamSA administration. We suggest that mSA permanence in non-cpx mice is mostly related to the degradation kinetics of circulating CamSA.
The presence of multiple peaks in a concentration-vs-time graph may occur by several different mechanisms53. For example, changes in gastric acidity could affect its stability or its absorption into other systems. In addition, varying rates of GI motility may affect the concentration of drug excreted in the feces during any given time point. The presence of both compounds in the liver and gallbladder, as well as the relative absence of CamSA from the blood (Fig. 6), further support our hypothesis that the multiple peaks observed in our chromatograms are the result of the EHC of CamSA, rather than some other mechanism.
To further characterize the pharmacokinetic model of CamSA entering EHC, we tested the binding of CamSA and mSA to the bile salt sequestrant cholestyramine in vitro, as well as the effects of co-administration of CamSA and cholestyramine in vivo. Cholestyramine is known to inhibit EHC by binding bile salts and forcing their excretion54.
Since CamSA is degraded into mSA in non-cpx mice and mSA could not be recovered from cholestyramine, we focused on testing cholestyramine only in cpx mice. Our experiments showed that cholestyramine resin efficiently binds CamSA in vitro (data not shown). CamSA was not recovered from cholestyramine even when extracted with aqueous HCl, indicating that the CamSA-cholestyramine complex is likely stable at the conditions found in even the harshest environments within the GI tract. We therefore expect cholestyramine to bind CamSA in the presence of the stomach’s stringent conditions.
We detected CamSA in the feces of cholestyramine-treated cpx mice. However, as expected from our in vitro binding experiments, CamSA recovery from feces of cholestyramine-treated mice was inconsistent. Hence, quantification of CamSA in these samples was not possible. We suspect that CamSA is strongly bound to the resin and the complex is sequestered in the fecal matrix, making CamSA extraction a difficult process.
In contrast to the cholestyramine-untreated cpx mice, our results show that CamSA was undetectable in the liver of three different cholestyramine-treated cpx mice at 22 hours post administration of CamSA (Fig. 8). These findings lend further support to the hypothesis that CamSA is undergoing EHC and that this process can be disrupted by co-administration of CamSA with bile salt sequestrants.
These data are encouraging for clinical development of CDI prophylactics. We envision that our proposed anti-germination therapies would be administered to high risk CDI patients undergoing antibiotic treatment. The microbiota-depleted gut of CDI patients would ensure that CamSA is stable throughout the treatment timeframe. The EHC of CamSA could effectively serve as a slow-release system that will reduce the number of anti-germinant doses required for effective CDI prevention.
Acknowledgements/Grant Support
This work was supported by the National Institutes of Health (grant R01-AI109139). A.H. was supported by a Nevada State College Provost-sponsored SEED Grant.
Abbreviations
- BHI
brain heart infusion
- BSH
bile salt hydrolase
- CDI
Clostridioides difficile infections
- cpx
cefoperazone
- DI
deionized
- EHC
enterohepatic circulation
- GI
gastrointestinal
- mSA
metanilic acid
- PMA
phosphomolybdic acid
- RP-HPLC
reversed phase high-performance liquid chromatography
Footnotes
Publisher's Disclaimer: This is a PDF file of an unedited manuscript that has been accepted for publication. As a service to our customers we are providing this early version of the manuscript. The manuscript will undergo copyediting, typesetting, and review of the resulting proof before it is published in its final form. Please note that during the production process errors may be discovered which could affect the content, and all legal disclaimers that apply to the journal pertain.
Data Availability Statement
All data in this study will be shared upon request by contacting Prof. Ernesto Abel-Santos, University of Nevada, Las Vegas at ernesto.abelsantos@unlv.edu
Conflict of Interests
None of the authors have conflict of interests in the publication of this manuscript
References
- 1.Paredes-Sabja D, Shen A & Sorg JA Clostridium difficile spore biology: Sporulation, germination, and spore structural proteins. Trends Microbiol. 22, 406–416 (2014). [DOI] [PMC free article] [PubMed] [Google Scholar]
- 2.Zhu D, Sorg JA & Sun X Clostridioides difficile Biology: Sporulation, Germination, and Corresponding Therapies for C. difficile Infection. Front. Cell. Infect. Microbiol 8, 1–10 (2018). [DOI] [PMC free article] [PubMed] [Google Scholar]
- 3.Yip C, Phan JR & Abel-Santos E Treatment of Clostridium difficile Infections. RSC Drug Discovery Series vol. January (2017). [Google Scholar]
- 4.Leslie JL, Vendrov KC, Jenior ML & Young VB The Gut Microbiota Is Associated with Clearance of Clostridium difficile Infection Independent of Adaptive Immunity. mSphere 4, 1–12 (2019). [DOI] [PMC free article] [PubMed] [Google Scholar]
- 5.Zhang S et al. Cost of hospital management of Clostridium difficile infection in United States-a meta-analysis and modelling study. BMC Infect. Dis 16, (2016). [DOI] [PMC free article] [PubMed] [Google Scholar]
- 6.Dubberke ER & Olsen MA Burden of clostridium difficile on the healthcare system. Clin. Infect. Dis 55, 88–92 (2012). [DOI] [PMC free article] [PubMed] [Google Scholar]
- 7.Heimann SM, Cruz Aguilar MR, Mellinghof S & Vehreschild MJGT Economic burden and cost-effective management of Clostridium difficile infections. Med. Mal. Infect 48, 23–29 (2018). [DOI] [PubMed] [Google Scholar]
- 8.Klaas Smits W et al. Clostridium difficile infection. Nat. Rev. Dis. Prim 7, 1–47 (2017). [DOI] [PMC free article] [PubMed] [Google Scholar]
- 9.Dembek M et al. Peptidoglycan degradation machinery in Clostridium difficile forespore engulfment. Mol. Microbiol 110, 390–410 (2018). [DOI] [PMC free article] [PubMed] [Google Scholar]
- 10.Edwards AN et al. Chemical and stress resistances of clostridium difficile spores and vegetative cells. Front. Microbiol 7, 1–13 (2016). [DOI] [PMC free article] [PubMed] [Google Scholar]
- 11.Yip C et al. The Design, Synthesis, and Characterizations of Spore Germination Inhibitors Effective against an Epidemic Strain of Clostridium difficile. J. Med. Chem 61, 6759–6778 (2018). [DOI] [PMC free article] [PubMed] [Google Scholar]
- 12.Abel-Santos E Endospores, Sporulation and Germination. Molecular Medical Microbiology: Second Edition vols 1–3 (Elsevier Ltd, 2014). [Google Scholar]
- 13.Sorg JA & Sonenshein AL Bile salts and glycine as cogerminants for Clostridium difficile spores. J. Bacteriol 190, 2505–2512 (2008). [DOI] [PMC free article] [PubMed] [Google Scholar]
- 14.Ramirez N, Liggins M & Abel-Santos E Kinetic evidence for the presence of putative germination receptors in Clostridium difficile spores. J. Bacteriol 192, 4215–4222 (2010). [DOI] [PMC free article] [PubMed] [Google Scholar]
- 15.Shim JK, Johnson S, Samore MH, Bliss DZ & Gerding DN Primary symptomless colonisation by Clostridium difficile and decreased risk of subsequent diarrhoea. Lancet 351, 633–636 (1998). [DOI] [PubMed] [Google Scholar]
- 16.Chiang JYL & Ferrell JM Bile acid metabolism in liver pathobiology. Gene Expr. 18, 71–87 (2018). [DOI] [PMC free article] [PubMed] [Google Scholar]
- 17.Chiang JYL Bile acids: Regulation of synthesis. J. Lipid Res 50, 1955–1966 (2009). [DOI] [PMC free article] [PubMed] [Google Scholar]
- 18.Sakamoto S, Suzuki H, Kusuhara H & Sugiyama Y Efflux mechanism of taurocholate across the rat intestinal basolateral membrane. Mol. Pharm 3, 275–281 (2006). [DOI] [PubMed] [Google Scholar]
- 19.Hofmann AF & Hagey LR Bile acids: Chemistry, pathochemistry, biology, pathobiology, and therapeutics. Cell. Mol. Life Sci 65, 2461–2483 (2008). [DOI] [PMC free article] [PubMed] [Google Scholar]
- 20.Dawson PA & Karpen SJ Intestinal transport and metabolism of bile acids. J. Lipid Res 56, 1085–1099 (2015). [DOI] [PMC free article] [PubMed] [Google Scholar]
- 21.Ridlon JM, Kang D-J & Hylemon PB Bile salt biotransformations by human intestinal bacteria. J. Lipid Res 47, 241–259 (2006). [DOI] [PubMed] [Google Scholar]
- 22.Begley M, Gahan CGM & Hill C The interaction between bacteria and bile. FEMS Microbiol. Rev 29, 625–651 (2005). [DOI] [PubMed] [Google Scholar]
- 23.Chiang JYL Recent advances in understanding bile acid homeostasis. F1000Research 6, 1–8 (2017). [DOI] [PMC free article] [PubMed] [Google Scholar]
- 24.Winston JA & Theriot CM Impact of microbial derived secondary bile acids on colonization resistance against Clostridium difficile in the gastrointestinal tract. Anaerobe 41, 44–50 (2016). [DOI] [PMC free article] [PubMed] [Google Scholar]
- 25.Shen A A Gut Odyssey: The Impact of the Microbiota on Clostridium difficile Spore Formation and Germination. PLoS Pathog. 11, 1–7 (2015). [DOI] [PMC free article] [PubMed] [Google Scholar]
- 26.Hofmann AF The continuing importance of bile acids in liver and intestinal disease. Arch. Intern. Med 159, 2647–2658 (1999). [DOI] [PubMed] [Google Scholar]
- 27.Howerton A, Patra M & Abel-Santos E Fate of Ingested Clostridium difficile Spores in Mice. PLoS One 8, (2013). [DOI] [PMC free article] [PubMed] [Google Scholar]
- 28.Giel JL, Sorg JA, Sonenshein AL & Zhu J Metabolism of bile salts in mice influences spore germination in clostridium difficile. PLoS One 5, (2010). [DOI] [PMC free article] [PubMed] [Google Scholar]
- 29.Heeg D, Burns DA, Cartman ST & Minton NP Spores of Clostridium difficile Clinical isolates Display a Diverse Germination Response to Bile Salts. PLoS One 7, (2012). [DOI] [PMC free article] [PubMed] [Google Scholar]
- 30.Howerton A, Ramirez N & Abel-Santos E Mapping Interactions between Germinants and Clostridium difficile Spores. J. Bacteriol 193, 274–282 (2011). [DOI] [PMC free article] [PubMed] [Google Scholar]
- 31.Sorg JA & Sonenshein AL Chenodeoxycholate is an inhibitor of Clostridium difficile spore germination. J. Bacteriol 191, 1115–1117 (2009). [DOI] [PMC free article] [PubMed] [Google Scholar]
- 32.Howerton A, Patra M & Abel-Santos E A New Strategy for the Prevention of Clostridium difficile Infection. J. Infect. Dis 207, 1498–1504 (2013). [DOI] [PubMed] [Google Scholar]
- 33.Stoltz KL et al. Synthesis and Biological Evaluation of Bile Acid Analogues Inhibitory to Clostridium difficile Spore Germination. J. Med. Chem 60, 3451–3471 (2017). [DOI] [PMC free article] [PubMed] [Google Scholar]
- 34.Sorg JA & Sonenshein AL Inhibiting the initiation of Clostridium difficile spore germination using analogs of chenodeoxycholic acid, a bile acid. J. Bacteriol 192, 4983–4990 (2010). [DOI] [PMC free article] [PubMed] [Google Scholar]
- 35.Howerton A et al. Effect of the synthetic bile salt analog CamSA on the hamster model of clostridium difficile infection. Antimicrob. Agents Chemother 62, 1–12 (2018). [DOI] [PMC free article] [PubMed] [Google Scholar]
- 36.Sun X et al. Mouse relapse model of Clostridium difficile infection. Infect. Immun 79, 2856–2864 (2011). [DOI] [PMC free article] [PubMed] [Google Scholar]
- 37.Chen X et al. A Mouse Model of Clostridium difficile-Associated Disease. Gastroenterology 135, 1984–1992 (2008). [DOI] [PubMed] [Google Scholar]
- 38.Theriot CM et al. Cefoperazone-treated mice as an experimental platform to assess differential virulence of Clostridium difficile strains. Gut Microbes 2, 326–334 (2011). [DOI] [PMC free article] [PubMed] [Google Scholar]
- 39.Sevrioukova IF & Poulos TL Understanding the mechanism of cytochrome P450 3A4: Recent advances and remaining problems. Dalt. Trans 42, 3116–3126 (2013). [DOI] [PMC free article] [PubMed] [Google Scholar]
- 40.Manes JD & Schneider DL Extraction of bile acids from rat feces containing cholestyramine. J. Lipid Res 12, 376–377 (1971). [PubMed] [Google Scholar]
- 41.Meibohm B & Derendorf H Pharmacokinetics and Pharmacodynamics of Biotech Drugs. Pharm. Biotechnol 10, 145–172 (2005). [Google Scholar]
- 42.Cai J-S & Chen J-H The Mechanism of Enterohepatic Circulation in the Formation of Gallstone Disease. J. Membr. Biol 247, 1067–1082 (2014). [DOI] [PMC free article] [PubMed] [Google Scholar]
- 43.Ogu CC & Maxa JL Drug interactions due to cytochrome P450. Baylor Univ. Med. Cent. Proc 13, 421–423 (2000). [DOI] [PMC free article] [PubMed] [Google Scholar]
- 44.Chen J, Zhao K-N & Chen C The role of CYP3A4 in the biotransformation of bile acids and therapeutic implication for cholestasis. Ann. Transl. Med 2, 1–9 (2014). [DOI] [PMC free article] [PubMed] [Google Scholar]
- 45.Lee KS & Kim SK Direct and metabolism-dependent cytochrome P450 inhibition assays for evaluating drug-drug interactions. J. Appl. Toxicol 33, 100–108 (2013). [DOI] [PubMed] [Google Scholar]
- 46.Bodin K, Lindbom U & Diczfalusy U Novel pathways of bile acid metabolism involving CYP3A4. Biochim. Biophys. Acta - Mol. Cell Biol. Lipids 1687, 84–93 (2005). [DOI] [PubMed] [Google Scholar]
- 47.Chen J & Farrell GC Bile acids produce a generalized reduction of the catalytic activity of cytochromes P450 and ether hepatic microsomal enzymes in vitro: Relevance to drug metabolism in experimental cholestasis. J. Gastroenterol. Hepatol 11, 870–877 (1996). [DOI] [PubMed] [Google Scholar]
- 48.Roberts MS, Magnusson BM, Burczynski FJ & Weiss M Enterohepatic circulation: Physiological, pharmacokinetic and clinical implications. Clin. Pharmacokinet 41, 751–790 (2002). [DOI] [PubMed] [Google Scholar]
- 49.Abshagen U, von Grodzicki U, Hirschberger U & Rennekamp H Effect of enterohepatic circulation on the pharmacokinetics of spironolactone in man. Naunyn. Schmiedebergs. Arch. Pharmacol 300, 281–287 (1977). [DOI] [PubMed] [Google Scholar]
- 50.Caldwell J, Gardner I & Swales N An introduction to drug disposition: The basic principles of absorption, distribution, metabolism, and excretion. Toxicol. Pathol 23, 102–114 (1995). [DOI] [PubMed] [Google Scholar]
- 51.Roth A et al. Evidence for an enterohepatic circulation of ochratoxin A in mice. Toxicology 48, 293–308 (1988). [DOI] [PubMed] [Google Scholar]
- 52.Malik MY, Jaiswal S, Sharma A, Shukla M & Lal J Role of enterohepatic recirculation in drug disposition: cooperation and complications. Drug Metab. Rev 48, 281–327 (2016). [DOI] [PubMed] [Google Scholar]
- 53.Davies NM, Takemoto JK, Brocks DR & Yanez JA Multiple peaking phenomena in pharmacokinetic disposition. Clin. Pharmacokinet 49, 351–377 (2010). [DOI] [PubMed] [Google Scholar]
- 54.Garbutt JT & Kenney TJ Effect of cholestyramine on bile acid metabolism in normal man. J. Clin. Invest 51, 2781–2789 (1972). [DOI] [PMC free article] [PubMed] [Google Scholar]