Correction to: Nano-Micro Lett. (2019) 11:73 10.1007/s40820-019-0306-9
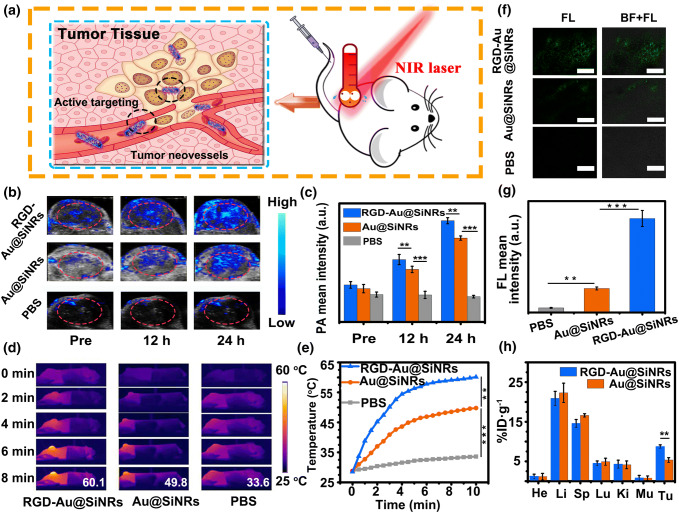
In the original publication figures 3b, 5a, 5g are incorrectly published and the scale bars in figures 4b and 4d have not appeared.
Fig. 3.
Assessment of the biocompatibility, targeted imaging, and photothermal effect in vitro. a Cytotoxicity of PEG-Au@SiNRs. b LSCM images of CT-26 and 4T1 cells after incubation with RGD-Au@SiNRs (blocking with free peptides or not) or Au@SiNRs for 2 h at 37 °C. Scale bars, 25 μm. c Cell viability of CT-26 cells, which were first incubated with RGD-Au@SiNRs or Au@SiNRs for 4 h and then irradiated by an 808-nm laser (0.8 W cm−2) for 5 min as mean ± SD (n = 3). Asterisk (**) indicates p < 0.01
Fig. 5.
Photothermal therapy and safety assessment. a Photographs of representative mice before and after the treatment with different agents and NIR irradiation. b Growth curves of tumor volumes of mice groups with NIR irradiation. c Weight of the excised tumors from the PTT-treated mice. d Survival curves of PTT-treated mice. e Serum biochemistry data including alkaline phosphatase, alanine aminotransferase, and aspartate aminotransferase, and blood urea nitrogen levels of control and RGD-Au@SiNRs-treated healthy mice. f Complete blood counts: hematocrit, hemoglobin, mean corpuscular hemoglobin, mean corpuscular hemoglobin concentration, mean corpuscular volume, blood platelets, red blood cells, blood levels of white blood cells, and platelets of control and RGD-Au@SiNRs-treated healthy mice. g H&E staining of various organ tissues harvested from tumor-bearing mice at the end of treatment. Asterisk (**) indicates p < 0.01; (***) means p < 0.001
Fig. 4.
Tumor-targeted multimodal imaging in vivo. a Schematic illustration of the active targeting of RGD-Au@SiNRs. b PA imaging and c the corresponding PA signal intensity of tumor regions of CT-26 tumor-bearing mice untreated and treated with RGD-Au@SiNRs, Au@SiNRs, or PBS for 12 and 24 h. d Infrared thermal mapping images, and e corresponding temperature change of tumor regions of CT-26 tumor-bearing mice irradiated with an 808-nm laser (0.8 W cm−2) for different times (0–8 min, time interval: 30 s) at 24 h post-administration with RGD-Au@SiNRs, Au@SiNRs, or PBS. f LSCM images of tumor sections at 24 h post-injection of PBS, Au@SiNRs, or RGD-Au@SiNRs. Scale bars, 100 μm, and g corresponding quantitative analysis of the fluorescence intensity. h The bio-distribution of RGD-Au@SiNRs and Au@SiNRs measured by ICP-OES at 24 h post-administration. Asterisk (**) indicates p < 0.01; (***) means p < 0.001
The correct figures are provided in this correction.
The original article has been corrected.
Contributor Information
Yuanyuan Su, Email: suyuanyuan@suda.edu.cn.
Yao He, Email: yaohe@suda.edu.cn.


