Figure 3.

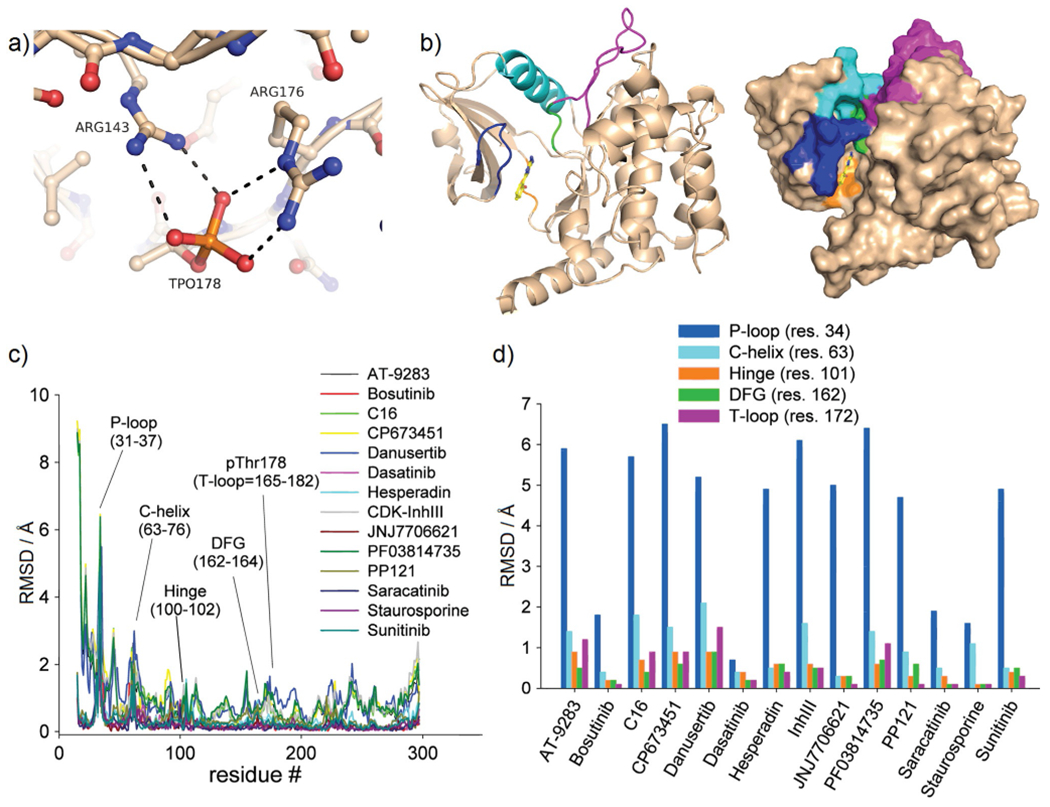
Inhibitor-induced conformational changes in MST3 occur primarily in the P-loop. a) The activation loop (T-loop) of MST3 (residues 165–182) is stabilized through salt bridges of the autophosphorylated Thr178 with Arg176 and Arg143. b) Overview of key structural elements of MST3 in cartoon presentation: P-loop (blue), C-helix (cyan), hinge (orange), DFG (green), and T-loop (magenta). c) RMSDs as a function of residues of liganded structures aligned through the MST3–TP fragment complex. d) Replot of panel c showing residues of each structural element with largest RMSD values.
