Abstract
Current closed-loop deep brain stimulation (DBS) devices can generally tackle one disorder. This paper presents the design and evaluation of a multi-disease closed-loop DBS device that can sense multiple brain biomarkers, detect a disorder, and adaptively deliver electrical stimulation pulses based on the disease state. The device consists of: (i) a neural sensor, (ii) a controller involving a feature extractor, a disease classifier, and a control strategy, and (iii) neural stimulator. The neural sensor records and processes local field potentials and spikes from within the brain using two low-frequency and high-frequency channels. The feature extractor digitally processes the output of the neural sensor, and extracts five potential biomarkers: alpha, beta, slow gamma, high-frequency oscillations, and spikes. The disease classifier identifies the type of the neurological disorder through an analysis of the biomarkers’ amplitude features. The control strategy considers the disease state and supplies the stimulation settings to the neural stimulator. Both the disease classifier and control strategy are based on fuzzy algorithms. The neural stimulator generates electrical stimulation pulses according to the control commands, and delivers them to the target area of the brain. The device can generate current stimulation pulses with specific amplitude, frequency, and duration. The fabricated device has the maximum radius of 15 mm. Its total weight including the circuit board, battery and battery holder is 5.1 g. The performance of the integrated device has been evaluated through six bench and in-vitro experiments. The experimental results are presented, analyzed, and discussed. Six bench and in-vitro experiments were conducted using sinusoidal, normal pre-recorded, and diseased neural signals representing normal, epilepsy, depression and PD conditions. The results obtained through these tests indicate the successful neural sensing, classification, control, and neural stimulating performance.
Keywords: Biomarkers, Closed-loop, Deep Brain Stimulation, Fuzzy Logic, Multiple Diseases
I. INTRODUCTION
Deep brain stimulation (DBS) is a neurosurgical procedure involving implantation of an electrode in the brain, and delivery of electrical stimulation pulses using a neurostimulator for the treatment of neurological disorders [1]. DBS can be classified into open-loop and closed-loop approaches. In the open-loop DBS, the stimulation is continuously delivered independent of the physiological brain condition. The optimization of the stimulation parameters in the open-loop DBS is performed manually by a neurologist which is not time- and cost-efficient [2]. The programming procedure is dependent on patient’s experience of clinical benefits. Accordingly, stimulation-induced adverse effects may occur, and for some patients, satisfactory settings may never be achieved [2]. In the closed-loop DBS, on the other hand, the stimulation is delivered according to the physiological brain condition. The optimization of the stimulation parameters in the closed-loop DBS is performed automatically by sensing a biomarker that reflects the disease state.
Most of the current closed-loop DBS devices [1], [3]–[12] use a single biomarker in their feedback loop which can cause the following issues: (i) The device can be used to detect and treat a neurological disorder characterized by the biomarker. For instance, when a closed-loop DBS device is designed to control epilepsy, it might be inefficient to treat Parkinson’s disease (PD) due to the need for different biomarker detection and control algorithm; (ii) Some neurological disorders (e.g. PD) may demonstrate multiple primary (e.g. tremor, bradykinesia, rigidity, postural instability, etc.) or secondary (e.g. freezing, micrographia, mask-like expression, unwanted accelerations) symptoms [13], where only a subset of them is characterized by the biomarker [14], [15]. Thus, the device will not be able to detect the remaining symptoms [15]; (iii) The device may not provide sufficient detection accuracy by using one biomarker [16], [17]. While the biomarker may represent an abnormal brain state, it may be also affected by the patient’s other comorbid physiological or psychological conditions [16]. The use of multiple biomarkers enables making a more accurate decision, and increase the reliability of the closed-loop DBS device; (iv) The detection accuracy of the biomarker by the device may be affected by internal or external noises. Due to conditions such as temperature variations, induced electric currents, and functional disruptions [18], [19], the biomarker measurement may be affected. Thus, an incorrect decision will be made by the controller, and the stimulation parameters will be incorrectly adjusted.
Another shortcoming of the existing closed-loop DBS devices is that they are optimized to tackle only one specific disorder. They cannot treat other disorders unless some of their internal components are modified. On the other hand, a multi-biomarker multi-disease closed-loop DBS device will be able to detect a disease type and its state, and control and deliver the stimulation parameters efficiently.
In our earlier publications [20]–[22], we have presented some studies on multi-biomarker sensors. Here, we present the design, implementation, and laboratory validation of a complete closed-loop DBS device with an improved sensor that can sense multiple brain biomarkers, use the biomarkers to detect a brain disorder, and deliver required electrical stimulation pulses to the target area of the brain.
II. METHODS
A. SYSTEM OVERVIEW
The overview of the multi-disease closed-loop DBS device is given in Fig. 1. Also, the schematic diagram of the circuits for the device is shown in Fig. 2. The components of the device include: (i) neural sensor, (ii) feature extractor, disease classifier, and controller, and (iii) neural stimulator. The neural signals are sensed from within the brain and conditioned by the neural sensor. Then, the outputs of the neural sensor are digitally processed to extract multiple potential biomarkers (alpha, beta, slow gamma (sG), high-frequency oscillations (HFO), and spikes). Next, the potential biomarkers are processed to extract amplitude features. The disease classifier processes the features by using a fuzzy-classification algorithm, and determines the brain’s condition (normal, epilepsy, depression, and PD). Depending on the detected condition, the associated controller is activated to determine three DBS settings (pulse amplitude, pulse duration, and pulse frequency). Finally, the neural stimulator generates stimulation pulses according to the stimulation settings, and delivers the stimulation pulses to the target deep brain structures.
Fig. 1.

Overview of the multi-disease closed-loop DBS device. HF: high-frequency, LF: low-frequency, PA: pulse amplitude, PD: pulse duration, and PF: pulse frequency.
Fig. 2.
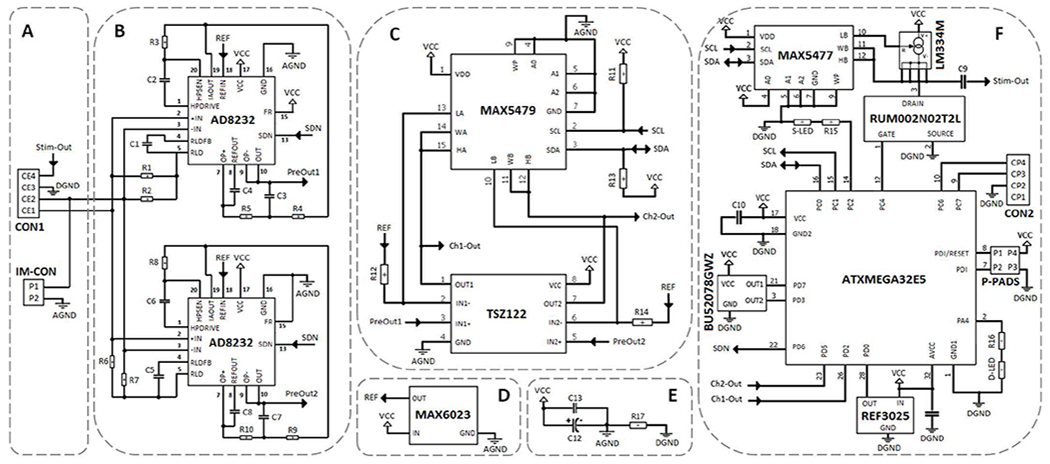
Schematic diagram of the closed-loop DBS device. (A) The neural sensor electrode connection mechanism. (B) The neural sensor pre-amplifier, low-pass and high-pass filters for Ch1 and Ch2. (C) The neural sensor programmable amplifier for Ch1 and Ch2. (D) The neural sensor voltage reference generator. (E) The closed-loop DBS by-pass noise-reduction capacitors. (F) The closed-loop DBS digital circuit involving in the neural sensor, feature extractor, controller, and neural stimulator.
The neural sensor can record five physiological frequency bands including alpha (8-13 Hz), beta (13-30 Hz), slow gamma (30-45 Hz), high-frequency oscillations (200-400 Hz), and spikes (400-1000 Hz). The device attenuates the frequency components among 45-200 Hz due to the interference with DBS pulse-frequency, avoiding the deterioration of the measured neural signal to much extent. In addition, the frequency components below 7 Hz or over 1000 Hz are also filtered in the current device. Attenuation of DC and very low frequency components is to lessen the sensitivity of the device to motion (usually below 5 Hz) or other low-frequency artefacts. Moreover, frequency components over 1000 Hz are filtered to reduce the total power consumption of the device. Extending the neural sensor operating bandwidth to higher frequencies will force the device to have a higher sampling frequency (according to the Nyquist rate) and therefore, providing a faster real-time processing (which mean higher power consumption).
The specifications of the developed device are listed in Table 1. It is battery-operated, working with voltages within the range of 2.7 V to 3.5 V. A 3V CR2032 coin battery (capacity: 240 mAh) was chosen to meet the voltage requirements of the device. The device can operate in four different modes (Initialization, Standby, Communication, and Stimulation), each consuming different power levels from the operated battery. Upon the battery insertion, the device enters the Initialization mode in which the port pins, I2C bus, and the analog to digital converter (ADC) are configured. Upon completion of the Initialization mode, the device enters the Standby mode in which the ADC, neural sensor and stimulator are disabled and both the outputs of the Hall sensor are iteratively checked until a magnet pole is detected. If South Pole is detected, the device enters the Stimulation mode and runs the closed-loop DBS feature extraction, classification and control algorithms on the input neural signals to deliver the stimulation pulses according to the detected potential biomarkers and disease state. If North Pole is observed, the device enters the Communication mode in which the neural signals are transferred to a computer for visualization and off-line signal processing. The current consumption of the device in the Initialization, Standby, and Communication modes is about 3.5 mA. The current consumption increases to around 13 mA in the Stimulation mode. Consequently, the minimum battery lifetime would be approximately 18 hours for a CR2032 coin battery.
TABLE I.
Technical specifications of the device.
| Neural Sensor | |
|---|---|
| Recording Channels | 2 |
| Gain programmability | Yes |
| Gain Range | 50 – 100 dB |
| Signal Band-width | 7 – 45 Hz and 200 – 1000 Hz |
| Recording Method | User selectable, single-ended or differential |
| Sampling Frequency | 4 kHz (2 kHz per channel) |
| ADC Resolution | 12 bit |
| Design Method | Discrete components |
| Feature extractor, classifier and controller | |
| Microprocessor Chip | ATxMega32e5 |
| Number of Extracted Biomarkers | 5 (alpha, beta, sG, HFO, and spikes) |
| Features | Smoothed biomarker amplitude |
| Classification Method | Fuzzy algorithm |
| Classifier Inputs | 4 |
| Classifier Outputs | 4 |
| Control Method | Fuzzy algorithm |
| Number of Controllers | 4 (one per class) |
| Controllable States | Normal, epilepsy, depression, PD |
| Neural Stimulator | |
| Stimulation Channels | 1 |
| Stimulation Type | Constant-current-controlled |
| Stimulation Pattern | Biphasic passive-charge-balanced |
| Controllable Parameters | Pulse amplitude, frequency and duration |
| DAC Resolution | 12 bit |
| Overall Features | |
| Device Operating Power Supply | 3 V |
| Battery Type, and Capacity | Li-ion, 240 mAh |
| Power Consumption | 39 mW |
| Operation Time | 18 h |
| Shape and Dimension | Semi-round, 11 mm internal radius, 15 mm external radius |
| Weight | 5.1 g (including battery and battery holder) |
1). NEURAL SENSOR:
The neural sensor has been developed using discrete components to achieve higher flexibility in modifying the design, lower production expenses, and shorter manufacturing time, compared with application specific integrated circuits (ASICs) [23]. It collects and conditions neural signals in three stages: pre-amplification, filtration, and programmable post-amplification. In addition, it includes a ground stabilization circuit for single-supply operation.
The neural sensor inputs are captured from the contact-electrodes 1 and 2 (CE1 and CE2) as shown in Fig. 2 (A). The user can select between differential or single-ended recording configurations via an input-mode connector (IM-CON). The neural sensor includes two parallel low-frequency (Ch1) and high-frequency channels (Ch2). The AD8232 signal conditioning chip (Analog Devices, Inc.) has been employed in the first stage of both channels (Fig. 2 (B)). The pre-amplification gain of the recording circuit is set to 100 V/V via the internal instrumentation amplifier of the AD8232. In addition, a high-pass filter (HPF) with the cut-off frequency of 7 Hz for Ch1 (200 Hz for Ch2) has been also implemented using the AD8232. The internal independent operational amplifier of the AD8232 is used to implement a unity-gain Sallen-Key low-pass filter (LPF) with the cut-off frequency of 45 Hz for Ch1 (1 kHz for Ch2). A right-leg drive (RLD) amplifier has been used to improve the common-mode rejection by maintaining the midscale voltage through bias resistors (R1 and R2 in Ch1, and R6 and R7 in Ch2). The common-mode line rejection of 50 Hz and its harmonies are filtered via the C1 capacitor which implements an integrator in Ch1 (C5 in Ch2). The next signal conditioning stage after pre-amplification and filtration is the programmable post-amplification (Fig. 2 (C)). The gain of the programmable post-amplification circuit is controlled via a two-channel micro-power digital potentiometer (DP) chip (MAX5479 from Maxim Integrated, Inc.) in combination with a micro-power operational amplifier chip (TSZ122 from STMicroelectronics, Inc.). The post-amplification gain is programmable from 1-1000 V/V. The DP chip is programmed via the microcontroller using an I2C interface involving the serial clock (SCL) and serial data (SDA) lines, each connected to the supply voltage (VCC) through a pull-up 4.7 kΩ resistor.
The microcontroller used in this device is the ATxmega32E5 (from Microchip Technology, Inc.) which is a high performance, low power, 8-bit microcontroller. It offers 32 KB of flash, 1 KB of EEPROM, and 4 KB of internal SRAM. It is programmed using P-PADS included on the device (Fig. 2 (F)).
Finally, the neural sensor outputs (Ch1-Out and Ch2-Out) are directed to the microcontroller for digitization. The digitized signals can be either sent out through the serial data communication port (CON2) for off-line signal processing, or processed on-line for closed-loop operation.
To operate the neural sensor by a single-supply voltage, a virtual ground (at 1.25 V) is created between the 3 V supply voltage and the analog ground (AGND) lines (Fig. 2 (D)). The signals present at the output of the instrumentation amplifier, filters, and programmable amplifier are referenced to this voltage. This reference voltage level of 1.25 V is set through a separate micro-power MAX6023 voltage reference chip (Maxim Integrated, Inc).
Two parallel capacitors (Fig. 2 (E)) are used as bypass between the VCC and AGND lines to minimize the noise on the power supply traces. The capacitor network includes a 100 nF ceramic capacitor (C13) in parallel with a 470 μF tantalum polarized capacitor (C12). The C13 capacitor is intended for decoupling the power supplies. The C14 capacitor is necessary to maintain the circuit stability. In addition, to keep the possible digital noise out of the analog circuit, the analog (AGND) and digital (DGND) grounds are separated via a low ohm R17 resistor (Fig. 2 (E)).
The user can activate/deactivate the neural sensor through the embedded shutdown terminal of the AD8232 chip which is connected to the microcontroller. This feature helps switch easily between the active (recording) and shutdown (no recording) modes in the neural sensor, even when the supply is still on, thus offering considerable power savings. Apart from reducing the power consumption, it enhances the flexibility and ease of use in portable applications. To digitally control the SDN pin, a BU52078GWZ chip (ROHM Semiconductor, Inc.) is employed (Fig. 2 (F)). It is a dual-output micro-power omnipolar detection Hall sensor which contains a polarity monitor circuit. The first output which reacts to the South Pole is employed to activate/shutdown the neural sensor through the SDN pin. The second output of the Hall IC is employed to activate/deactivate the serial data communication function. The serial communication is off by default, and can be activated whenever the user decides to monitor/store the neural signals, and for additional off-line signal processing.
2). FEATURE EXTRACTOR, DISEASE CLASSIFIER AND CONTROLLER:
The neural sensor outputs are directed to the microcontroller to extract potential biomarkers, classify diseases, and control the stimulation pulses according to the detected disease and brain state.
The ATxmega32E5 microcontroller executes the code for the feature extractor, disease classifier and controller. Fig. 3 (A) shows feature extraction steps that are performed on the neural sensor outputs. The feature extraction starts with sampling and digitization of the analog outputs of the neural sensor. The microcontroller samples and digitizes Ch1-Out and Ch2-Out through its internal 12-bit ADC. Both Ch1-Out and Ch2-Out signals are continuously sampled one after another at an overall sampling frequency of 4000 S/s (2000 S/s per each channel). For this purpose, an internal timer is triggered to generate an interrupt after every 250 μs (sampling rate 4000 Hz). An external reference voltage of 2.5 V, produced by a REF3025 chip (Fig. 2 (F)), is used as an external reference input for the ADC. The REF3025 is a precision, low-power, low-dropout voltage, reference chip (Texas Instruments, Inc.), which offers excellent accuracy while operating at a quiescent typical current of 42 μA. The reason for using a voltage reference chip is that the internal reference options were around 1-1.87 V which were inadequate for our application. Also, the VCC reference option is sensitive to the variation of the power source voltage.
Fig. 3.
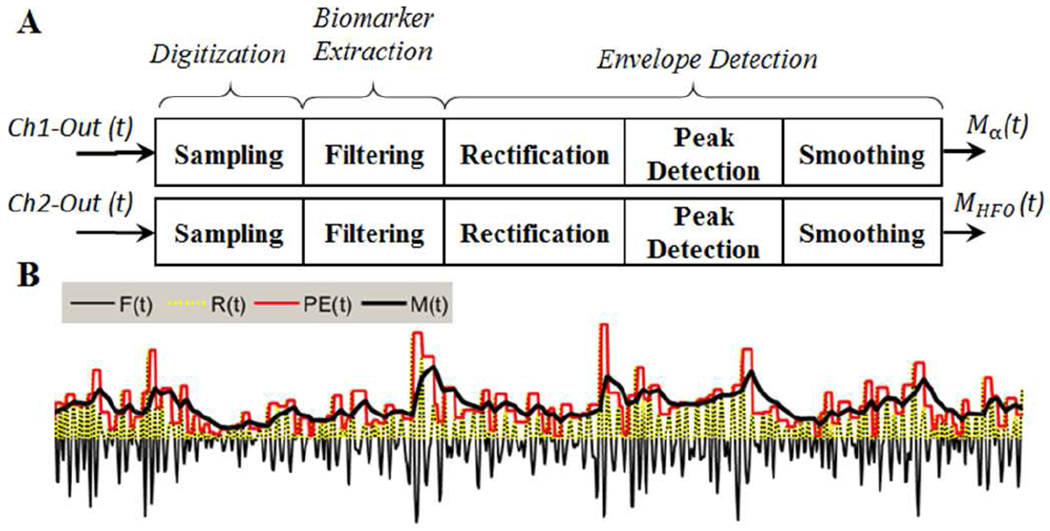
(A) The feature extraction steps carried out on the Ch1 and Ch2 analog outputs for extraction of biomarkers. In the current study, alpha and HFO signals are processed, Linking to epilepsy, depression and PD disorders. However, the neural sensor outputs also contain three other potential biomarkers (beta, sG, and spikes) that can be also included in the feature extraction process for alleviation of other neurological disorders. (B) The graph presenting the envelope detection process. Here, F(t) demonstrates the extracted biomarker, and R(t) is the rectified version (R(t)=|F(t)|). PE(t) is the staircase signal produced by the pre-envelop detection process, and M(t) is the smoothed version of PE(t) as the final envelope output, representing the extracted amplitude feature.
The second step (see Fig. 3 (A)) is to extract clinically investigated potential biomarkers. The digitized Ch1-Out and Ch2-Out contain several frequency bands, and activities within those bands are used as potential biomarkers for symptoms of several neurological disorders [24]–[40] (see Table 2). Three potential biomarkers can be extracted from the digitized Ch1-Out, which include alpha (8-14 Hz), beta (~13–30 Hz), and sG (30-45 Hz). In addition, two potential biomarkers can be extracted from Ch2-Out, including HFOs (200-400 Hz), and spikes (>500 Hz). In the current study, we have focused on alleviating the epilepsy (could be characterized by HFO biomarker), depression (could be characterized by alpha biomarker), and PD (could be characterized by both alpha and HFO biomarkers) diseases. The alpha and HFO biomarkers are extracted through second order bandpass Butterworth digital filters. The filtration process is done in an iterative manner to facilitate real-time signal processing. The implemented iterative second order Butterworth filter for potential alpha biomarker is:
| (1) |
where Ch1-Out(t) is the input signal at time t, G is the gain coefficient, I(4) is the current value of the processed input, I(0) to I(3) are the previous values of the processed input (initialized by zero), O(4) is the current value of the processed output, O(0) to O(3) are the previous values of the processed output (initialized by zero), Fα (t) is the digital filter output for alpha at time t, and k0 to k3 are the filter coefficients which are set based on filter frequency range for alpha biomarker. The implemented iterative second order Butterworth filter for the HFO biomarker uses Ch2-Out(t) as input with filter coefficients set to the frequency range of HFO biomarker.
TABLE II.
The extractable biomarkers from the outputs of the neural sensor and the biomarker’s relevance to neurological disorders.
| Biomarker | Ref. | Disease | Brain Region | Symptoms |
|---|---|---|---|---|
| Alpha (8-13 Hz) | W. J. Neumann et al. [24] | Depression | Limbic system | Severity |
| W. Thevathasan et al. [25] | PD | Pedunculopontine nucleus (PPN) | Gait performance | |
| L. A. Shreve et al. [39] | PD | Sub-thalamic nucleus (STN) | Tremor | |
| Beta (13–30 Hz) | G. Tinkhauser et al. [26], A. A. Kühn et al. [27], J. B. Toledo et al. [28] | PD | STN | Rigidity, akinesia and bradykinesia freezing of gait |
| Slow Gamma (30-45 Hz) | N. Maling et al. [29] | Tourette’s syndrome disorder | Thalamus | Tourette’s symptoms relief |
| M. Beudel et al. [30] | PD | STN | Tremor | |
| Lofredi, R. et al. [40] | PD | STN | Velocity and symptom severity | |
| HFOs (200-400 Hz) | G. Foffani and A. Priori [31], J. Lopez-Azcarate et al. [32] | PD | STN | Tremor, rigidity and bradykinesia |
| G. Assenza et al. [35], M. Zijlmans et al. [33], A. Bragin et al. [36], G. Worrell and J. Gotman [34] | Epilepsy | Epileptogenic zone | Epileptic symptoms | |
| S. F. Danish et al. [37] | Essential tremor | STN | Tremor | |
| S. F. Danish et al. [37] | Dystonia | STN | Dystonia’s relief | |
| Spikes (400-1000 Hz) | S. A. Weiss et al. [38] | Epilepsy | Epileptogenic zone | Epileptic symptoms |
Next, a three-step envelop detection algorithm is used to extract the alpha and HFO amplitude features. The implemented envelop detection algorithm includes: (i) rectification, (ii) peak-detection, and (iii) smoothing steps. The first step of envelop detection is to rectify the extracted biomarker signal. For this purpose, the absolute value of Fα (t) and FHFO (t) are taken by removing the negative values (converting them to zero) and keeping the positive values. In the second step, the rectified signals (Rα (t) and RHFO (t)) are dynamically scanned in a 3-sample window in real-time, and the local maximums are determined. Each value in the window, if not a local peak, is replaced by the previous maximum. This algorithm generates a staircase pre-envelope signal (PE(t)). Finally, the last envelop detection step includes a moving average-filter (for smoothing purpose) applied to pre-envelop (PEα (t)) output as:
| (2) |
where PEα (t) is the pre-envelop alpha which is used as the input to the moving average filter at time t, Mα (t) is the moving average filter output at time t, Mα (t-t0) is the previous output of the moving average filter (initialized by zero), and k is the moving average filter coefficient. The implemented moving average filter for HFO biomarker (MHFO (t)) is similar to Eq. 2 with different filter coefficients. The moving average filter is necessary to eliminate the produced staircase ripples (as shown in Fig. 3 (B)) and obtain a less sharp and steady amplitude for the alpha and HFO biomarkers. A sample graph presenting the three-step envelope detection process is shown in Fig. 3 (B).
The disease type is then determined using a fuzzy logic classifier. Fuzzy logic [41] is one of the techniques used to tackle classification problems. The main feature of the fuzzy logic classification method is its capability to deal with uncertainty and vagueness, as well as supporting the use of overlapping class definitions [42]. In addition, fuzzy rules can be easily interpreted and examined by humans [43]. Fuzzy logic involves fuzzification, rules assessments, and defuzzification stages. This technique has been widely used in medical-based diagnosis and classification of different diseases [42], [44]–[47].
In this work, a four-class fuzzy classifier distinguishes among normal, epilepsy, depression, and PD conditions. The structure of the fuzzy logic classifier which consists of two input variables, four membership functions, four rules, and one output variable is shown in Fig. 4 (A–E). The input fuzzy variables are calculated based on the equations given in Fig. 4 (A). In these equations, eα (t) and eHFO (t) are the alpha and HFO errors at time t, which are calculated based on comparison of the moving average filter outputs (Mα (t) and MHFO (t)) with two thresholds (Tα and THFO) as seen in Fig. 4 (A). The thresholds are constant, distinguishing between potential normal and abnormal biomarker situations.
Fig. 4.
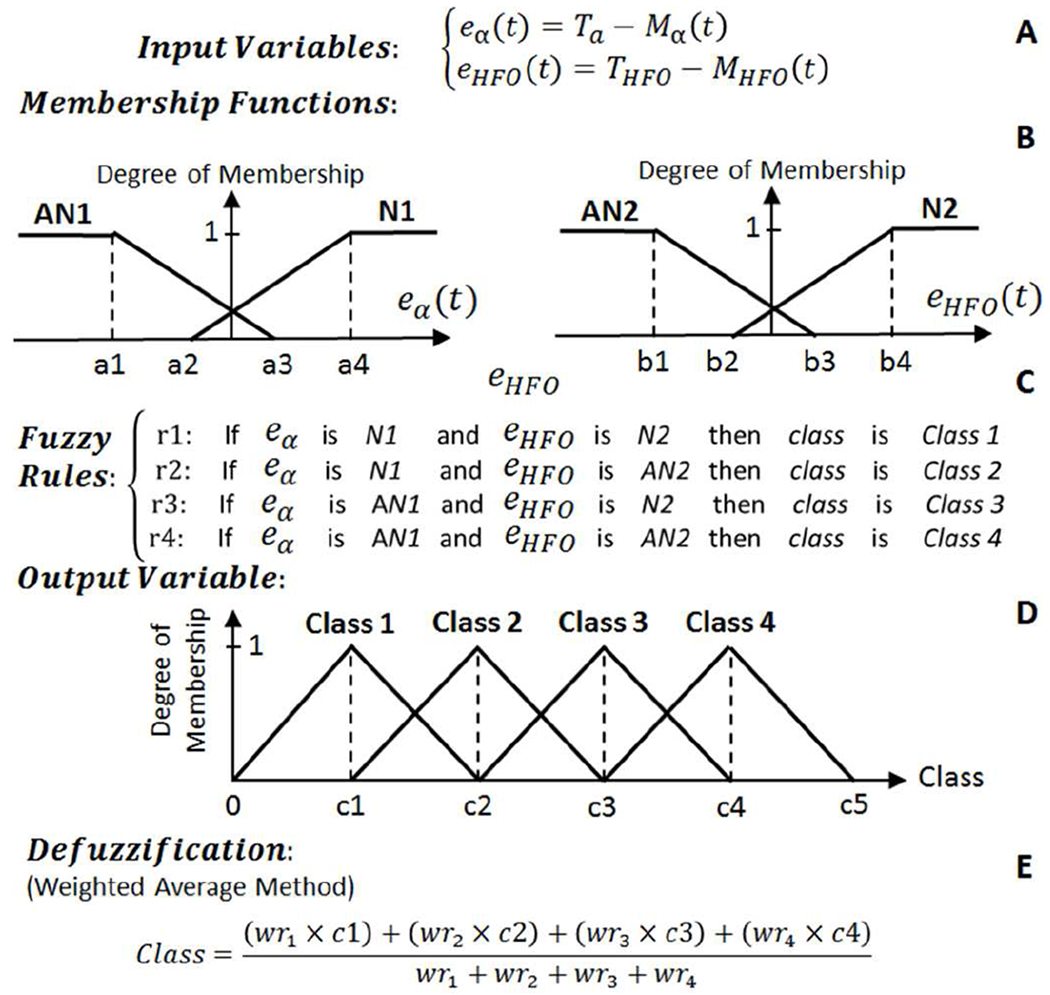
The structure of the fuzzy classifier used to distinguish between normal, epilepsy, depression, and PD conditions. (A) Fuzzy input variables. (B) Membership functions. (C) Fuzzy if-then rules. (D) Fuzzy output variable. (E) Defuzzification.
Each input variable in the fuzzy classifier is represented by two fuzzy sets of trapezoidal-shaped normal (N) and abnormal (AN) membership functions with the structure presented in Fig. 4 (B). The degree of belonging of the input variables to all the fuzzy membership functions is calculated at time t, and then the four fuzzy if-then rules (listed in Fig. 4 (C)) are assessed and the weight of each rule (wri) is determined. The single output variable is the class type which is represented with four triangular-shaped fuzzy sets as presented in Fig. 4 (D). The four class fuzzy sets are Class 1 (Normal), Class 2 (Epilepsy), Class 3 (Depression), and Class 4 (PD). The final stage of the fuzzy classifier is the defuzzification stage (Fig. 4 (E)) to transform the fuzzy results to a single crisp output, and determine what class the data belongs to. Here, we have implemented a weighted average defuzzification method used for fuzzy sets with symmetrical output membership functions. The advantage of this method is less computation compared to other approaches such as the center of gravity defuzzification method. In the weighted average defuzzification method, each membership function is weighted by its maximum membership value. The defuzzification is performed according to the stated equation in Fig. 4 (E) to obtain an index number between 0 to c5 (the output set parameters). In this example, c1-c5 are 1-5 integers.
Upon the classification, the fuzzy controller detects the disease state (mild, moderate, severe) based on two thresholds (one separating mild from moderate and another for separating moderate from severe disease states) and then supplies suitable stimulation settings to the neural stimulator. The device contains four controllers per each detected class as shown in Fig. 5. At each time, only the controller associated with the classified disease is active to calculate and send the stimulation parameters to the neural stimulator.
Fig. 5.
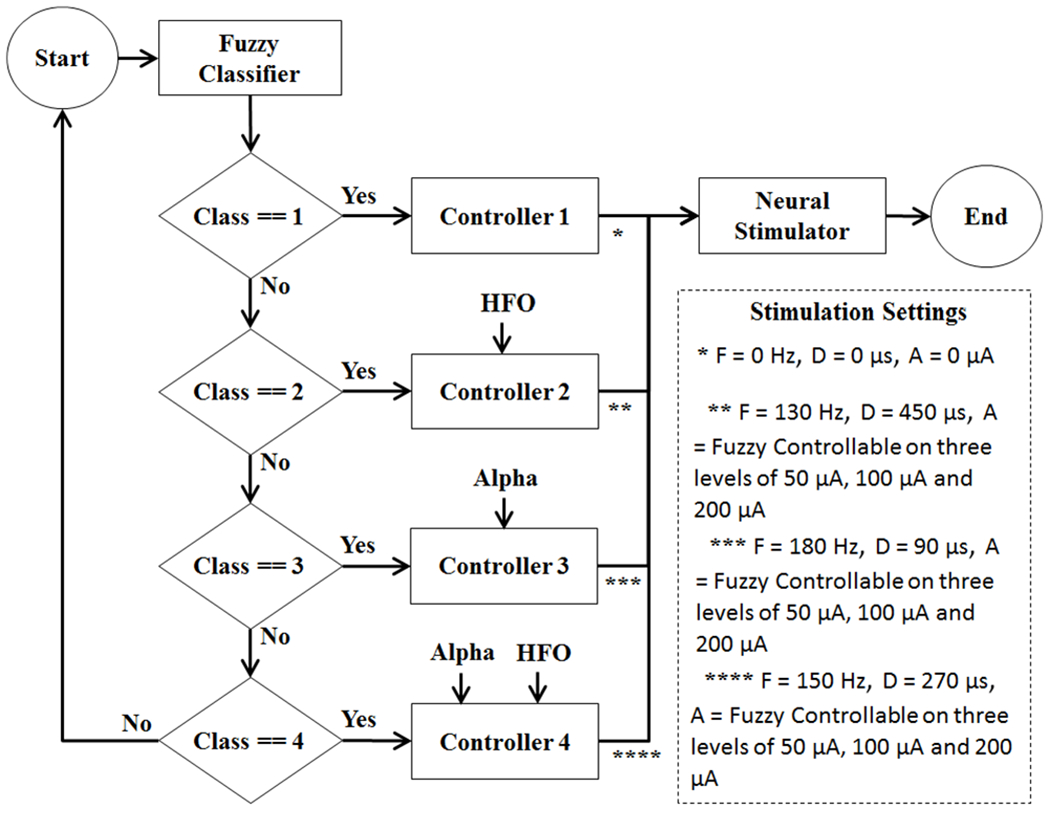
Diagram showing the activation of a controller after the fuzzy classification. F: Stimulation Pulse Frequency, D: Stimulation Pulse Duration, A: Stimulation Pulse Amplitude.
Controller 1 is a simple on-off controller which is activated when Class 1 (Normal) is detected. In this case, the stimulation settings for frequency, duration and amplitude of the stimulation pulse are all set to zero to turn off the neural stimulator. This controller, due to its simplicity, has been implemented with a simple on-off control algorithm.
Controllers 2-4 are fuzzy controllers which are activated when the associated class (disease) is detected in the fuzzy classifier. Fuzzy logic is a recognized technique for the control of any arising problems. The advantage of fuzzy logic controller is its aptitude to deal with nonlinearities and uncertainties. Controllers 2-4, each supply different stimulation settings to the neural stimulator for frequency, duration and amplitude of the stimulation pulse. These specifications have been listed in Fig. 5. The amplitude of the stimulation pulse is dynamically adjusted in each fuzzy controller based on the detection of the disease state (mild, moderate, severe), while the frequency and durations are fixed under each controller. The structure of the fuzzy logic controllers 2-4 are presented in Fig. 6–8, respectively.
Fig. 6.
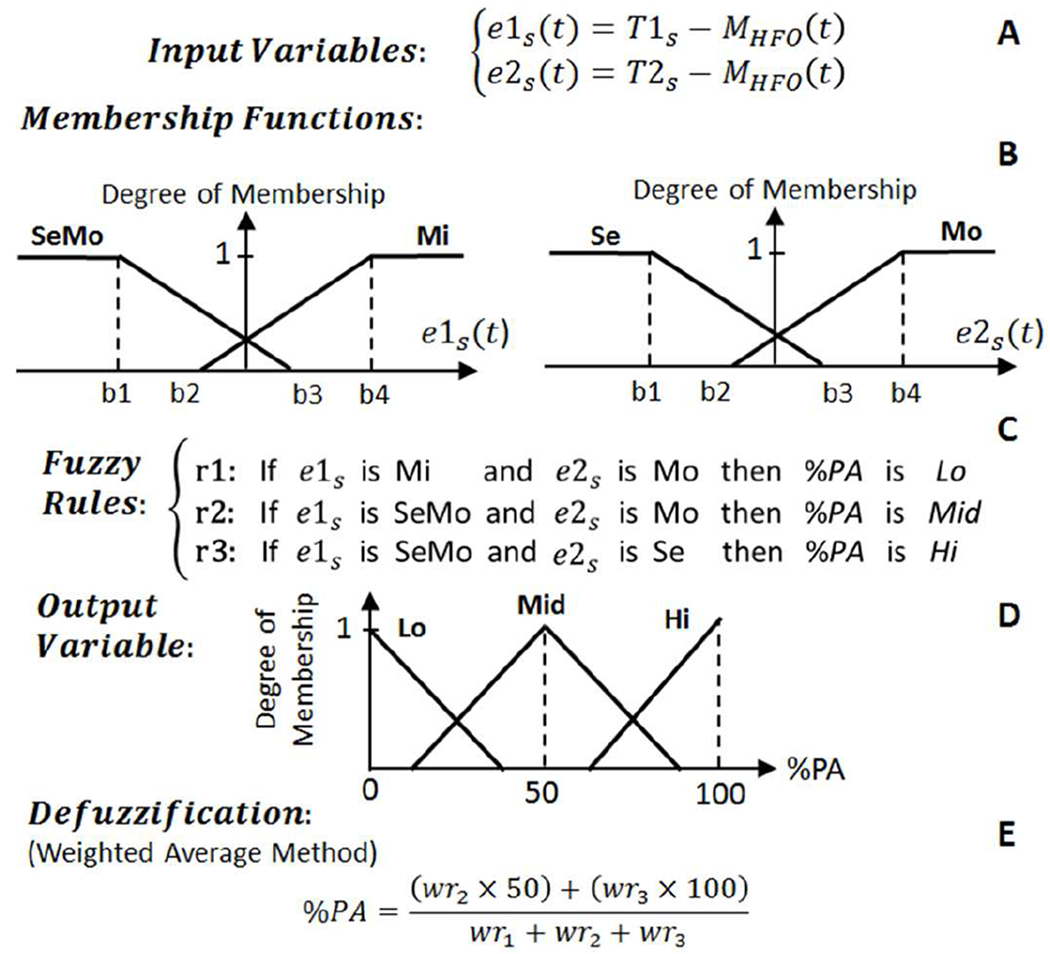
The structure of fuzzy logic control approach for Controller 2 which operates on Class 2 data. T1s is the threshold for distinguishing between mild (Mi) and moderate (Mo) epilepsy seizure states. T2s is the threshold for distinguishing between severe (Se) and Mo epilepsy seizure states.
Fig. 8.
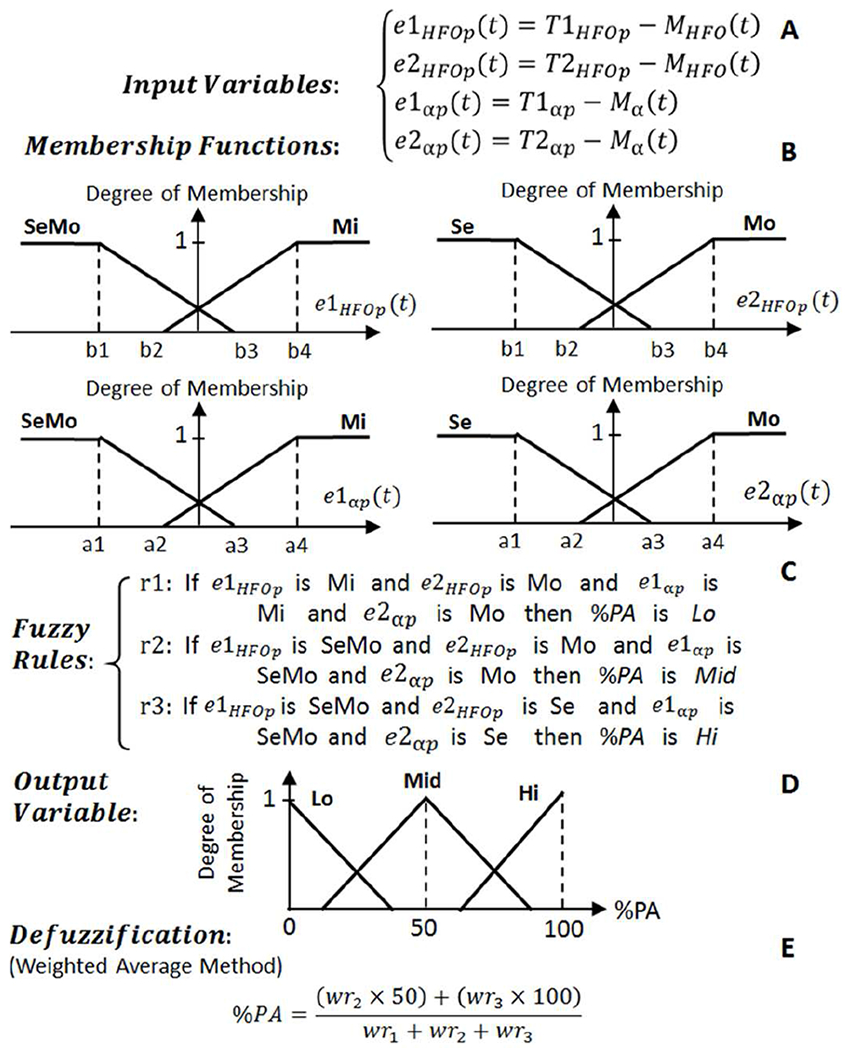
The structure of fuzzy logic control approach for Controller 4 which operates on Class 4 data. T1HFOp and T1αp are the thresholds for distinguishing between mild (Mi) and moderate (Mo) PD states. T2HFOp and T2αp are the thresholds for distinguishing between Mo and severe (Se) PD states.
Controllers 2 and 3 consist of two input variables, and Controller 4 consists of four input variables. The fuzzy input variables for Controller 2-4 are defined based on the equations presented in Fig. 6–8 (A). Each input variable is represented by two fuzzy sets of trapezoidal-shaped membership functions (Fig. 6–8 (B)). Upon computation of the degree of membership to each fuzzy set, three fuzzy rules (Fig. 6–8 (C)) are assessed and each rule’s weight (wri) is calculated. The percentage of the DBS pulse amplitude (%PA) as the output variable (Fig. 6–8 (D)) is presented with three triangular-shaped fuzzy sets of Low (Lo), Medium (Mid), and High (Hi) profiles. The final stage is the defuzzification to transform the fuzzy results into a single crisp output. The weighted average defuzzification method (Fig. 6–8 (E)) has been implemented to obtain %PA index number ranging from 0 to 100. The %PA is then used to adjust the amplitude of the stimulation pulse on three levels of 50 μA (index ≤ 30), 100 μA (30 < index < 70), and 200 μA (index ≥ 70). To avoid the induced paresthesia [48] which may occur as a results of a sudden jump on amplitude variations, the stimulation pulse amplitude is ramped up and down when changing from one amplitude level to another one.
3). NEURAL STIMULATOR:
The neural stimulator circuit (Fig. 2 (F)) consists of the ATxmega32E5 microcontroller, an adjustable current source (LM334, Texas Instruments, Inc.), a silicon N-channel MOSFET (RUM002N02T2L, ROHM Semiconductor, Inc.), a digital potentiometer (DP) (MAX5477, Maxim Integrated, Inc.) and a capacitor (C9).
The neural stimulator can generate biphasic passive-charge-balanced current stimulation pulses with programmable amplitudes, frequency, and duration. The amplitude of the stimulation pulse is digitally programmable from 7μA to 1735 μA, in 256 steps through the MAX5477 DP. The microcontroller drives the gate voltage of the RUM002N02T2L to control the operation of the adjustable current source (LM334). The LM334 is an adjustable current source with an excellent current regulation from 1 μA to 10 mA. The current amplitude (Iv) is set via the variable resistor (Rv) between the low and wiper terminals of the MAX5477 DP:
| (3) |
where VR is the voltage across Rv. For normal room temperature of 20-25 °C, VR is about 63 mV. The MAX5477 DP has a selectable resistance range of 39 Ω to 9.96 kΩ (256 linear steps, each step is 39 Ω), and thus the Iv can be programmed to deliver currents from about 7 μA to around 1700 μA.
The frequency and duration of the stimulation pulses are also programmable in any user-desired value through the program. The adaptive stimulation pulses (Stim-Out in Fig. 2 (F)) are delivered to the brain through the CE4 electrode pad. The neural stimulator circuit employs the passive charge balancing method to reduce some adverse effects such as tissue injury.
The proposed closed-loop DBS device is battery operated that can have its full functionality using a 2.7-3.5 V power source. A CR2032 coin battery (3V) is used to supply power to the device.
B. DEVICE FABRICATION
Fig. 9 shows the fabricated DBS device. It has been manufactured on a two-layer PCB with all the components on the top layer. The PCB has a semi-round shape (internal radius: 11 mm), hidden under the CR2032 battery holder (Fig. 9 (A–C)) with a weight of 1.3 g without battery and battery holder (Fig. 9 (D)). The total weight of the device including everything is around 5.1 g (Fig. 9 (E)) which can facilitate back-mountable laboratory experiments in large or small animals.
Fig. 9.
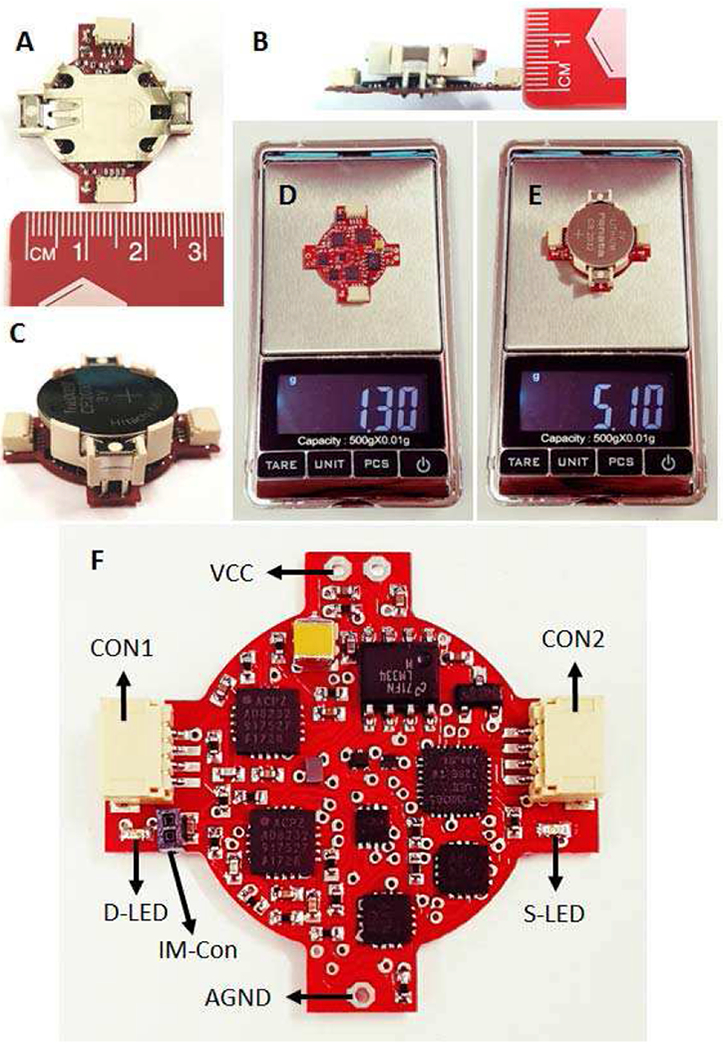
The fabricated closed-loop DBS device. (A-B) Device measurements. (C) Complete device. (D) Weight of the device without the battery and battery holder. (E) Total weight of the complete device. (F) The user interface components.
Fig. 9 (F) demonstrates the user interface parts on the device. Two 4-way connectors are included on both sides of the PCB, one for recording/stimulation electrode (CON1), and the other for serial communication (CON2). Moreover, two LEDs are included on each side of the device to show the classified disease. In addition, the user can switch between the single-ended and differential recordings using the input-mode connector (IM-Con). If the IM-Con is open, neuronal recordings are conducted differentially. Otherwise, a small jumper connector should be used to connect the IM-Con pins for single-ended recordings.
III. RESULTS
A. EXPERIMENT 1
Experiment 1 includes a bench evaluation of the device using four sets of sinusoidal signals representing Class 1 to 4 (four disease conditions). The purpose of this experiment was to evaluate the device for delivering appropriate stimulation pulses associated with each class. Two sinusoidal signals were combined to create four different disease signals. Each disease signal was delivered to the input of the neural sensor via the AO-0 output of the myDAQ device (National Instrument Inc., USA). Table 3 shows the specifications of the four disease signals. Signal 1 represents the normal condition when both the potential alpha and HFO biomarkers have normal amplitudes. Signal 2 represents the epilepsy disease when the potential HFO biomarker has abnormal amplitude. Signal 3 represents the depression disease when the potential alpha biomarker has abnormal amplitude. Signal 4 represents the PD condition when both the potential alpha and HFO biomarkers have abnormal amplitudes.
TABLE III.
Characteristics of four disease signals for the evaluation of the device in Experiment 1.
| Signal 1 (Normal) | Signal 2 (Epilepsy) | Signal 3 (Depression) | Signal 4 (PD) |
|---|---|---|---|
| 10 Hz (100 μV) representing normal Alpha combined with 300 Hz (100 μV) representing normal HFO | 10 Hz (100 μV) representing normal Alpha combined with 300 Hz (600 μV) representing abnormal HFO | 10 Hz (600 μV) representing abnormal Alpha combined with 300 Hz (100 μV) representing normal HFO | 10 Hz (600 μV) representing abnormal Alpha combined with 300 Hz (600 μV) representing abnormal HFO |
The results captured from the output of the neural stimulator over a 10 kΩ load resistor are shown in Fig. 10. Signal 1 contains normal alpha and HFO components, and therefore the stimulation response (Fig. 10 (A)) is off. Signal 2 contains normal alpha and abnormal HFO components, and therefore the stimulation response includes pulses with frequency of 130 Hz, duration of 450 μs, and amplitude of 200 μA (2V/10 kΩ) (Fig. 10 (B)). Signal 3 contains abnormal alpha and normal HFO components, and therefore the stimulation response includes pulses with frequency of 180 Hz, duration of 90 μs, and amplitude of 200 μA (Fig. 10 (C)). Signal 4 contains abnormal alpha and abnormal HFO components, and therefore the stimulation response includes pulses with frequency of 150 Hz, duration of 270 μs and amplitude of 200 μA (Fig. 10 (D)).
Fig. 10.
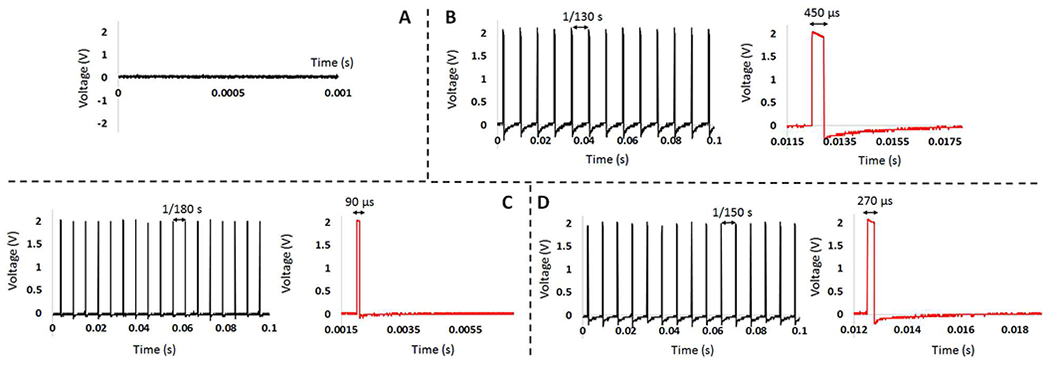
(A) Output of the neural stimulator for Signal 1 that represents normal condition. (B) Output of the neural stimulator for Signal 2 that represents epilepsy disease. (C) Output of the neural stimulator for Signal 3 that represents depression disease. (D) Output of the neural stimulator for Signal 4 that represents PD. The red graphs give one period of the stimulation pulse showing the pulse duration.
B. EXPERIMENT 2
Experiment 2 includes a bench evaluation of the device with a normal pre-recorded neural signal captured from a mouse hippocampus by researchers in Laval University, Canada. It includes a range of frequencies up to 6 kHz, and a maximum pick-to pick amplitude of 400 μV. This signal was sent to the device via the arbitrary waveform generator (ARB) of the myDAQ device. The output of the neural stimulator over a 10 kΩ load resistor in response to the normal pre-recorded neural signal was measured. The neural stimulator was turned off by detection of the normal alpha and HFO ranges by the fuzzy Controller 1 algorithm and generated zero volt potentials at output.
C. EXPERIMENT 3
Experiment 3 includes a bench evaluation of the device with a pre-recorded neural signal modified to potentially represent the epilepsy condition. For this purpose, the normal pre-recorded neural signal was first converted from the time domain into the frequency domain. Then, the amplitude of the HFO biomarker in the frequency range of 200-400 Hz was randomly amplified (up to two-fold) to potentially represent the seizures of epilepsy in mild, moderate and severe states. Next, the modified signal was transferred back to the time-domain and used as input to the device.
Fig. 11 (A) shows the result obtained from the output of the neural stimulator over a 10 kΩ load resistor. The graph shows 1 s of the stimulation pulses with 130 Hz frequency, 450 μs duration, and three amplitude levels produced by Fuzzy Controller 2. The 50 μA amplitude level is produced when the mild seizure is detected. The 100 μA amplitude level is produced when the moderate seizure is detected. The 200 μA amplitude level is produced when the severe seizure is detected. The amplitude of the stimulation pulses is ramped up and down between two consecutive amplitude levels to prevent the occurrence of paresthesia in the brain. The ramping is achieved through continuous programming of the MAX5477 DP with consecutive resistor values until the required current level is achieved.
Fig. 11.
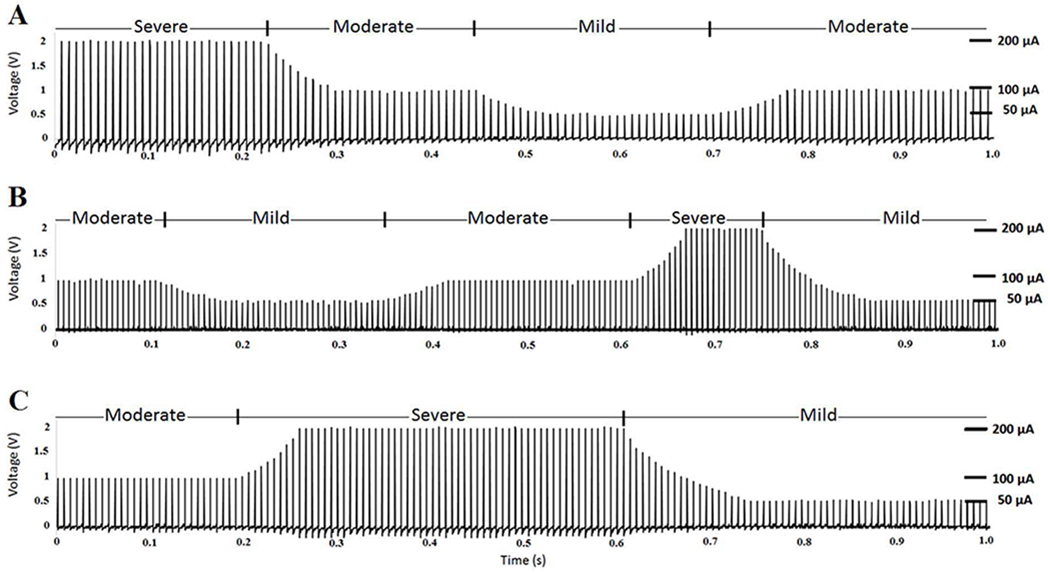
The bench experimental results (A) Stimulation pulses for the epilepsy neural signal produced by Controller 2. (B) Stimulation pulses for the depression neural signal produced by Controller 3. (C) Stimulation pulses for the PD neural signal produced by Controller 4.
D. EXPERIMENT 4
Experiment 4 includes a bench evaluation of the device with a pre-recorded neural signal modified to potentially represent the depression condition. For this purpose, the normal neural signal was first converted to the frequency domain. Then, the amplitude of the alpha biomarker in the frequency range of 8-13 Hz was randomly amplified (up to two-fold) to potentially represent the depression disease in mild, moderate, and severe states. Then, the depression neural signal was transferred to the time-domain and used as input to the device.
Fig. 11 (B) demonstrates the result obtained from the output of the neural stimulator over a 10 kΩ load resistor. The graph shows 1 s of stimulation pulses with 180 Hz frequency, 90 μs duration, and three amplitude levels produced by Fuzzy Controller 3. The 50 μA amplitude level is produced when mild depression is detected. The 100 μA amplitude level is produced when moderate depression is detected. The 200 μA amplitude level is produced when severe depression is detected. The amplitude of the stimulation pulses is ramped up and down between two consecutive amplitude levels to prevent the occurrence of paresthesia in the brain.
E. EXPERIMENT 5
Experiment 5 includes a bench evaluation of the device with a pre-recorded neural signal modified to potentially represent the PD condition. For this purpose, the normal pre-recorded neural signal was first converted from the time domain into the frequency domain. Then, the amplitudes of the alpha and HFO biomarkers in the frequency range of 8-13 Hz and 200-400 Hz were randomly amplified (up to two-fold) to potentially represent the PD states of mild, moderate, and severe. Subsequently, the PD neural signal was transferred to the time-domain and used as input of the device.
Fig. 11 (C) shows the result obtained from the output of the neural stimulator over a 10 kΩ load resistor. The graph shows 1 s of the stimulation pulses with 150 Hz frequency, 270 μs duration, and three amplitudes produced by Fuzzy Controller 4. The 50 μA amplitude level is produced when mild PD state is detected. The 100 μA amplitude level is produced when moderate PD state is detected. The 200 μA amplitude level is produced when severe PD state is detected. Similarly, the amplitude of the stimulation pulses is ramped when changing between levels to prevent the occurrence of paresthesia in the brain. Therefore, there is no sudden change in the stimulation amplitude.
F. EXPERIMENT 6
Experiment 6 includes in-vitro evaluations of the device in saline solution which emulates the neuronal medium [49]. The saline solution contains 0.9% NaCl per litter of distilled water. The setup used for the in-vitro saline-based experiment is presented in Fig. 12. The pre-recorded normal and diseased modified neural signals were delivered to the saline solution one at a time using the ARB of the myDAQ device (via analog output AO-0). The signal delivered to the solution (NS on Fig. 12 (A–C)) emulates the neural source in the brain. In the current setup, a three-contact symmetric copper electrode (Fig. 12 (C)) was manufactured to represent the DBS lead. In this electrode, the middle contact has equal distances from the two side contacts. This signal propagates in the saline solution, and differentially recorded by the neural sensor through the recording contacts (R1 and R2 in Fig. 12 (A) and (C)). The recording is done in the presence of the stimulation pulses that is delivered via the stimulation contact (S in Fig. 12 (A) and (C)). The stimulation interference is cancelled through the electrode configuration approach [48], in which the stimulation electrode contact is symmetrically placed between the two recording electrodes. Using this approach, the stimulation interference acts as a common-mode signal which is then cancelled in the instrumentation amplifier. The output of the device is monitored through an oscilloscope connected to the stimulation contact.
Fig. 12.
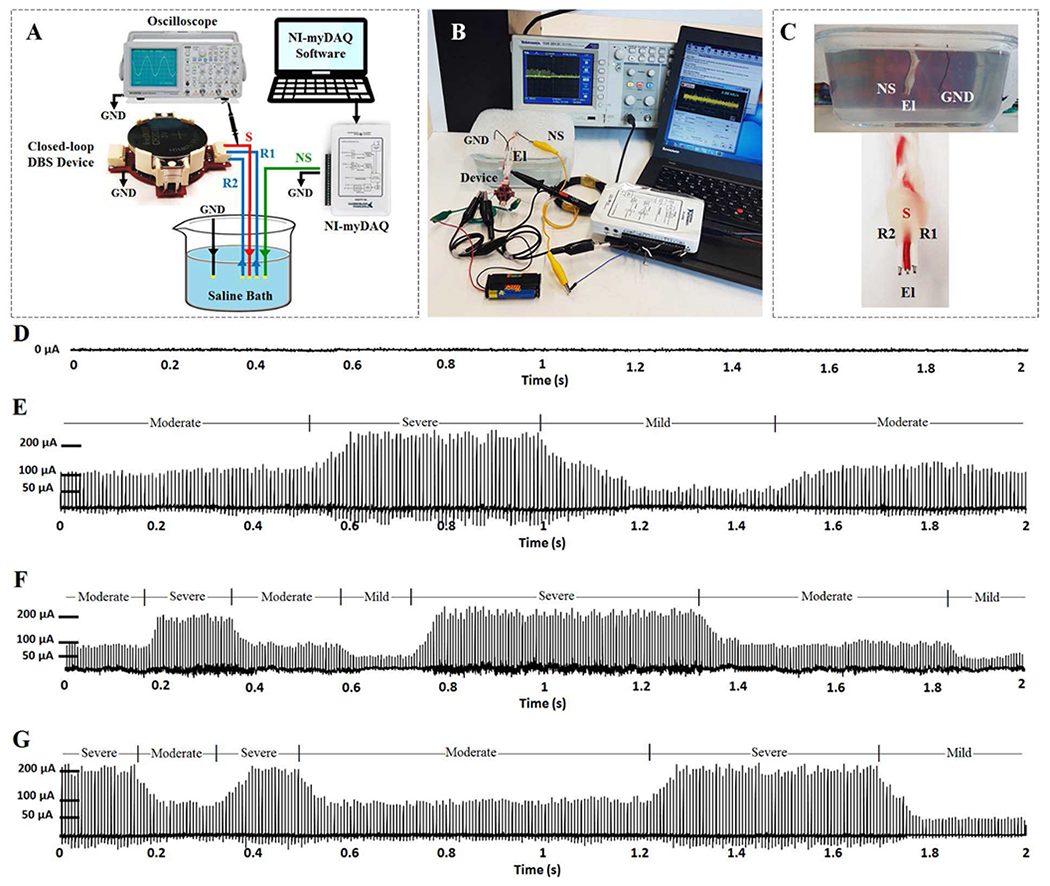
The in-vitro experiment setup and results. (A) The diagram presenting the in-vitro setup. (B) The test setup in real environment. (C) Cross section of the saline bath and close view of the recording and stimulation copper electrodes. (D) The stimulation output obtained from normal pre-recorded neural signal. (E) The stimulation output obtained from epilepsy neural signal. (F) The stimulation output obtained from depression neural signal. (G) The stimulation output obtained from PD signal.
The stimulation pulses in response to the normal, epilepsy, depression, and PD signals are presented in Fig. 12 (D–G), respectively. The results show that the device acurately detects the disease and accordingly set the correct stimulation parameters. In addition, the device can recognize the disease state and change the stimulation amplitude level based on the disease severity state (mild, moderate, and severe).
IV. DISCUSSION
In comparison with other devices [7]–[17], the current closed-loop DBS device uses multiple biomarkers in its feedback loop to adjust the stimulation parameters. The use of multiple biomarkers in a closed-loop DBS device is advantageous for the following reasons: (i) a single device can be used for multiple neurological disorders. This is quite helpful in research-based studies involving animal subjects with different diseases. The existing closed-loop DBS devices are optimized to tackle only one specific disorder and they cannot treat other disorders unless some of their internal components are modified. Therefore, the current device with the capability of recording multiple biomarkers enables treating multiple diseases across multiple murine subjects without any technical modifications. Also, a single device can be used to treat multiple symptoms within a single disease. Each symptom might be characterized with a different biomarker; accordingly, the capability of recording multiple biomarkers facilities control of multiple symptoms. Moreover, the use of multiple biomarkers enables optimum adjustment of stimulation parameters increasing the reliability of the closed-loop DBS.
The overall device benefits from a weight of 5.1 g, a semi-round shape with maximum external radius of 15 mm, and a battery lifetime of 18 hours. These specifications make the current closed-loop DBS device appropriate for back-mountable laboratory experiments with small animals. The PCB of the device is dual-layer with all the electrical components positioned on the top layer. Therefore, there is still room for further miniaturizing the device. The device utilises discrete components, however, the ASIC design approach would provide compact size and reduce power consumption. However, the ASIC-based development approach is expensive and time consuming. It is more appropriate for human-based applications rather than animal-based experiments in which lower development costs and faster design processes are the main priorities.
The neural sensor can record five physiological frequency bands that could contain potential biomarkers for several diseases. It is worth mentioning that the literature evidence for different biomarkers in different diseases comes from few groups worldwide in very small patient cohorts. Except for Parkinson’s disease, where a clear association of the beta biomarker has been confirmed, other biomarkers have been demonstrated in few cohorts. In this paper, we have tested different aspects of neural activity that could be associated with different neuro/psychiatric diseases.
The device can record five potential biomarkers including alpha (8-13 Hz), beta (13-30 Hz), slow gamma (30-45 Hz), high-frequency oscillations (200-400 Hz), and spikes (400-1000 Hz). Increasing the bandwidth of the first channel to more than 45 Hz and the second channel to less than 200 Hz is not suggested due to the deterioration of the measured neural signal interfering with the frequency of DBS pulses. However, the neural sensor bandwidth could be further extended from the low and high ends (adding delta (0.5-4Hz), and theta (4-8 Hz) and fast spike (> 1000 Hz). The reasons for not including these bands in the current device are due to the issues such as: (i) the device would be more sensitive to low-frequency artefacts (such as motion artefact (< 5 Hz)), and (ii) the need for having a more complex biomarker feature extraction and also a higher sampling frequency and therefore faster real-time processing which may result in higher power consumptions. However, it should be noticed that exclusion of other important frequency bands such as delta (0.5-3 Hz) and theta (3-8 Hz) potential biomarkers may lead to incapability of the device in treatment of some other neurological disorders. Thus, leaving these frequency bands unused could be a limitation of the current device, which can be taken into consideration for future developments.
Several closed-loop DBS devices use a simple on-off control algorithm [12], [48], [50]–[54], and are not able to automatically and adaptively adjust the stimulation parameters. Other devices use traditional control approaches such as proportional-integral (PI) control [8], [55], proportional-integral-derivative (PID) control [56], [57], autoregressive model [58], and iterative learning control [51]. However, some of these control approaches are based on an ideal mathematical model, and have not been examined with actual closed-loop DBS devices.
This device takes advantage of a fuzzy classifier and four controllers which can distinguish between four conditions (normal, epilepsy, depression, and PD), and three disease states (mild, moderate, and severe) through potential alpha and HFO biomarkers. The performance of the device was evaluated through six bench and in-vitro experiments. The device successfully classified the input disease signals into proper classes in both bench and in-vitro experiments. In addition, it correctly optimized the stimulation parameters for each condition. The current levels were controlled for different disease states. Going from one current level to another was implemented through a ramping algorithm with an average ramping time of 65 ms between two consecutive current levels. The signal amplitudes in in-vitro results (Fig. 12 (E–G)) contain some variations compared to the bench results (Fig. 11 (A–C)), which are due to the following reasons. The first reason could be the stimulation interference. In the bench evaluations, no stimulation interference was present. However, in the in-vitro saline experiments, the neural signal is recorded in presence of the stimulation pulses inducing noise on the neural sensor. The majority of the stimulation-related noise is rejected through the differential recording configuration. However, there may be still small residual stimulation components in the measured neural signal due to the possible minor difference in distance between the contacts of the electrode that was manually manufactured. The second reason could be that the stimulation pulses delivered into the saline solution are affected by the neural signal NS that is continuously injected to the solution. Since the amplitude of the stimulation pulses is much larger than the neural signals, the variations of the stimulation pulses appear to be small. However, despite the existence of these minor variations, the three amplitude current levels of 50 μA, 100 μA, and 200 μA, as well as the ramping intervals can be easily distinguished in Fig. 12 (E–G).
Different stimulation parameters have been reported in the literature for treatment of epilepsy [59], depression [60], and PD [61] conditions. In this device, the stimulation doses were chosen based on the reported values. However, the selected value for each stimulation parameter may not be the optimum setting for some patients. One future development could be the implementation of a pre-treatment period to identify the optimum frequency and duration values. The device would vary the frequency and duration values and then monitor their effect on the neural signals and the biomarkers’ amplitudes to select the best parameters. This will enable customization of the device for each patient through determination and use of patient-specific stimulation parameters.
The current device considers three parameters for each disease to distinguish between normal, mild, moderate, and severe disease states. They have been chosen by the application of normal and diseased neural signals to the device. The selection of the three parameters can be conducted manually by measuring the neural signals in different disease states and then assessing the biomarkers’ amplitude features, or can be conducted through artificial intelligent algorithms (such as neural network, or genetic algorithm) [62], [63].
The current implemented fuzzy control is based on the events occurring at the level of the neural activity. For example, the stimulation pulses are delivered after the seizure activity is detected. Implementation of prediction algorithms for event-based diseases such as epilepsy is also suggested. The stimulation pulses, if delivered before the seizure occurrence, may at least suppress the seizure intensity if could not totally prevent the seizure [64].
Future work should also focus on using all the five potential biomarkers to detect and treat an expanded list of neurological conditions. This, however, requires a better characterization of the neurological disorders and their respective potential biomarkers. The computational capability of the on-board microcontroller in conducting feature extraction, classification, and control was satisfactory. However, the computational burden of the calculations for the future device would be higher. To support such calculations, the following solutions can be considered: (i) a more advanced microcontroller can be utilized, (ii) a wireless transceiver can be used to relay the raw data to a fast off-board processor which would process the data and send commends back to the device for more efficient operation.
V. CONCLUSION
This study presented the design, fabrication, and evaluation of a multi-biomarker multi-disease closed-loop DBS device. The device is capable of measuring neural signals, detecting the disease type and state, and automatically and adaptively adjusting the stimulation parameters. The device is miniature (maximum radius: 15 mm), lightweight (5.1 g including battery), tetherless, and self-contained. Its performance was evaluated through six bench and in-vitro experiments using sinusoidal, normal pre-recorded, and diseased neural signals for normal, epilepsy, depression and PD conditions. The results obtained through these tests indicate the successful neural sensing, classification, control, and neural stimulating performance. The in-vivo evaluation of this closed-loop DBS approach is a major next step for determining the utility of the device. The in-vivo tests could then be conducted on at least four groups of animal models consisting of normal (control), epilepsy, depression, and PD phenotypes. Conducting in-vivo experiments will be essential for further proving the functionality of the device, and confirming its safety and durability.
Fig. 7.
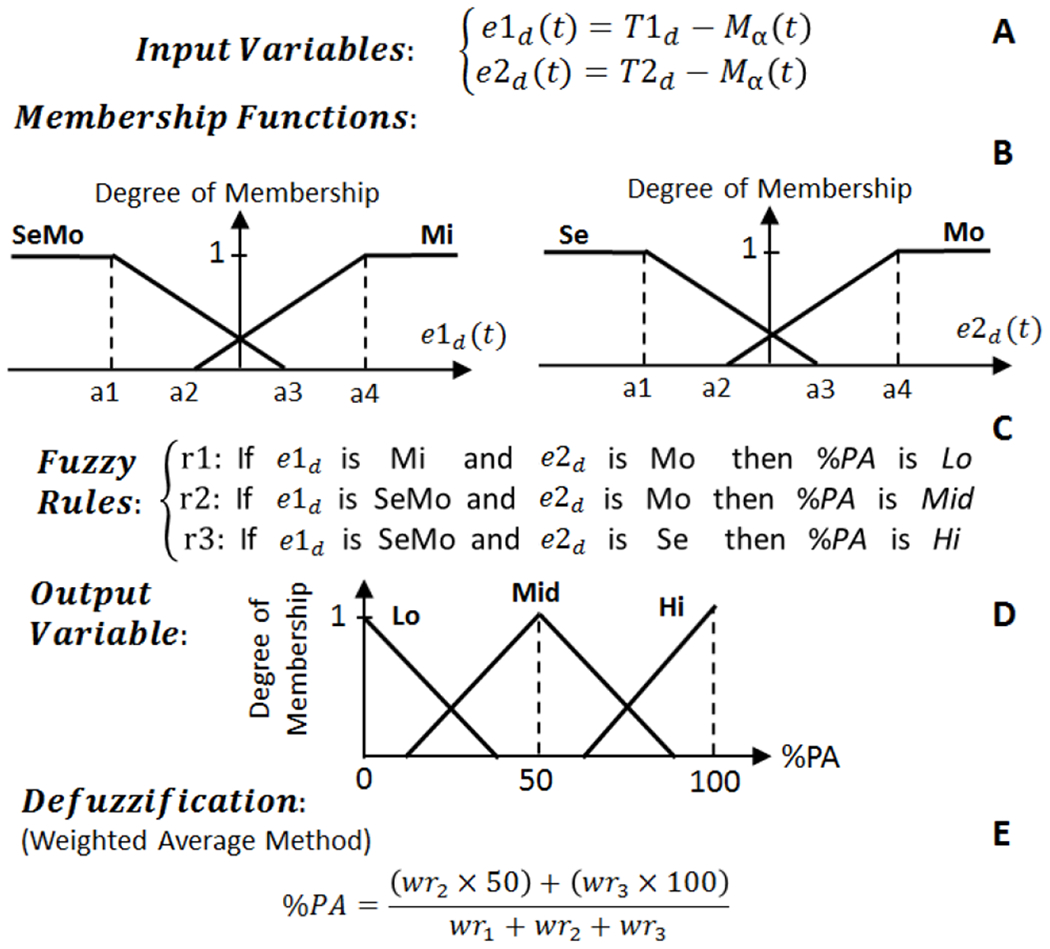
The structure of fuzzy logic control approach for Controller 3 which operates on Class 3 data. T1d is the threshold for distinguishing between mild (Mi) and moderate (Mo) depression states. T2d is the threshold value for distinguishing between Mo and severe (Se) depression states.
References
- [1].Chang SY, Kimble CJ, Kim I, Paek SB, Kressin KR, Boesche JB, et al. “Development of the Mayo Investigational Neuromodulation Control System: toward a closed-loop electrochemical feedback system for deep brain stimulation,” J Neurosurg, vol. 119, pp. 1556–65, 2013. [DOI] [PMC free article] [PubMed] [Google Scholar]
- [2].Nicole CS, Coralie de H, Margaret CT, Svjetlana M, Andrew MM, Ro’ee G, et al. “Adaptive deep brain stimulation for Parkinson’s disease using motor cortex sensing,” Journal of Neural Engineering, vol. 15, p. 046006, 2018. [DOI] [PMC free article] [PubMed] [Google Scholar]
- [3].Stanslaski S, Afshar P, Peng C, Giftakis J, Stypulkowski P, Carlson D, et al. “Design and Validation of a Fully Implantable, Chronic, Closed-Loop Neuromodulation Device With Concurrent Sensing and Stimulation,” Neural Systems and Rehabilitation Engineering, IEEE Transactions on, vol. 20, pp. 410–421, 2012. [DOI] [PubMed] [Google Scholar]
- [4].Jongwoo L, Hyo-Gyuem R, Kipke DR, and Flynn MP, “A 64 Channel Programmable Closed-Loop Neurostimulator With 8 Channel Neural Amplifier and Logarithmic ADC,” Solid-State Circuits, IEEE Journal of vol. 45, pp. 1935–1945, 2010. [Google Scholar]
- [5].Azin M, Guggenmos DJ, Barbay S, Nudo RJ, and Mohseni P, “A Battery-Powered Activity-Dependent Intracortical Microstimulation IC for Brain-Machine-Brain Interface,” Solid-State Circuits, IEEE Journal of, vol. 46, pp. 731–745, 2011. [Google Scholar]
- [6].Pinnell RC, Dempster J, and Pratt J, “Miniature wireless recording and stimulation system for rodent behavioural testing,” J Neural Eng, vol. 12, p. 066015, October 15 2015. [DOI] [PubMed] [Google Scholar]
- [7].Arlotti M, Rossi L, Rosa M, Marceglia S, and Priori A, “An external portable device for adaptive deep brain stimulation (aDBS) clinical research in advanced Parkinson’s Disease,” Med Eng Phys, vol. 38, pp. 498–505, May 2016. [DOI] [PubMed] [Google Scholar]
- [8].Hyo-Gyuem R, Jaehun J, Fredenburg JA, Dodani S, Patil PG, and Flynn MP, “A Fully Self-Contained Logarithmic Closed-Loop Deep Brain Stimulation SoC With Wireless Telemetry and Wireless Power Management,” Solid-State Circuits, IEEE Journal of, vol. 49, pp. 22132227, 2014. [Google Scholar]
- [9].Bledsoe Jonathan M., Kimble Christopher J., Covey Daniel P., Blaha Charles D., Agnesi Filippo, Mohseni Pedram, et al. “Development of the Wireless Instantaneous Neurotransmitter Concentration System for intraoperative neurochemical monitoring using fast-scan cyclic voltammetry,” Journal of Neurosurgery, vol. 111, pp. 712–723, 2009. [DOI] [PMC free article] [PubMed] [Google Scholar]
- [10].Abdelhalim K, Jafari HM, Kokarovtseva L, Perez Velazquez JL, and Genov R, “64-Channel UWB Wireless Neural Vector Analyzer SOC With a Closed-Loop Phase Synchrony-Triggered Neurostimulator,” Solid-State Circuits, IEEE Journal of, vol. 48, pp. 2494–2510, 2013. [Google Scholar]
- [11].Abdelhalim K, Jafari HM, Kokarovtseva L, Velazquez JLP, and Genov R, “64-Channel UWB wireless neural vector analyzer and phase synchrony-triggered stimulator SoC,” in ESSCIRC (ESSCIRC), 2012 Proceedings of the, 2012, pp. 281–284. [Google Scholar]
- [12].Parastarfeizabadi M, Kouzani AZ, Gibson I, and Tye SJ, “A miniature closed-loop deep brain stimulation device,” in 2016 38th Annual International Conference of the IEEE Engineering in Medicine and Biology Society (EMBC), 2016, pp. 1786–1789. [DOI] [PubMed] [Google Scholar]
- [13].Jankovic J, “Parkinson’s disease: clinical features and diagnosis,” Journal of Neurology, Neurosurgery & Psychiatry, vol. 79, pp. 368–376, 2008. [DOI] [PubMed] [Google Scholar]
- [14].Rivlin-Etzion M, Marmor O, Heimer G, Raz A, Nini A, and Bergman H, “Basal ganglia oscillations and pathophysiology of movement disorders,” Curr Opin Neurobiol, vol. 16, pp. 629–37, December 2006. [DOI] [PubMed] [Google Scholar]
- [15].Little S and Brown P, “What brain signals are suitable for feedback control of deep brain stimulation in Parkinson’s disease?,” Ann NY Acad Sci, vol. 1265, pp. 9–24, 2012. [DOI] [PMC free article] [PubMed] [Google Scholar]
- [16].Johnson LA, Nebeck SD, Muralidharan A, Johnson MD, Baker KB, and Vitek JL, “Closed-Loop Deep Brain Stimulation Effects on Parkinsonian Motor Symptoms in a Non-Human Primate - Is Beta Enough?,” Brain Stimul, vol. 9, pp. 892–896, Nov-Dec 2016. [DOI] [PMC free article] [PubMed] [Google Scholar]
- [17].Morishita T and Inoue T, “Need for multiple biomarkers to adjust parameters of closed-loop deep brain stimulation for Parkinson’s disease,” Neural Regeneration Research, vol. 12, pp. 747–748, 05/15/accepted 2017. [DOI] [PMC free article] [PubMed] [Google Scholar]
- [18].Gleason CA, Kaula NF, Hricak H, Schmidt RA, and Tanagho EA, “The effect of magnetic resonance imagers on implanted neurostimulators,” Pacing Clin Electrophysiol, vol. 15, pp. 81–94, January 1992. [DOI] [PubMed] [Google Scholar]
- [19].Shellock FG, Magnetic resonance safety update 2002: Implants and devices. [DOI] [PubMed]
- [20].Parastarfeizabadi M and Kouzani AZ, “A Miniature Low-Power Multi-Biomarker-Based Brain Sensor for Closed-Loop DBS,” IEEE Sensors Journal, vol. 17, pp. 3109–3115, 2017. [Google Scholar]
- [21].Parastarfeizabadi M and Kouzani AZ, “Advances in closed-loop deep brain stimulation devices,” Journal of NeuroEngineering and Rehabilitation, vol. 14, p. 79, August 11 2017. [DOI] [PMC free article] [PubMed] [Google Scholar]
- [22].Parastarfeizabadi Mahboubeh, Kouzani Abbas Z., Jaclyn Beckinghausen Tao Lin, and Sillitoe RV, “A Programmable Multi-biomarker Neural Sensor for Closed-loop DBS,” IEEE Access, Accepted 2018. [DOI] [PMC free article] [PubMed] [Google Scholar]
- [23].Angotzi GN, Boi F, Zordan S, Bonfanti A, and Vato A, “A programmable closed-loop recording and stimulating wireless system for behaving small laboratory animals,” Sci. Rep, vol. 4, 2014. [DOI] [PMC free article] [PubMed] [Google Scholar]
- [24].Neumann WJ, Huebl J, Brucke C, Gabriels L, Bajbouj M, Merkl A, et al. “Different patterns of local field potentials from limbic DBS targets in patients with major depressive and obsessive compulsive disorder,” Mol Psychiatry, vol. 19, pp. 1186–1192, 2014. [DOI] [PMC free article] [PubMed] [Google Scholar]
- [25].Thevathasan W, Pogosyan A, Hyam JA, Jenkinson N, Foltynie T, Limousin P, et al. “Alpha oscillations in the pedunculopontine nucleus correlate with gait performance in parkinsonism,” Brain, vol. 135, pp. 148–160, 2012. [DOI] [PMC free article] [PubMed] [Google Scholar]
- [26].Tinkhauser G, Pogosyan A, Little S, Beudel M, Herz DM, Tan H, et al. “The modulatory effect of adaptive deep brain stimulation on beta bursts in Parkinson’s disease,” Brain, vol. 140, pp. 1053–1067, April 1 2017. [DOI] [PMC free article] [PubMed] [Google Scholar]
- [27].Kühn AA, Tsui A, Aziz T, Ray N, Brücke C, Kupsch A, et al. “Pathological synchronisation in the subthalamic nucleus of patients with Parkinson’s disease relates to both bradykinesia and rigidity,” Experimental Neurology, vol. 215, pp. 380–387, 2009. [DOI] [PubMed] [Google Scholar]
- [28].Toledo JB, López-Azcárate J, Garcia-Garcia D, Guridi J, Valencia M, Artieda J, et al. “High beta activity in the subthalamic nucleus and freezing of gait in Parkinson’s disease,” Neurobiology of Disease, vol. 64, pp. 60–65, 2014. [DOI] [PubMed] [Google Scholar]
- [29].Maling N, Hashemiyoon R, Foote KD, Okun MS, and Sanchez JC, “Increased Thalamic Gamma Band Activity Correlates with Symptom Relief following Deep Brain Stimulation in Humans with Tourette’s Syndrome,” PLOS ONE, vol. 7, p. e44215, 2012. [DOI] [PMC free article] [PubMed] [Google Scholar]
- [30].Beudel M, Little S, Pogosyan A, Ashkan K, Foltynie T, Limousin P, et al. “Tremor Reduction by Deep Brain Stimulation Is Associated With Gamma Power Suppression in Parkinson’s Disease,” Neuromodulation, vol. 18, pp. 349–354, 2015. [DOI] [PMC free article] [PubMed] [Google Scholar]
- [31].Foffani G and Priori A, “Deep brain stimulation in Parkinson’s disease can mimic the 300 Hz subthalamic rhythm,” Brain, vol. 129, p. e59; author reply e60, December 2006. [DOI] [PubMed] [Google Scholar]
- [32].Lopez-Azcarate J, Tainta M, Rodriguez-Oroz MC, Valencia M, Gonzalez R, Guridi J, et al. “Coupling between beta and high-frequency activity in the human subthalamic nucleus may be a pathophysiological mechanism in Parkinson’s disease,” J Neurosci, vol. 30, pp. 6667–77, May 12 2010. [DOI] [PMC free article] [PubMed] [Google Scholar]
- [33].Zijlmans M, Jiruska P, Zelmann R, Leijten FS, Jefferys JG, and Gotman J, “High-frequency oscillations as a new biomarker in epilepsy,” Ann Neurol, vol. 71, pp. 169–78, February 2012. [DOI] [PMC free article] [PubMed] [Google Scholar]
- [34].Worrell G and Gotman J, “High-frequency oscillations and other electrophysiological biomarkers of epilepsy: clinical studies,” Biomark Med, vol. 5, pp. 557–66, October 2011. [DOI] [PMC free article] [PubMed] [Google Scholar]
- [35].Assenza G, Capone F, di Biase L, Ferreri F, Florio L, Guerra A, et al. “Oscillatory Activities in Neurological Disorders of Elderly: Biomarkers to Target for Neuromodulation,” Frontiers in Aging Neuroscience, vol. 9, 2017-June-13 2017. [DOI] [PMC free article] [PubMed] [Google Scholar]
- [36].Bragin A, Engel J Jr., Wilson CL, Fried I, and Buzsaki G, “High-frequency oscillations in human brain,” Hippocampus, vol. 9, pp. 13742, 1999. [DOI] [PubMed] [Google Scholar]
- [37].Danish SF, Moyer JT, Finkel LH, Baltuch GH, Jaggi JL, Priori A, et al. “High-frequency oscillations (>200 Hz) in the human nonparkinsonian subthalamic nucleus,” Brain Res Bull, vol. 74, pp. 84–90, September 14 2007. [DOI] [PubMed] [Google Scholar]
- [38].Weiss SA, Alvarado-Rojas C, Bragin A, Behnke E, Fields T, Fried I, et al. “Ictal onset patterns of local field potentials, high frequency oscillations, and unit activity in human mesial temporal lobe epilepsy,” Epilepsia, vol. 57, pp. 111–21, January 2016. [DOI] [PMC free article] [PubMed] [Google Scholar]
- [39].Shreve LA, Velisar A, Malekmohammadi M, Koop MM, Trager M, Quinn EJ, et al. “Subthalamic oscillations and phase amplitude coupling are greater in the more affected hemisphere in Parkinson’s disease,” Clinical Neurophysiology, vol. 128, pp. 128–137, 2017/January/01/ 2017. [DOI] [PubMed] [Google Scholar]
- [40].Lofredi R, Neumann W-J, Bock A, Horn A, Huebl J, Siegert S, et al. “Dopamine-dependent scaling of subthalamic gamma bursts with movement velocity in patients with Parkinson’s disease,” eLife, vol. 7, p. e31895, 2018/February/01 2018. [DOI] [PMC free article] [PubMed] [Google Scholar]
- [41].Zadeh LA, “Fuzzy sets,” Information and Control, vol. 8, pp. 338–353, 1965/June/01/ 1965. [Google Scholar]
- [42].Ganji MF and Abadeh MS, “A fuzzy classification system based on Ant Colony Optimization for diabetes disease diagnosis,” Expert Systems with Applications, vol. 38, pp. 14650–14659, 2011/November/01/ 2011. [Google Scholar]
- [43].Nozaki K, Ishibuchi H, and Tanaka H, “Adaptive fuzzy rule-based classification systems,” IEEE Transactions on Fuzzy Systems, vol. 4, pp. 238–250, 1996. [Google Scholar]
- [44].Moshtagh-Khorasani M, Akbarzadeh-T M-R, Jahangiri N, and Khoobdel M, “An intelligent system based on fuzzy probabilities for medical diagnosis– a study in aphasia diagnosis,” Journal of Research in Medical Sciences : The Official Journal of Isfahan University of Medical Sciences, vol. 14, pp. 89–103, 2009. [PMC free article] [PubMed] [Google Scholar]
- [45].Polat K and Güneş S, “An expert system approach based on principal component analysis and adaptive neuro-fuzzy inference system to diagnosis of diabetes disease,” Digital Signal Processing, vol. 17, pp. 702–710, 2007/July/01/ 2007. [Google Scholar]
- [46].Al-Dmour JA, Sagahyroon A, Al-Ali A, and Abusnana S, “A fuzzy logic–based warning system for patients classification,” Health Informatics Journal, vol. 0, p. 1460458217735674, 2017. [DOI] [PubMed] [Google Scholar]
- [47].Nilashi M, Ibrahim O, Ahmadi H, and Shahmoradi L, “A knowledge-based system for breast cancer classification using fuzzy logic method,” Telematics and Informatics, vol. 34, pp. 133–144, 2017/July/01/ 2017. [Google Scholar]
- [48].Little S, Pogosyan A, Neal S, Zavala B, Zrinzo L, Hariz M, et al. “Adaptive deep brain stimulation in advanced Parkinson disease,” Annals Of Neurology, vol. 74, pp. 449–457, 2013. [DOI] [PMC free article] [PubMed] [Google Scholar]
- [49].Chaturvedi V and Amrutur B, “An Area-Efficient Noise-Adaptive Neural Amplifier in 130 nm CMOS Technology,” IEEE Journal on Emerging and Selected Topics in Circuits and Systems, vol. 1, pp. 536–545, 2011. [Google Scholar]
- [50].Su F, Wang J, Deng B, Wei XL, Chen YY, Liu C, et al. “Adaptive control of Parkinson’s state based on a nonlinear computational model with unknown parameters,” Int J Neural Syst, vol. 25, p. 1450030, 2015. [DOI] [PubMed] [Google Scholar]
- [51].Liu C, Wang J, Li H, Xue Z, Deng B, and Wei X, “Model-based iterative learning control of Parkinsonian state in thalamic relay neuron,” Communications in Nonlinear Science and Numerical Simulation, vol. 19, pp. 3255–3266, 2014/September/01/ 2014. [Google Scholar]
- [52].Little S, Pogosyan A, Neal S, Zrinzo L, Hariz M, Foltynie T, et al. “Controlling Parkinson’s Disease With Adaptive Deep Brain Stimulation,” p. e51403, 2014. [DOI] [PMC free article] [PubMed] [Google Scholar]
- [53].Little S, Beudel M, Zrinzo L, Foltynie T, Limousin P, Hariz M, et al. “Bilateral adaptive deep brain stimulation is effective in Parkinson’s disease ,” Journal of Neurology, Neurosurgery & Psychiatry, September 30, 2015. 2015. [DOI] [PMC free article] [PubMed] [Google Scholar]
- [54].Wu C, Cheng C, Ou-Yang Y, Chen C, Chen W, Ker M, et al. “Design considerations and clinical applications of closed-loop neural disorder control SoCs,” in 2017 22nd Asia and South Pacific Design Automation Conference (ASP-DAC), 2017, pp. 295–298. [Google Scholar]
- [55].Hyo-Gyuem R, Jaehun J, Fredenburg JA, Dodani S, Patil P, and Flynn MP, “A wirelessly powered log-based closed-loop deep brain stimulation SoC with two-way wireless telemetry for treatment of neurological disorders,” in VLSI Circuits (VLSIC), 2012 Symposium on, 2012, pp. 70–71. [Google Scholar]
- [56].Gorzelic P, Schiff SJ, and Sinha A, “Model-based rational feedback controller design for closed-loop deep brain stimulation of Parkinson’s disease,” J Neural Eng, vol. 10, p. 026016, 2013. [DOI] [PubMed] [Google Scholar]
- [57].Dunn EM and Lowery MM, “Simulation of PID control schemes for closed-loop deep brain stimulation,” in Neural Engineering (NER), 2013 6th International IEEE/EMBS Conference on, 2013, pp. 1182–1185. [Google Scholar]
- [58].Santaniello S, Fiengo G, Glielmo L, and Grill WM, “Closed-loop control of deep brain stimulation: a simulation study,” IEEE Trans Neural Syst Rehabil Eng, vol. 19, pp. 15–24, 2011. [DOI] [PubMed] [Google Scholar]
- [59].Lin Y and Wang Y, “Neurostimulation as a promising epilepsy therapy,” Epilepsia Open, vol. 2, pp. 371–387, December 2017. [DOI] [PMC free article] [PubMed] [Google Scholar]
- [60].Ramasubbu R, Lang S, and Kiss ZHT, “Dosing of Electrical Parameters in Deep Brain Stimulation (DBS) for Intractable Depression: A Review of Clinical Studies,” Front Psychiatry, vol. 9, p. 302, 2018. [DOI] [PMC free article] [PubMed] [Google Scholar]
- [61].Dayal V, Limousin P, and Foltynie T, “Subthalamic Nucleus Deep Brain Stimulation in Parkinson’s Disease: The Effect of Varying Stimulation Parameters,” Journal of Parkinson’s disease, vol. 7, pp. 235–245, 2017. [DOI] [PMC free article] [PubMed] [Google Scholar]
- [62].Chaturvedi A, Lujan JL, and McIntyre CC, “Artificial neural network based characterization of the volume of tissue activated during deep brain stimulation,” J Neural Eng, vol. 10, p. 056023, October 2013. [DOI] [PMC free article] [PubMed] [Google Scholar]
- [63].PINEAU J, GUEZ A, VINCENT R, PANUCCIO G, and AVOLI M, “TREATING EPILEPSY VIA ADAPTIVE NEUROSTIMULATION: A REINFORCEMENT LEARNING APPROACH,” International Journal of Neural Systems, vol. 19, pp. 227–240, 2009. [DOI] [PMC free article] [PubMed] [Google Scholar]
- [64].Wang L, Guo H, Yu X, Wang S, Xu C, Fu F, et al. “Responsive Electrical Stimulation Suppresses Epileptic Seizures in Rats,” PLOS ONE, vol. 7, p. e38141, 2012. [DOI] [PMC free article] [PubMed] [Google Scholar]


