Abstract
Adaptive optics (AO) based ophthalmic imagers, such as scanning laser ophthalmoscopes (SLO) and optical coherence tomography (OCT), are used to evaluate the structure and function of the retina with high contrast and resolution. Fixational eye movements during a raster-scanned image acquisition lead to intra-frame and intra-volume distortion, resulting in an inaccurate reproduction of the underlying retinal structure. For three-dimensional (3D) AO-OCT, segmentation-based and 3D correlation based registration methods have been applied to correct eye motion and achieve a high signal-to-noise ratio registered volume. This involves first selecting a reference volume, either manually or automatically, and registering the image/volume stream against the reference using correlation methods. However, even within the chosen reference volume, involuntary eye motion persists and affects the accuracy with which the 3D retinal structure is finally rendered. In this article, we introduced reference volume distortion correction for AO-OCT using 3D correlation based registration and demonstrate a significant improvement in registration performance via a few metrics. Conceptually, the general paradigm follows that developed previously for intra-frame distortion correction for 2D raster-scanned images, as in an AOSLO, but extended here across all three spatial dimensions via 3D correlation analyses. We performed a frequency analysis of eye motion traces before and after intra-volume correction and revealed how periodic artifacts in eye motion estimates are effectively reduced upon correction. Further, we quantified how the intra-volume distortions and periodic artifacts in the eye motion traces, in general, decrease with increasing AO-OCT acquisition speed. Overall, 3D correlation based registration with intra-volume correction significantly improved the visualization of retinal structure and estimation of fixational eye movements.
1. Introduction
In scanning ophthalmic imagers such as adaptive optics scanning laser ophthalmoscopy (AO-SLO) and adaptive optics optical coherence tomography (AO-OCT) [1–3], the illumination beam scans the retina in a raster pattern such that different parts of the retina are encoded into an image at essentially different time-points. At each time-point, the x-y scan location in space is used to determine the spatial relationship between the sample and the acquired image. For a static sample, the sample coordinates have a unique and predictable mapping onto image space. However, during in vivo imaging, eye movements during a raster scan distort the relationship between the acquired image and the underlying sample structure. Even while fixating on a target and best attempts to suppress involuntary eye motion, the three classes of fixational eye movements - tremor, drift and micro-saccades – persist, and lead to a distorted and inaccurate rendering of the underlying retinal structure [4–6].
For AO-OCT volumes, eye motion parallel to the slow-scan and fast-scan dimensions lead to compression/expansion and shear in the 2D enface image respectively. Eye and head motion along the depth dimension leads to axial shear in the volumes. To correct these image artifacts and recover the underlying structure requires estimation and correction of eye motion using image registration techniques. Offline or post-hoc image registration, as well as real-time eye-tracking solutions have been proposed to overcome eye motion artifacts in OCT [7–11].
Stevenson and Roorda proposed a strip-based registration method for AOSLO images [12,13], based on earlier work by Mulligan [14]. In this method, each image frame in a retinal image video is divided into strips, where eye motion distortions between strips are treated as a rigid translation. Because of the lower likelihood of eye motion along the fast-scan, the strips are rectangular with their long axis parallel to the fast-scan. Using correlation methods implemented in spatial or Fourier domain, translational shifts between a reference and target strip is computed, and repeated across all the strips in a frame. The same is then repeated across different frames in the video. Unlike the AOSLO, AO-OCT provides a three-dimensional volumetric acquisition and two methods have been proposed to register such volumes. We will refer to the first as the segmentation-based approach where the volume is segmented at the layer of interest, say to reveal cone photoreceptors in an enface image. Then, similar methods as those of Stevenson and Roorda are applied to the 2D enface image stream [1,15]. The depth shifts are obtained from the layer segmentation. Second, 3D correlation based volume registration has been proposed [16,17]. Here, single fast B-scans or small groups of fast B-scans are correlated to a reference volume. The same assumption, that of a pure rigid translation between these small volume strips, is followed, but here in 3D. The advantage of the latter method is that it is free from the extra computational step of retinal layer segmentation.
For all the aforementioned registration methods, the key first step is to choose a reference image in case of AOSLO and a reference volume in case of AO-OCT. This reference serves as the “true” representation of the retinal structure and is assumed to be free of any intra-frame or intra-volume eye motion. Typically, the reference is selected by visually inspecting it for the absence of obvious distortions. Salmon et al. proposed an automated reference frame selection algorithm for AOSLO [18]. Intra-frame distortions in a reference image propagate as errors throughout the registration and result in an erroneous estimation of eye motion and its correction. Given the presence of eye motion in every frame or volume acquired with a scanning instrument, either manual or automated methods are still prone to errors, especially so when the acquisition speed is slow relative to the frequency of eye movements.
To correct reference frame distortions for AOSLO, Bedggood and Metha proposed a de-warping method by calculating the average shifts between the reference frame and all target frames [19]. This method is based on the stochastic symmetry of fixational eye movements, i.e. the eye position varies stochastically around a centroid point of fixation [20]. Calculating the mean of all shifts cancels the stochastic fixational eye movements around the centroid, leaving only a bias, if any, in the subject’s particular eye motion trajectory. Artifacts caused by intra-frame or intra-volume reference distortions appear as periodic artifacts in the raw eye motion traces, repeating at the acquisition frequency. Azimipour et al. used a similar method to correct intra-frame motion in the reference, and extended the application to segmentation-based registration of AO-OCT volumes [21].
Three-dimensional correlation based OCT volume registration algorithms do not compensate for intra-volume distortions arising during the acquisition within one volume (due to the scanning nature of the instrument), but rather compensate for lateral and axial shifts across different volumes, i.e. inter-volume distortions. Here, we applied the method proposed by Bedggood and Metha to compensate for intra-volume eye motion distortion using 3D correlation based registration of AO-OCT volumes. We show its performance to compensate for reference volume distortions using metrics derived from the registered images and analysis of eye motion amplitude spectrum and show how the correction performance varies with acquisition speed.
2. Methods
2.1. Experimental setup
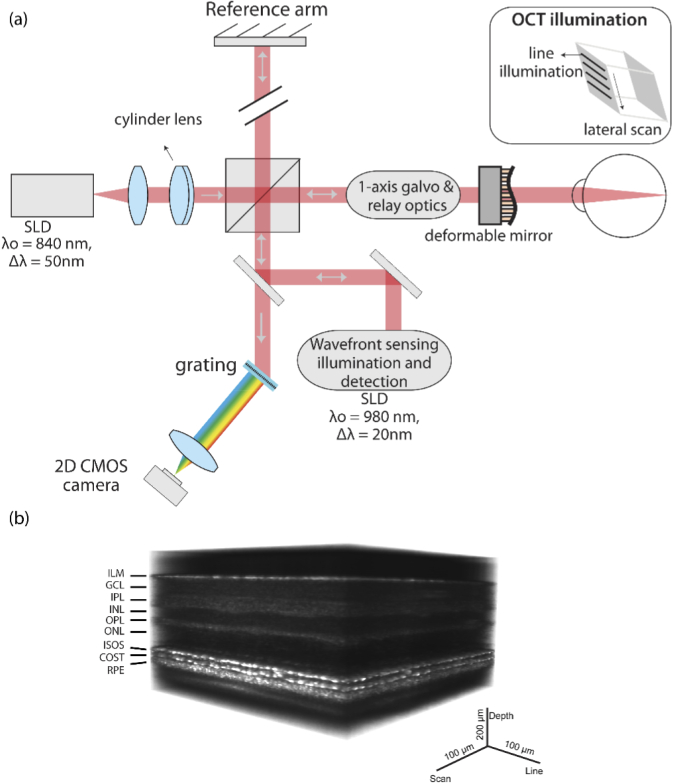
An AO line-scan spectral domain OCT was built in a free-space Michelson interferometer configuration as shown in Fig. 1(a) and described in detail previously [22,23]. A superluminescent diode (SLD) (λ0 = 840 nm, Δλ = 50 nm) was used as source for OCT imaging and an SLD (λ0=980 ± 10 nm) was used for wavefront sensing. A cylinder lens was used to generate a linear imaging field on the retina and the line was scanned using a single-axis galvo for volumetric acquisition. The backscattered light from the retina was dispersed using a transmissive grating and captured on a 2D CMOS camera, encoding space and depth (B-scan) along its two orthogonal dimensions. A wavefront sensor and deformable mirror was used to correct the optical aberration in the eye. The maximum B-scan rate of the system was 16200 B-scans/sec, limited by the frame rate of the camera. The volume rate varied between 10–162 volumes/sec. The Nyquist-limited lateral resolution was 2.4 µm and axial resolution was 7.6 µm in air. Figure 1(b) shows AO-OCT retinal volume at 3.5 deg temporal eccentricity, acquired at the rate of 17 volumes/sec.
Fig. 1.
(a) Block diagram of line scan AO-OCT (b) Retinal volume acquired with line scan AO-OCT marked with the corresponding layers. ILM- inner limiting membrane, GCL- ganglion cell layer, IPL- inner plexiform layer, INL- inner nuclear layer, OPL- outer plexiform layer, ONL-outer nuclear layer, ISOS- inner segment outer segment junction, COST- cone outer segment tips, RPE- retinal pigment epithelium. B-scans are acquired in parallel, representing the x (line) and z (depth) dimension. For volumetric acquisition, the linear illumination is scanned along the y (scan) dimension.
2.2. AO-OCT registration models
First, we present the model for AO-OCT registration. Let represents the reference volume and represents the target volume. The coordinates in the reference volume are , where and z represent the line dimension, scan dimension and depth dimension respectively in the AO-OCT volume. The AO-OCT instrument in this article followed a line-scan spectral domain operation [22,24,25]. Hence, the dimension ‘x’ represents the dimension along the linear illumination and is analogous to the fast-scan direction in point-scan AO-OCT and AOSLO.
The deformed coordinates in the target volume are . This deformation process is described as follows:
| (1) |
where and represent the operator that maps the coordinates of reference volume to the target volume. Therefore, the relationship between the reference and target volumes is:
| (2) |
This represents the general case of an affine transform between the target and reference. For the high-speed raster-scan ophthalmic imagers, the motion between the target volume and the reference volume is assumed typically consisting of only a translational shift [14,26,27]. The translational shift process is described as follows:
| (3) |
where and are the translational shift in line, scan and depth dimension respectively and the relationship between the reference and target volume can be reduced from Eq. (2) to Eq. (3).
2.3. AO-OCT registration methods
In this section, the two AO-OCT registration methods: 3D correlation based and segmentation-based are compared.
2.3.1. 3D correlation based registration
For computing the 3D correlation based registration, we follow methods similar to those proposed for AOSLO by Stevenson and Roorda, and for AO-OCT by Do [17]. Briefly, this involves first reducing the search space by progressing from a low resolution and large region-of-interest (ROI) to a finer, high resolution smaller ROI. In the coarse registration step, some samples in the target volume are selected across the scan dimension. Each sample consists of several consecutive fast B-scans. Then the phase correlation between the samples and reference volume is calculated as follows. Assuming, the Fourier transform of reference volume is and the Fourier transform of target volume is . The cross-power spectrum of the reference volume and target volume in Fourier domain is:
| (4) |
where is Hadamard product. is the complex conjugate of . Then we obtain a Dirac delta function by applying inverse Fourier transform (IFT):
| (5) |
To obtain the translational shifts by determining the peak:
| (6) |
This method of computing translational shifts using the Fourier-shift theorem is also generally referred to as the phase-correlation. In the phase correlation computation, the reference volume and target volume must have the same size. In the coarse registration step, the samples need to be zero-padded to the size of the reference volume before calculating phase correlation. The phase correlation provides the coarse shifts between the samples and reference volume. Coarse shifts for every fast B-scan are obtained by interpolating the sparse coarse shifts. In the fine registration step, every fast B-scan in the target volume is registered to the reference volume by using the coarse scan shifts of every fast B-scan to predict the scan range of the corresponding sub-volume in the reference volume. If is the window size, the scan range of sub-volume in the reference volume is . The fine shifts are obtained by calculating the phase correlation between each fast B-scan and its corresponding sub-volume in the same way as the coarse registration step. Again, in the fine registration, each fast B-scan is zero-padded to have the same size as its corresponding sub-volume. For each correlation matrix, the maximum value was used to obtain the shift estimate. In the fine registration step, fast B-scans that have low phase correlation with the reference volumes were discarded, since the fine shifts calculated from such scans tend to be erroneous. The mean of correlations across all B-scan was empirically treated as the threshold below which correlations and the resultant shifts were tagged as erroneous. These erroneous shifts were removed and replaced by an interpolation of shift estimates within a small neighborhood of the low correlation scans.
2.3.2. Segmentation-based registration
Segmentation-based AO-OCT registration method consists of two main steps: depth and lateral registration. First, in order to obtain features of interest, such as cone photoreceptors in the inner-outer segment junction (ISOS) and cone outer segment tips (COST) retinal layers, the volume series needs to be segmented. The segmented layer is projected along the depth dimension to get an enface image. Applying the 2D strip-based registration methods of Stevenson and Roorda provides the line and scan shifts between the reference volume and target volumes. The segmentation step provides the axial shifts for each volume and the difference between the depth of the same layer in reference volume and target volumes is used as the axial translation shifts to register the volumes.
2.3.3. Comparisons
Here we compare the translational shifts obtained between these two AO-OCT registration methods. Figure 2 shows the eye motion shifts estimated using the 3D correlation based and segmentation-based registration methods. In the latter, the results of the segmentation were manually verified for accuracy. There is a high degree of similarity between the shifts estimated along the three dimensions. The correlation between the two methods for horizontal, vertical and axial dimensions are high and equal to 0.99. The standard deviation of the difference in shifts obtained from segmentation based and 3D correlation based registration, were 0.37, 0.25 and 0.67 arc-min in horizontal, vertical and axial dimensions respectively. Given that the segmentation-based registration is the standard protocol for AO-OCT, it is helpful here to validate its similarity with the 3D correlation based registration method that we will refine further in this current work.
Fig. 2.
Comparison between the shifts from segmentation-based and 3D correlation based registration in AO-OCT. (a) line dimension (b) scan dimension (c) depth dimension. The black arrow in (a) and (b) indicate microsaccades.
2.4. AO-OCT intra-volume motion correction
First, we will present the AO-OCT intra-volume motion correction method. Then, we introduce the metrics to measure the motion distortion in the reference volume and evaluate the correction performance.
2.4.1. Correction method
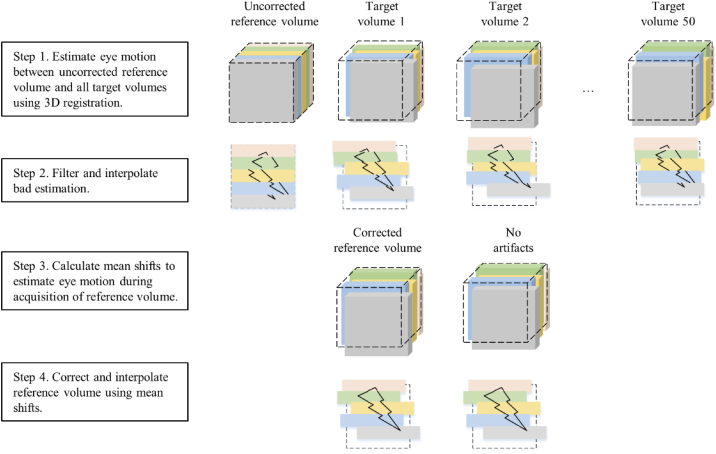
We extended the methods of Bedggood and Metha to compensate for reference volume correction by using 3D correlation based registration. Let the AO-OCT volume dataset have n volumes, and i represents the volume index, . Choose volume in as the volume to be corrected. The number of fast B-scan in is m, and j represents the scan index, . The main steps to correct intra-volume motion of are summarized as follows and depicted in Fig. 3:
-
1)
Select samples in the target volume across the scan dimension, then calculate the coarse shifts between the samples and volume using phase correlation.
-
2)
Interpolate the samples coarse shifts to obtain the coarse shifts for every fast B-scan.
-
3)
Use the interpolated coarse shifts to find the appropriate scan range in volume for each fast B-scan. The fast B-scans in the scan range are then selected to form the corresponding sub-volume.
-
4)
Calculate the fine shifts between every fast B-scan and its corresponding sub-volume using phase correlation.
-
5)
Remove the erroneous shifts with low correlation in the fine registration and replace by interpolating the fine shifts in the immediate neighborhood to obtain the final fine shifts .
-
6)
Repeat step 1) to step 5) for every volume in except . Then we have all fine shifts between and other volumes in , where , , .
-
7)
Average all the fine shifts in axial dimension, line dimension and scan dimension. These average shifts are the resultant eye motion estimation in .
-
8)
Use to shift every fast B-scan in volume .
-
9)
Correct all the fine shifts by the average shift in volume Vk. These corrected fine shifts can be used to generate new registered volumes which are free from reference intra-volume distortion.
Fig. 3.
The steps for reference volume correction using 3D correlation based registration. The flowchart is further elaborated in steps 1-9 above.
A flowchart of the AO-OCT intra-volume motion correction method is shown in Fig. 3.
2.5. Methods for performance evaluation
2.5.1. Data acquisition
We acquired AO-OCT volumes from two healthy human subjects using the line scan spectral domain AO-OCT. Each AO-OCT dataset included 40-162 volumes, and each volume included 100 - 350 fast B-scans of size 512384 pixels each. The sampling frequency of the fast B-scan ranged between 3000–16200 Hz and volume rate was in the range 10 -162 Hz. The field of view (FOV) was 1 deg. The specific parameters are mentioned in the description of the results section.
2.5.2. Two-dimensional (2D) and 3D correlation
From a time-series volumetric data, one volume was randomly selected as a reference and 3D correlation based registration was performed based on that reference volume. The x-y-z shifts obtained from the phase correlation were used to translate the volumes with respect to the reference. The shifted volumes were averaged to yield a motion-corrected volume for further evaluation. The same procedure was then repeated for a second randomly selected reference volume. The registered and averaged volumes from the two randomly selected references were cross correlated in three-dimensional space using the 3D normalized cross correlation before and after intra-volume correction. The maximum correlation value was used to evaluate the performance of intra-volume correction. In addition, the registered and averaged volumes with both references, with and without intra-volume motion correction, were segmented for cone outer segment tips (COST). The maximum intensity projections of 3-5 pixels centered at COST were used to visualize the enface image of cone photoreceptors. The enface images are also used to evaluate the performance of 3D correlation based registration, with and without intra-volume correction, using 2D normalized cross-correlation. Since these randomly selected references will be affected by different intra-volume distortions, the resultant registered volumes will be similarly affected as well. Hence, the correlation between the resultant registered volumes prior to intra-volume correction will be low. Once the intra-volume distortions have been effectively corrected, both cases will encode the retinal structure effectively and similarly, leading to a high correlation.
2.5.3. Amplitude spectrum of eye motion
The amplitude spectrum of fixational eye motion has been used to analyze its frequency dependence [28–30]. Artifacts or features of the eye motion trace that repeat itself in every acquisition are manifested in the amplitude spectrum as ‘peaks’ at the harmonics of the acquisition rate, i.e. 10, 20, 30 Hz and so on, for an acquisition rate of 10 Hz. These periodic artifacts may arise due to torsion of the eye, inaccurate estimation of eye motion at the edge of a frame/volume or intra-volume/frame distortions in the reference. Here, we analyze the amplitude spectrum of the eye motion in line, scan and depth dimensions as a measure of the extent by which periodic distortions, such as those contributed due to the intra-volume motion in the reference AO-OCT volume, affect eye motion estimation.
The steps to calculate the amplitudes spectrum are as follows:
-
1)
Use the eye motion trace, i.e. the fine shifts to calculate the amplitude spectrum in each dimension.
-
2)
Use the intra-volume correction method above to obtain the corrected eye motion trace or fine shifts
-
3)
Calculate the amplitude spectrum for the corrected shifts in step 2.
-
4)
Compare the peaks at volume rate and subsequent harmonics in the eye motion amplitude spectrum.
The peaks at the volume rate and subsequent harmonics in the eye motion amplitude spectrum are expected to decrease after the intra-volume motion correction for the reference volume. The amplitude spectrum is plotted for the same randomly selected reference volumes as described in the 2D and 3D correlation section above in Fig. 6 and Fig. 7.
Fig. 6.
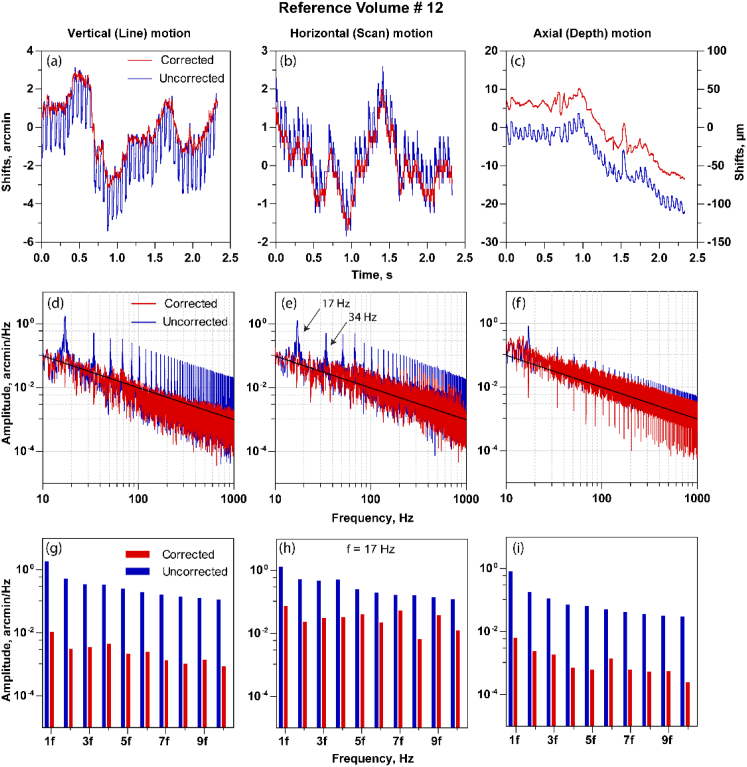
The estimated shifts with the uncorrected and corrected reference volume in line (a), scan (b) and the depth (c). Note the distortions are periodic in the shifts estimate for the uncorrected case and are reduced once corrected. (d)-(f) The amplitude spectrum of shift estimate shown in (a), (b) and (c) respectively. The volume distortions are shown as peaks in the amplitude spectrum at the integer multiples of volume rate. The intra-volume correction reduces these peaks in the amplitude spectrum summarized in (g), (h) and (i) where the peak amplitudes at the multiples of volume rate for corrected and uncorrected reference volumes are shown.
Fig. 7.
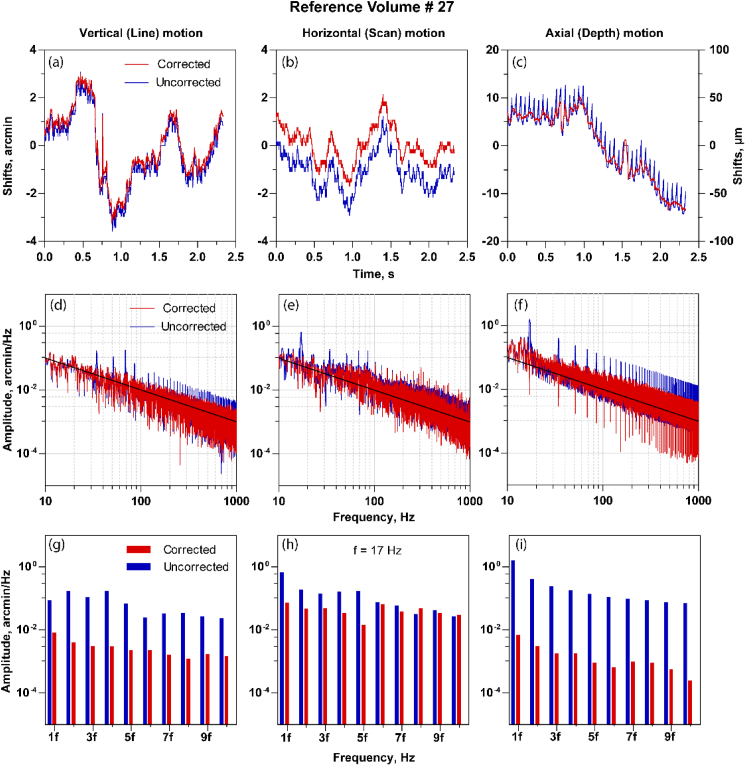
A similar figure as shown in Fig. 6, but for a different reference volume where artifacts in the depth direction are more dominant. This is similar to the higher distortion in the depth dimension, as visually seen in Fig. 4(b) compared to the lateral dimension in Fig. 5(b).
2.5.4. Variation with speed
To further explore the performance of intra-volume correction at different speeds, 2D and 3D correlation analysis and eye motion amplitude spectrum analysis were evaluated for increasing volume rates ranging from 10 Hz to 162 Hz. At each speed, one volume time series was analyzed. We used 50, 40, 100 and 162 number of volumes at 10, 17, 140 and 162 Hz respectively for 3D volume registration. In each time series, five different volumes were randomly selected as reference for 3D registration. Three-dimensional registration was performed for each reference volume with and without intra-volume motion correction. The registered volumes were averaged, and the eye motion traces were obtained to evaluate the performance via the three methods above: 3D correlation, 2D correlation and amplitude spectrum analysis. For 3D and 2D correlation, in each five sets of registered and averaged volumes, two volumes were selected for cross correlation. In all, there are a combination of 5C2 possibilities, leading to a total of 10 cross correlation matrices. The mean and standard deviation of the ten 2D and 3D maximum correlation values were calculated. The amplitude spectrum of eye motion was calculated for each reference volume chosen for registration and the peak amplitude at the volume rate and its multiple harmonics were compared across different speeds.
3. Results
In this section, experimental data is used to evaluate the proposed intra-volume motion correction method. The metrics introduced in Section 2.5 are used to evaluate the correction performance.
3.1. 3D and 2D correlation analysis with two arbitrarily chosen reference volumes
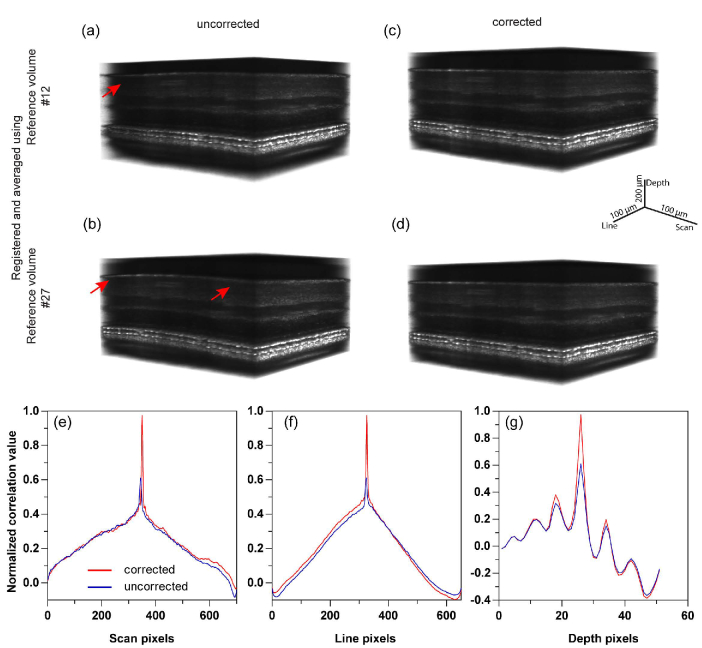
For this analysis, AO-OCT volumes were recorded for 2.5 seconds at 6000 B-scans/sec at 3.5 deg eccentricity. Each volume had 350 fast B-scans, and the volume rate was 17 Hz. Figures 4(a) and 4(b) shows the 3D registered and averaged volumes with volume number 12 and 27 respectively as a reference volume for registration. Here, the reference volumes are not corrected for distortions, and the resulting distortions in the registered and averaged volumes are visible as shown by red arrows in Figs. 4(a) and 4(b). Note the curved profile across all the layers of the volume in Fig. 4(b), denoting the larger distortion between the two. Figures 4(c) and 4(d) show the 3D registered and averaged volumes after intra-volume motion correction of the reference volumes #12 and #27 respectively. Note the improved and undistorted visualization of the layers after intra-volume reference distortions are corrected. The effect of intra-volume correction in 3D correlation based registration was quantified by 3D normalized cross correlation in Figs. 4(e)–4(g). After correction, an improvement by a factor of 1.6x was noted in the 3D cross-correlation peak, reaching a near-perfect correlation of 1.0.
Fig. 4.
Intra-volume motion correction. 3D correlation based registration without intra-volume correction is shown in (a) and (b) for two arbitrarily selected reference volumes. 40 volumes are registered and averaged. 3D registered and averaged volumes with intra-volume correction of same reference volumes used in (a) and (b) are shown in (c) and (d). Intra-volume correction reduces the distortion and improves the visualization of the layers as seen in (c) and (d). 3D normalized cross correlation performed between (a) and (b), i.e. uncorrected, and for (c) and (d), i.e. corrected, are shown in (e)-(g). As expected, the registered and averaged volumes show high correlations once the intra-volume distortions are corrected.
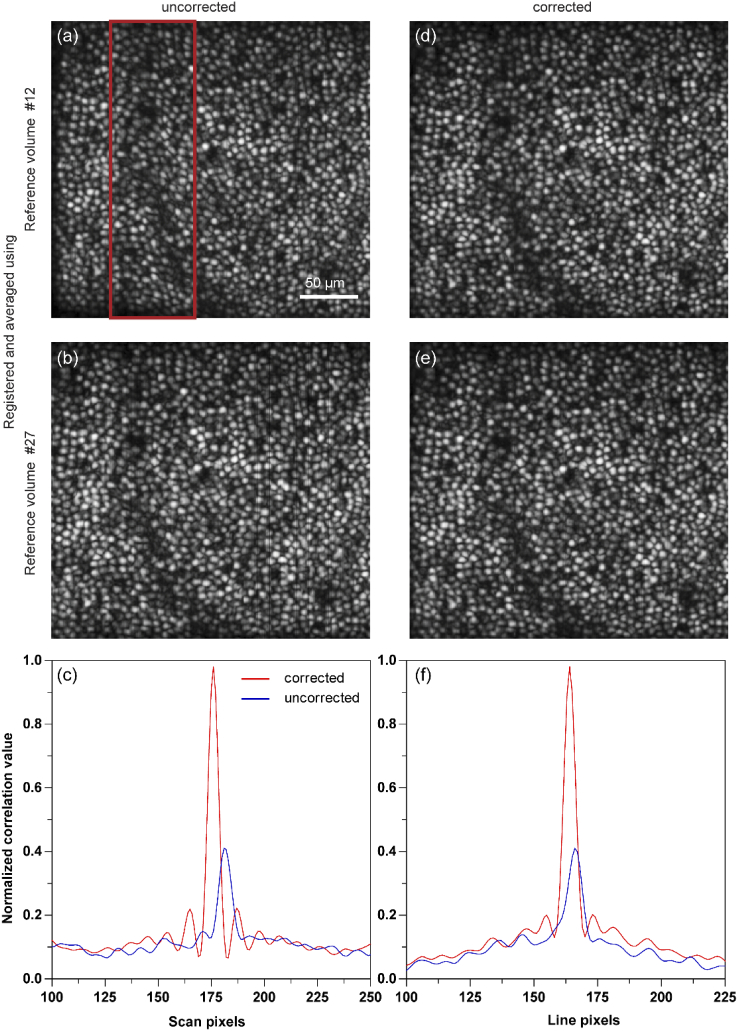
The maximum intensity projection at COST layer for the volumes in Figs. 4(a)–4(d) is shown in Figs. 5(a)–5(b) and Figs. 5(d)–5(e) respectively. The registered volume shown in Fig. 4(a) has less distortion in depth dimension compared to Fig. 4(b). However, the distortion in the x-y spatial dimension is higher and more clearly visible in the corresponding enface images in Fig. 5(a), compared to in Fig. 5(b) (red rectangle). Hence, the intra-volume distortions due to eye motion may manifest along any one dimension or combination in the 3D volume space. Figures 5(d) and 5(e) show the enface images obtained from registered and averaged volumes after correction. Here, the distortion is not visually significant in any of the three dimensions (Figs. 4(c)–4(d) and Figs. 5(d)–5(e)). To quantify this, we calculated the 2D normalized cross correlation between Figs. 5(a) and 5(b) (uncorrected reference volumes) and Figs. 5(d) and 5(e) (corrected reference volumes). The maximum of the 2D cross correlation improved by a factor of 2.4x after intra-volume distortion correction, reaching a near-perfect correlation of 1.0.
Fig. 5.
Maximum intensity projection at cone outer segment tips (COST) without (a,b) and with (d,e) intra-volume motion correction are shown. These correspond to the same volumes as in Fig. 4. The 2D normalized cross correlation across the line (c) and scan (f) dimensions show a low correlation value compared to a corrected reference volume.
3.2. Eye motion amplitude spectrum
Figures 6(a)–6(c) show the fine shifts before and after intra-volume correction in the line, scan and axial dimension respectively and Figs. 6(d)–6(f) show the comparison of the corresponding amplitude spectrum. The shifts are estimated with volume # 12 as the reference. The shifts demonstrate a periodic increase in magnitude at the volume rate, which would be expected from an eye motion estimate that has artifacts that occur once per acquisition. These artifacts are seen as peaks in the amplitude spectrum at the volume rate and its subsequent harmonics. The black lines in the amplitude spectrum plot represent the 1/f relationship between amplitude and frequency. This relationship is consistent with a decreasing amplitude proportional to the inverse of the frequency [28,29]. The periodic artifacts are reduced after intra-volume motion correction, observable in Figs. 6(a)–6(c) (red curves) and in the reduced peak amplitudes in Figs. 6(d)–6(f) at the volume rate and its subsequent harmonics. The peak amplitudes at the volume rate and its subsequent harmonics with and without intra-volume correction in line, scan and axial dimension are summarized in Figs. 6(g)–6(i). The reduction is clearly visible in all three dimensions. These computations are repeated for a second reference volume #27. In this case, the periodic artifacts are dominant in the depth shifts (Fig. 7(c)), and further evident in the amplitude spectrum as shown in Figs. 7(f) and 7(i). These two examples here with different reference volume selections also indicate how distortions can manifest in any one particular spatial dimension, either line, scan or depth. For instance, in Fig. 4(b), the curved profile of the retinal layers denotes a distortion in depth, while the same is not observable in the lateral (line or scan) dimensions in the enface image (Fig. 5(b)), once the volume was segmented.
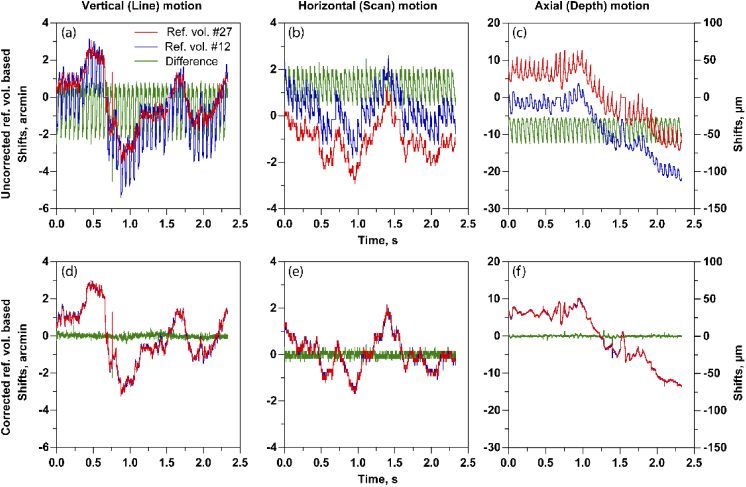
Further, we calculated the differences between the eye motion traces based on reference volume #12 and #27 before and after intra-volume correction in all three dimensions (Figs. 8(a)–8(f)). Eye motion traces based on two different reference volumes were very different due to the intra-volume distortion before correction. However, after correction, these traces appear similar, as expected. The standard deviation of difference in eye motion traces based on corrected ref. vol #12 and ref. vol #27 were 0.11, 0.10, and 0.22 arc-min compared to the uncorrected reference volume case equal to 0.98, 0.47 and 2.2 arc-min (vertical, horizontal, and axial). Note that without further analysis on the eye motion traces, it is not possible to attribute the periodic artifacts completely to reference volume distortions, since the other two factors – torsion and erroneous shifts at the edges of the frame/volume - mentioned above also contribute.
Fig. 8.
Eye motion traces based on reference volume #27 and reference volume #12 and their differences, before reference volume correction in line (a), scan (b) and axial dimension (c) and after reference volume correction in line (d), scan (e) and axial (f) dimensions.
3.3. Reference volume distortion versus acquisition speed
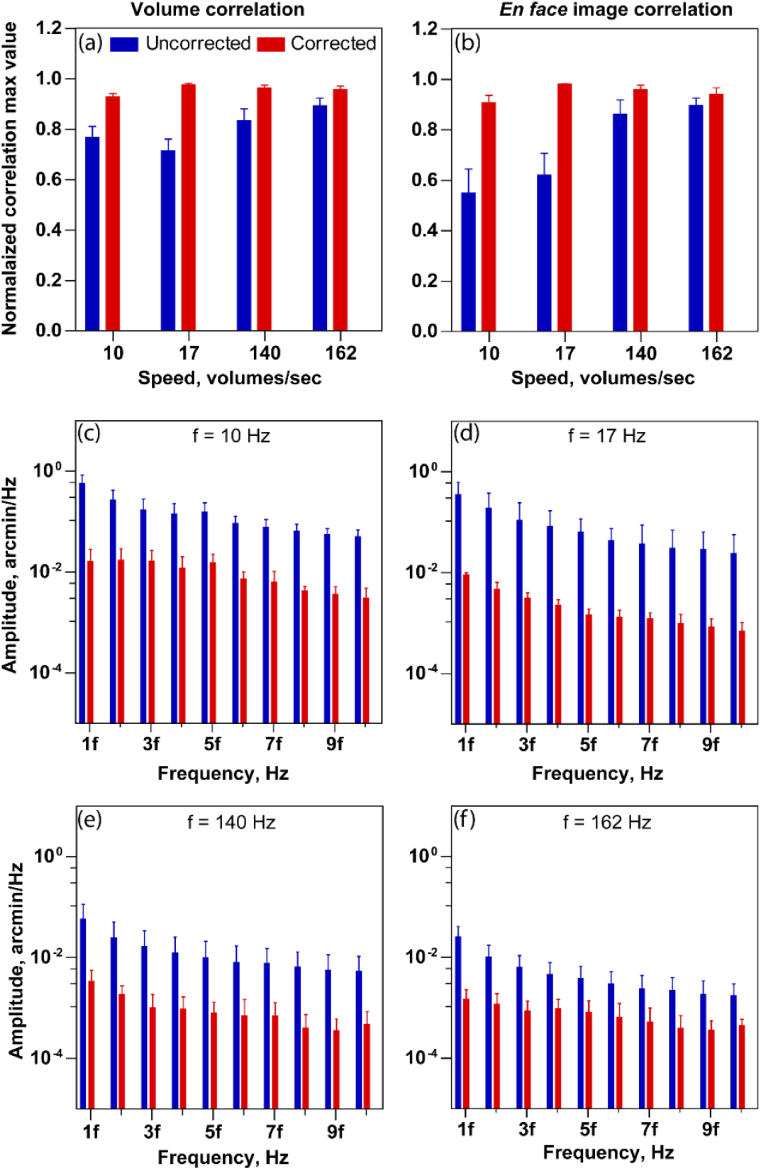
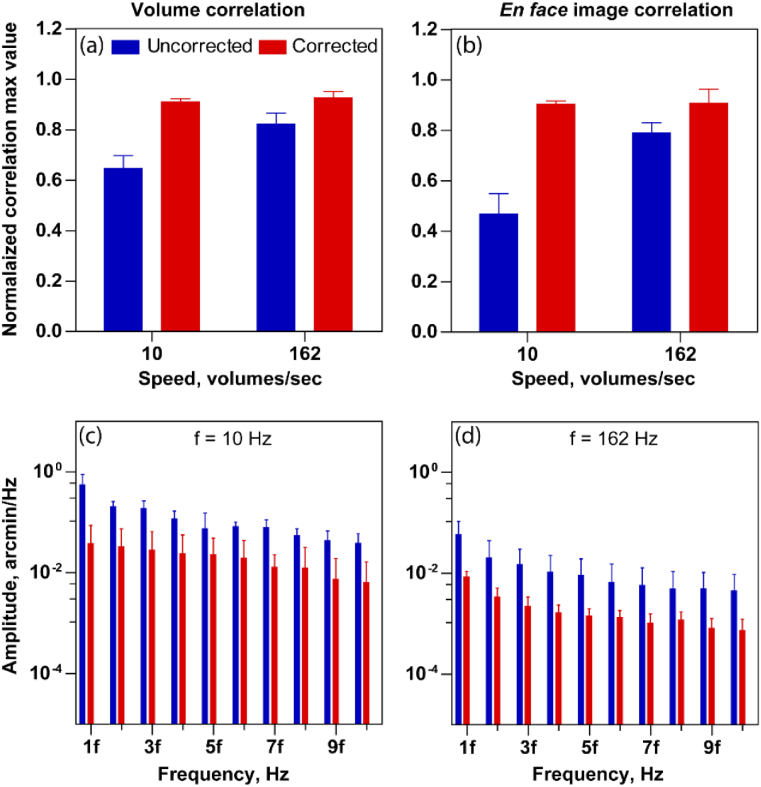
We sought to estimate the effect of intra-volume correction with increasing volume acquisition rate. For this, we choose four different volume rates - 10 Hz, 17 Hz, 140 Hz, 162 Hz for subject 1 and 10 Hz, 162 Hz for subject 2. The mean ± standard deviation of maximum correlation values is calculated and plotted in Fig. 9(a) for subject 1 and Fig. 10(a) for subject 2, for each speed. Since we expect a lower distortion at higher volume rates, the uncorrected reference volumes at higher speeds show a higher mean correlation compared to lower speeds. Along the same lines, the improvement in correlation after correction at higher speeds is smaller, compared to the improvement at the lower speeds. The opposite is true for the slowest acquisition, i.e. the mean maximum correlation is low and improves substantially upon intra-volume distortion correction. Note that the maximum mean correlation values after correction are nearly the same across all speeds. However, at the slowest speed of 10 Hz, the maximum correlation is smallest and significantly less than 1.0, even after correction. The same trend holds when this analysis is conducted using 2D normalized cross correlations on the enface photoreceptor images (Fig. 9(b) (subject 1) and Fig. 10(b) (subject 2)).
Fig. 9.
Performance evaluation of reference volume correction for subject 1 at volume rate 10 Hz, 17 Hz, 140 Hz and 162 Hz. 3D normalized cross-correlation peak (a) and 2D normalized cross-correlation peak (b) between the randomly selected reference volumes for 3D correlation based registration at different volume rates. Note in (b), only the enface photoreceptor images are used for cross correlation. (c)–(f) shows the amplitude spectrum peak amplitude at the multiple of volume rate at different speeds, for the line dimension. Five randomly selected reference volumes were used in all cases at speeds of 10, 17, 140 and 162 volumes/sec. The error bars indicate the standard deviation of maximum cross correlation value obtained by the combination of all five reference volumes.
Fig. 10.
Performance evaluation of reference volume correction for subject 2 at volume rate 10 Hz and 162 Hz. 3D normalized cross-correlation peak (a) and 2D normalized cross-correlation peak (b) between the randomly selected reference volumes for 3D correlation based registration at two different volume rates. (c)–(d) shows the amplitude spectrum peak amplitude at the multiple of volume rate at two speeds (10 Hz and 162 Hz), for the line dimension. The error bars indicate the standard deviation of maximum cross correlation value obtained by the combination of all five reference volumes.
The distortion correction is also evident in the reduction of the peak amplitude of amplitude spectrum at the volume rate and its harmonics with different speed as shown in Figs. 9(c)–9(f) for subject 1 and Figs. 10(c)–10(d) for subject 2. The mean ± standard deviation plotted in Figs. 9(c)–9(f) and Figs. 10(c)–10(d) were obtained by arbitrarily selecting five different reference volumes for computing amplitude spectrum. For simplicity, the peak amplitudes are plotted only in the line dimension. The maximum peak value for uncorrected reference volumes decreases with increasing speed, i.e. the periodic artifacts in the eye motion traces reduce with increasing acquisition speeds.
4. Discussion and conclusions
In this paper, we introduce reference volume distortion correction for AO-OCT using 3D correlation based registration and demonstrate an improvement in registration performance via a few metrics. Further, we quantified how these distortions, and periodic artifacts in the eye motion traces in general vary with acquisition speed.
A comparison between the standard segmentation-based method for OCT registration and the 3D correlation based registration methods of Do [17] showed a high degree of similarity. Since the segmentation-based method needs an extra computational step that of retinal layer segmentation, the accuracy of this step will affect the registration performance. Two advantages of 3D correlation based registration are important to note. First, for high-speed AO-OCT, the signal to noise ratio of the volume is low at high sampling frequency and makes segmentation challenging. Second and more importantly, in outer retinal diseases where the structural integrity of the retinal layers is affected, accurate segmentation can be challenging. In the extreme case, say where the RPE detaches from the retina in central serous retinopathy, relying on the standard COST segmentation will lead to artifacts in the registered result, unless advanced segmentation algorithms are applied [30,31]. Similar errors can be expected in a healthy retina, where the OS length changes rapidly in the foveal slope or due to structural changes near the optic nerve head. Three-dimensional registration methods on the other hand are free from this step and may be more suitable for retinal disease, for high-speed imaging and to reveal retinal structures that have lower retinal backscattered signals such as the retinal ganglion cells [16,32].
The general paradigm of correcting reference distortions was inspired by Bedggood and Metha [19], modified here to incorporate 3D correlation based registration as opposed to the 2D variant for AOSLO proposed earlier. Adding the extra dimension was key, as shown in Figs. 4(a) and 4(b), where shifts in the axial direction in the chosen reference volume introduced distortions in the visualization of the retinal layers. Axial motion artifacts caused due to head movements, eye movements and heartbeat were carefully detailed previously by simultaneous OCT and heart rate measurements [33]. Few observations are worth noting. First, frequency analysis revealed a high degree of correlation between axial shifts (peak-to-peak amplitude ∼ 81 µm ± 3.5 µm) measured with OCT and heart rate, indicating that the periodic axial shifts measured in OCT are attributed to heartbeat-induced eye motion. The first and second harmonics at 1 Hz and 0.2 Hz correspond to typical heartbeat and breathing rates respectively. Second, when subjects were instructed to rotate their fixation over an 8° range, no effect on axial shifts were observed due to the lateral eye movements. Lastly, the relative effect of head versus eye movements on axial motion was evaluated by measuring OCT axial shifts for subjects in a chin rest and when they were lying down. When lying down, the amplitude of axial shift was greatly reduced, and so were the periodic artifacts caused due to heartbeat. This led to the conclusion that under routine OCT imaging with a chin rest, axial eye motion is mainly attributed to head movements and correlated with heartbeat, and that such axial shifts are not caused by movements of the eyeball within the socket or the motion of the cornea and retina relative to each other.
Upon correcting the distortions in 3D, visualization of retinal structure along both the lateral dimension (Figs. 5(a) and 5(d)) and the axial dimensions (Figs. 4(b) and 4(d)) improved, quantified by an increase in the 2D and 3D cross-correlations. In addition, the periodic artifacts in the eye motion trace along the depth dimension in Fig. 7 further suggests the importance of correcting reference volume distortions in AO-OCT using 3D correlation based registration. Note that the choice of the reference is the key determinant for minimizing the impact of intra-volume distortions. To this end, automatic reference frame selection algorithms have been proposed [18]. Alternatively, creating a higher fidelity reference frame or volume may be considered by averaging a few uncorrupted acquisitions with minimal intra-frame or intra-volume distortion [28].
We used the amplitude spectrum of the eye motion traces as a metric to quantify the periodic artifacts associated with torsion and reference volume distortions. However, their contributions were not segregated here. Removing torsion prior to the reference distortions is an important future step for further refinement of the eye motion traces and segregating contributions from different sources. Torsion manifests as a sawtooth artifact in the eye motion trace at the frequency of acquisition, and its amplitude may change during the course of the video recording. Reference volume distortions on the other hand remain constant, depending on the choice of the reference and could manifest as periodic artifacts along any one or more spatial dimensions. These periodic artifacts however do not affect the amplitude spectrum at other harmonics besides the acquisition frequency and its integer multiples. Therefore, such frequency analysis can be readily used to characterize and differentiate the properties of microsaccades, drift or tremor [34]. The small 1 deg. imaging field of view of typical AO cameras, along with the AO-OCT used here, restrict the maximum lateral shift correctable to ∼0.5 deg., a magnitude sufficient to correct for the majority of microsaccades [35].
The shorter exposure time at the speed of 162 Hz reduced the SNR by 2.5 dB compared to 10 Hz. However, cone structure at both speeds is resolved and visualized similarly. Since correlation analysis in the Fourier domain depends on the spatial frequency content, lower SNR is not likely to substantially affect the correlation value for volumes acquired at both speeds. With increasing acquisition speed, we observed that reference volume distortions (as quantified by 2D and 3D correlation) and the periodic artifacts were greatly reduced in the uncorrected volumes. This is along the lines of the observations made in a line-scan ophthalmoscope by Lu et al. [36]. As a result, the reference volume correction provided the least benefit at higher speed and vice-versa. However, at speeds even as high as 162 Hz, the correlation for the uncorrected volumes could still further be improved upon intra-volume correction, indicating the presence of a small, but significant distortion. Overall, the variation of the distortion and correction performance together highlight the importance of higher acquisition speeds for eye motion estimation and registration.
In conclusion, the 3D correlation based registration with intra-volume correction for AO-OCT summarized here provides significant performance improvements for estimating eye motion and visualizing the underlying retinal structure. It complements prior work on 2D en face images by extending the application to 3D volumes. Further, the variation of the performance metrics with acquisition speed shall allow future optimization into eye-tracking algorithms developed for offline and real-time retinal stabilization.
Acknowledgments
We thank Austin Roorda for helpful discussions.
Funding
Burroughs Wellcome Fund10.13039/100000861 (Careers at the Scientific Interfaces Award); M.J. Murdock Charitable Trust10.13039/100000937; Foundation Fighting Blindness10.13039/100001116; Research to Prevent Blindness10.13039/100001818 (Career Development Award, Unrestricted Grant to UW Ophthalmology); National Eye Institute10.13039/100000053 (U01EY025501, EY027941, EY029710, P30EY001730); National Natural Science Foundation of China10.13039/501100001809 (11573066, 61675205, 61505215).
Disclosures
VPP and RS have a commercial interest in a US patent describing the technology for the line-scan OCT for optoretinography.
References
- 1.Zawadzki R. J., Jones S. M., Olivier S. S., Zhao M., Bower B. A., Izatt J. A., Choi S., Laut S., Werner J. S., “Adaptive-optics optical coherence tomography for high-resolution and high-speed 3D retinal in vivo imaging,” Opt. Express 13(21), 8532–8546 (2005). 10.1364/OPEX.13.008532 [DOI] [PMC free article] [PubMed] [Google Scholar]
- 2.Zhang Y., Rha J., Jonnal R. S., Miller D. T., “Adaptive optics parallel spectral domain optical coherence tomography for imaging the living retina,” Opt. Express 13(12), 4792–4811 (2005). 10.1364/OPEX.13.004792 [DOI] [PubMed] [Google Scholar]
- 3.Roorda A., Romero-Borja F., Donnelly Iii W., Queener H., Hebert T., Campbell M., “Adaptive optics scanning laser ophthalmoscopy,” Opt. Express 10(9), 405–412 (2002). 10.1364/OE.10.000405 [DOI] [PubMed] [Google Scholar]
- 4.Riggs L. A., Armington J. C., Ratliff F., “Motions of the retinal image during fixation,” J. Opt. Soc. Am. 44(4), 315–321 (1954). 10.1364/JOSA.44.000315 [DOI] [PubMed] [Google Scholar]
- 5.Ditchburn R. W., Ginsborg B. L., “Involuntary eye movements during fixation,” J. Physiol. 119(1), 1–17 (1953). 10.1113/jphysiol.1953.sp004824 [DOI] [PMC free article] [PubMed] [Google Scholar]
- 6.Martinez-Conde S., Macknik S. L., Hubel D. H., “The role of fixational eye movements in visual perception,” Nat. Rev. Neurosci. 5(3), 229–240 (2004). 10.1038/nrn1348 [DOI] [PubMed] [Google Scholar]
- 7.Zang P., Liu G., Zhang M., Dongye C., Wang J., Pechauer A. D., Hwang T. S., Wilson D. J., Huang D., Li D., “Automated motion correction using parallel-strip registration for wide-field en face OCT angiogram,” Biomed. Opt. Express 7(7), 2823–2836 (2016). 10.1364/BOE.7.002823 [DOI] [PMC free article] [PubMed] [Google Scholar]
- 8.Capps A. G., Zawadzki R. J., Yang Q., Arathorn D. W., Vogel C. R., Hamann B., Werner J. S., “Correction of eye-motion artifacts in AO-OCT data sets,” in Ophthalmic Technologies XXI, (International Society for Optics and Photonics, 2011), 78850D. [Google Scholar]
- 9.Chen Y., Hong Y.-J., Makita S., Yasuno Y., “Three-dimensional eye motion correction by Lissajous scan optical coherence tomography,” Biomed. Opt. Express 8(3), 1783–1802 (2017). 10.1364/BOE.8.001783 [DOI] [PMC free article] [PubMed] [Google Scholar]
- 10.Vienola K. V., Braaf B., Sheehy C. K., Yang Q., Tiruveedhula P., Arathorn D. W., de Boer J. F., Roorda A., “Real-time eye motion compensation for OCT imaging with tracking SLO,” Biomed. Opt. Express 3(11), 2950–2963 (2012). 10.1364/BOE.3.002950 [DOI] [PMC free article] [PubMed] [Google Scholar]
- 11.Ricco S., Chen M., Ishikawa H., Wollstein G., Schuman J., “Correcting motion artifacts in retinal spectral domain optical coherence tomography via image registration,” in International Conference on Medical Image Computing and Computer-Assisted Intervention, (Springer, 2009), 100–107. [DOI] [PMC free article] [PubMed] [Google Scholar]
- 12.Stevenson S. B., Roorda A., “Correcting for miniature eye movements in high-resolution scanning laser ophthalmoscopy,” in Ophthalmic Technologies XV, (International Society for Optics and Photonics, 2005), 145–151. [Google Scholar]
- 13.Stevenson S. B., “Eye movement recording and retinal image stabilization with high magnification retinal imaging,” J. Vis. 6(13), 39 (2010). 10.1167/6.13.39 [DOI] [Google Scholar]
- 14.Mulligan J., “Recovery of motion parameters from distortions in scanned images,” in NASA Conference Publication, (NASA, 1998), 281–292. [Google Scholar]
- 15.Jonnal R. S., Kocaoglu O. P., Wang Q., Lee S., Miller D. T., “Phase-sensitive imaging of the outer retina using optical coherence tomography and adaptive optics,” Biomed. Opt. Express 3(1), 104–124 (2012). 10.1364/BOE.3.000104 [DOI] [PMC free article] [PubMed] [Google Scholar]
- 16.Liu Z., Kurokawa K., Zhang F., Lee J. J., Miller D. T., “Imaging and quantifying ganglion cells and other transparent neurons in the living human retina,” Proc. Natl. Acad. Sci. 114(48), 12803–12808 (2017). 10.1073/pnas.1711734114 [DOI] [PMC free article] [PubMed] [Google Scholar]
- 17.Do N. H., “Parallel processing for adaptive optics optical coherence tomography (AO-OCT) image registration using GPU,” M.S. Thesis (Department of Electrical and Computer Engg, Purdue University, 2016)
- 18.Salmon A. E., Cooper R. F., Langlo C. S., Baghaie A., Dubra A., Carroll J., “An Automated Reference Frame Selection (ARFS) Algorithm for Cone Imaging with Adaptive Optics Scanning Light Ophthalmoscopy,” Trans. Vis. Sci. Technol. 6(2), 9 (2017). 10.1167/tvst.6.2.9 [DOI] [PMC free article] [PubMed] [Google Scholar]
- 19.Bedggood P., Metha A., “De-warping of images and improved eye tracking for the scanning laser ophthalmoscope,” PLoS One 12(4), e0174617 (2017). 10.1371/journal.pone.0174617 [DOI] [PMC free article] [PubMed] [Google Scholar]
- 20.Vogel C. R., Arathorn D. W., Roorda A., Parker A., “Retinal motion estimation in adaptive optics scanning laser ophthalmoscopy,” Opt. Express 14(2), 487–497 (2006). 10.1364/OPEX.14.000487 [DOI] [PubMed] [Google Scholar]
- 21.Azimipour M., Zawadzki R. J., Gorczynska I., Migacz J., Werner J. S., Jonnal R. S., “Intraframe motion correction for raster-scanned adaptive optics images using strip-based cross-correlation lag biases,” PLoS One 13(10), e0206052 (2018). 10.1371/journal.pone.0206052 [DOI] [PMC free article] [PubMed] [Google Scholar]
- 22.Pandiyan V. P., Jiang X., Maloney-Bertelli A., Kuchenbecker J. A., Sharma U., Sabesan R., “High-speed adaptive optics line-scan OCT for cellular-resolution optoretinography,” Biomed. Opt. Express 11(9), 5274–5296 (2020). 10.1364/BOE.399034 [DOI] [PMC free article] [PubMed] [Google Scholar]
- 23.Pandiyan V. P., Maloney-Bertelli A., Kuchenbecker J. A., Boyle K. C., Ling T., Chen Z. C., Park B. H., Roorda A., Palanker D., Sabesan R., “The optoretinogram reveals the primary steps of phototransduction in the living human eye,” Sci. Adv. 6(37), eabc1124 (2020). 10.1126/sciadv.abc1124 [DOI] [PMC free article] [PubMed] [Google Scholar]
- 24.Zhang Y., Cense B., Rha J., Jonnal R. S., Gao W., Zawadzki R. J., Werner J. S., Jones S., Olivier S., Miller D. T., “High-speed volumetric imaging of cone photoreceptors with adaptive optics spectral-domain optical coherence tomography,” Opt. Express 14(10), 4380–4394 (2006). 10.1364/OE.14.004380 [DOI] [PMC free article] [PubMed] [Google Scholar]
- 25.Ginner L., Kumar A., Fechtig D., Wurster L. M., Salas M., Pircher M., Leitgeb R. A., “Noniterative digital aberration correction for cellular resolution retinal optical coherence tomography in vivo,” Optica 4(8), 924–931 (2017). 10.1364/OPTICA.4.000924 [DOI] [Google Scholar]
- 26.Dubra A., Harvey Z., “Registration of 2D Images from Fast Scanning Ophthalmic Instruments,” in Biomedical Image Registration (Springer, Berlin Heidelberg, 2010), 60–71. [Google Scholar]
- 27.Stevenson S. B., Roorda A., Kumar G., “Eye tracking with the adaptive optics scanning laser ophthalmoscope,” in Proceedings of the 2010 Symposium on Eye-Tracking Research & Applications, (Association for Computing Machinery, Austin, Texas, 2010), pp. 195–198. [Google Scholar]
- 28.Sheehy C. K., Yang Q., Arathorn D. W., Tiruveedhula P., de Boer J. F., Roorda A., “High-speed, image-based eye tracking with a scanning laser ophthalmoscope,” Biomed. Opt. Express 3(10), 2611–2622 (2012). 10.1364/BOE.3.002611 [DOI] [PMC free article] [PubMed] [Google Scholar]
- 29.Sheehy C. K., Tiruveedhula P., Sabesan R., Roorda A., “Active eye-tracking for an adaptive optics scanning laser ophthalmoscope,” Biomed. Opt. Express 6(7), 2412–2423 (2015). 10.1364/BOE.6.002412 [DOI] [PMC free article] [PubMed] [Google Scholar]
- 30.Wu M., Fan W., Chen Q., Du Z., Li X., Yuan S., Park H., “Three-dimensional continuous max flow optimization-based serous retinal detachment segmentation in SD-OCT for central serous chorioretinopathy,” Biomed. Opt. Express 8(9), 4257–4274 (2017). 10.1364/BOE.8.004257 [DOI] [PMC free article] [PubMed] [Google Scholar]
- 31.Hassan B., Raja G., Hassan T., Akram M. U., “Structure tensor based automated detection of macular edema and central serous retinopathy using optical coherence tomography images,” J. Opt. Soc. Am. A 33(4), 455–463 (2016). 10.1364/JOSAA.33.000455 [DOI] [PubMed] [Google Scholar]
- 32.Liu Z., Tam J., Saeedi O., Hammer D. X., “Trans-retinal cellular imaging with multimodal adaptive optics,” Biomed. Opt. Express 9(9), 4246–4262 (2018). 10.1364/BOE.9.004246 [DOI] [PMC free article] [PubMed] [Google Scholar]
- 33.de Kinkelder R., Kalkman J., Faber D. J., Schraa O., Kok P. H., Verbraak F. D., van Leeuwen T. G., “Heartbeat-induced axial motion artifacts in optical coherence tomography measurements of the retina,” Invest. Ophthalmol. Visual Sci. 52(6), 3908–3913 (2011). 10.1167/iovs.10-6738 [DOI] [PubMed] [Google Scholar]
- 34.Bowers N. R., Boehm A. E., Roorda A., “The effects of fixational tremor on the retinal image,” J. Vis. 19(11), 8 (2019). 10.1167/19.11.8 [DOI] [PMC free article] [PubMed] [Google Scholar]
- 35.Poletti M., Rucci M., “A compact field guide to the study of microsaccades: Challenges and functions,” Vision Res. 118, 83–97 (2016). 10.1016/j.visres.2015.01.018 [DOI] [PMC free article] [PubMed] [Google Scholar]
- 36.Lu J., Gu B., Wang X., Zhang Y., “High-speed adaptive optics line scan confocal retinal imaging for human eye,” PLoS One 12(3), e0169358 (2017). 10.1371/journal.pone.0169358 [DOI] [PMC free article] [PubMed] [Google Scholar]


