

Abstract
Cellular reprogramming forcing the expression of pluripotency markers can reverse aging of cells but how molecular mechanisms through which reprogrammed cells alter aging-related cellular activities still remain largely unclear. In this study, we reprogrammed human synovial fluid-derived mesenchymal stem cells (MSCs) into induced pluripotent stem cells (iPSCs) using 6 reprogramming factors and reverted the iPSCs back to MSCs, as an approach to cell rejuvenation. Using the parental and reprogrammed MSCs as control non-rejuvenated and rejuvenated cells, respectively, for comparative analysis, we found that aging-related activities were greatly reduced in reprogrammed MSCs compared to those in their parental lines, indicating reversal of cell aging. Global transcriptome analysis revealed differences in activities of regulatory networks associated with inflammation and proliferation. Mechanistically, we demonstrated that compared to control cells, the expression of GATA binding protein 6 (GATA6) in reprogrammed cells was attenuated, resulting in an increase in the activity of sonic hedgehog signaling and the expression level of downstream forkhead box P1 (FOXP1), in turn ameliorating cellular hallmarks of aging. Lower levels of GATA6 expression were also found in cells harvested from younger mice or lower passage cultures. Our findings suggest that GATA6 is a critical regulator increased in aged MSCs that controls the downstream sonic hedgehog signaling and FOXP1 pathway to modulate cellular senescence and aging-related activities.
Keywords: Aging, Mesenchymal stem cells, Reprogramming, Transcription factors, Cell signaling
Graphical Abstract
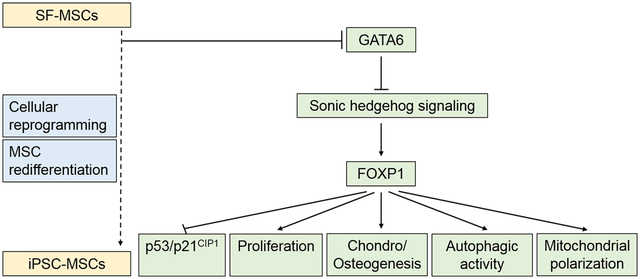
The schema summarizes the GATA6/SHH/FOXP1 mechanism that controls aging-related changes of biological activities in human mesenchymal stem cells. The reduction of GATA6 expression induced by cellular reprogramming results in an increase in the activity of SHH signaling and FOXP1 expression, which in turn attenuates p53/p21CIP1 activity, increases proliferation, autophagic activity, and mitochondrial polarization, and promotes chondrogenic/osteogenic differentiation.
1. INTRODUCTION
The growth in the elderly population prompts scientists to study aging, in hopes of understanding and further controlling the biological process. While various model organisms, such as yeast, Caenorhabditis elegans, Drosophila melanogaster, and the mouse, have been employed to investigate mechanisms of aging, human cells as a platform offer inherent advantages over these non-human models for studying biological aging of humans. Recently, cellular reprogramming using Yamanaka factors to force the expression of pluripotency markers has become a powerful tool capable of manipulating the cellular aging process to provide a better understanding of underlying mechanisms.1 Induced pluripotent stem cells (iPSCs) from patients have been created to study human aging and age‐related diseases. For example, patient-specific iPSCs have been used for modeling age-related diseases, such as Parkinson’s disease2 and Alzheimer’s disease.3 Moreover, cellular reprogramming has been harnessed as an effective approach to ameliorate aging hallmarks in a variety of cultured human cells and restore the regenerative capability to aged muscle stem cells implanted in animals.4
Cellular reprogramming can rejuvenate aged cells through altering senescence‐associated cellular and molecular characteristics, including increasing telomerase activity and telomere length,5 epigenetic remodeling of age-related changes in DNA methylation and histone modification,6 and repression of senescence-related mitochondrial/oxidative stress pathways.7 It has also been shown that the production of pro-inflammatory factors,8 cell cycle arrest,9 and the expression of senescence-associated genes,10 are attenuated by cellular reprogramming. While this compelling evidence demonstrates modulation of aging-induced activities by cellular reprogramming, molecular mechanisms underlying the regulation still remain unclear.
A number of transcription factors (TFs) have been identified as major regulators of cell aging and longevity. For example, Lin et al. have demonstrated that the FOXO orthologue daf16 in C. elegans regulates longevity by altering the insulin/insulin-like growth factor 1 (IGF1) pathway and germline signaling.11 Through the same mechanism, overexpression of dFOXO in Drosophila extends longevity of the organism.12 The regulatory effect of FOXO on longevity of mammals has not been directly addressed but research evidence has shown that FOXO ameliorates age-dependent changes in metabolism and autophagy in an animal model.13 It has been reported that forkhead box P1 (FOXP1), another TF of the FOX family, plays a critical role in controlling fate commitment and senescence of mesenchymal stem cells (MSCs) during skeletal aging.14 Nuclear factor-kappa B and paired box gene 5 have also been shown involved in the regulation of keratinocyte senescence15 and aging-related B cell dysfunction,16 respectively.
Previous studies have demonstrated that direct cellular reprogramming with the use of Yamanaka factors rejuvenates bone marrow-derived MSCs with evidence indicating changes in cellular characteristics,17 DNA methylation profiles,6 or aging signature genes8 between reprogrammed MSCs derived from iPSCs (iPSC-MSCs) and non-reprogrammed parental MSCs; however, the underlying mechanism still remains unclear. In this study, we derived parental MSC lines from human synovial fluid and generated isogenic reprogrammed iPSC-MSC lines for the comparison of aging hallmarks, global transcriptome profiles, and differentiation propensity. Most significantly, we analyzed differential expression of transcripts between reprogrammed and non-reprogrammed MSCs to identify key TFs and target signaling pathways that control aging-related cellular activities using two different models to confirm the findings.
2. MATERIALS AND METHODS
2.1. Isolation of tissue-derived cells
The study was approved by the Institutional Review Board at the University of Wisconsin-Madison. Human synovial fluid-derived MSCs (SF-MSCs) were isolated from synovial fluid obtained from 3 patients (2 males and 1 female aged 40 to 55) undergoing knee arthroscopy following a previously published protocol.18 Human bone marrow-derived MSCs (BMSCs) were isolated from bone marrow harvested from the femoral head and shaft of 3 donors undergoing total hip arthroplasty following our established protocol.19 Mouse handling and procedures were approved by the Institutional Animal Care and Use Committee at the University of Wisconsin-Madison. Tissues, including bone marrow, liver, and muscle, were obtained from 3 young (12-week-old) and 3 aged (74-week-old) mice for cell isolation. Mouse BMSCs were isolated from bone marrow following a previously published protocol20 and harvested liver and muscle were homogenized to collect cells. Detailed methods of isolation and culture of human SF-MSCs, human BMSCs, and mouse BMSCs are described in Appendix S1.
2.2. Generation of human transgene-free iPSCs
Episomal vectors, pEP4 E02S EN2K (plasmid # 20925), pCEP4-M2L (# 20926), and pEP4 E02S ET2K (# 20927) (Addgene, Cambridge, MA, USA), were a gift from Dr. James Thomson and details about the plasmids are described in this publication.21 To generate transgene-free iPSCs, 1 × 10⁶ early passage SF-MSCs (P3) with uniform spindle-shaped morphology and size from each donor were transfected with combinations of episomal plasmids carrying OCT4, SOX2, KLF4, c-MYC, NANOG, and LIN28 (3 μg of pEP4 E02S ET2K, 3 μg of pEP4 E02S EN2K, and 2 μg of pCEP4-M2L) using Nucleofector™ II with the U-20 program (Amaxa, Walkersville, MD, USA) and the Nucleofector kit R (Lonza, Hayward, CA, USA). The entire procedure of iPSC derivation from SF-MSCs is summarized in Figure S1A and detailed culture methods are described in Appendix S1. A total of 6 iPSC lines with 2 lines per donor were generated and analyzed for this study.
2.3. Generation of iPSC-MSCs
Individual iPSC lines were induced using the STEMdiff™ mesenchymal progenitor kit (STEMCELL Technologies, Vancouver, BC, Canada) to generate iPSC-MSCs following the manufacturer’s instructions. The detailed method of iPSC-MSC derivation is described in Appendix S1. A total of 3 iPSC-MSC lines with 1 line per donor were generated and analyzed for this study.
2.4. Biological assays and analyses
Details of assays and analyses used in this study are described in Appendix S1. Information of the antibody used in this study is provided in Table S1. Sequences of the primers are listed in Table S2. Files containing RNA-sequencing (RNA-Seq) raw sequences have been deposited in NCBI Gene Expression Omnibus under the accession number GSE120800.
2.5. Statistical analysis
All quantitative data of assays analyzing cells from 3 independent donors were presented as mean ± standard deviation, as the assays were performed with samples in biological triplicates (n = 3). Student’s t-test or one-way analysis of variance (ANOVA) with post-hoc Tukey’s test was used for statistical comparison. A p-value less than 0.05 was considered statistically significant.
3. RESULTS
3.1. iPSC-MSCs are MSC-like cells with characteristics of cellular rejuvenation
We characterized pluripotency markers, the formation of three germ layers, karyotypes, and transgene expression to demonstrate the establishment of 6 integration-free iPSC lines (Figure S1). We then differentiated 3 of them (1 line per donor) into iPSC-MSCs. Compared to their parental SF-MSCs, the iPSC-MSCs exhibited similar fibroblast-like morphology and immunophenotypes and comparable immunomodulatory capacity (Figure S2). All iPSC-MSC lines were transgene-free as iPSC lines but expressed low levels of transcripts of endogenous pluripotency markers (Figure S1H and I). Unlike parental iPSCs giving rise to teratomas, iPSC-MSC lines did not result in any tumor formations (Figure S3). Notably, the cell growth curve showed that iPSC-MSCs underwent significantly more cumulative population doublings than SF-MSCs in long-term culture (Figure S2C), and the analysis of multi-lineage differentiation demonstrated that iPSC-MSCs possessed increased propensity for osteogenesis and chondrogenesis but not for adipogenesis compared to SF-MSCs (Figure S4). Given that aging MSCs tend to lose the proliferative potential and tilt the balance of differentiation toward adipogenesis,22, 23 our findings indicate that iPSC-MSCs are likely to be rejuvenated MSCs.
3.2. Cellular hallmarks of aging are ameliorated in iPSC-MSCs
To determine the senescence level of SF-MSCs and iPSC-MSCs, we first performed senescence-associated β-galactosidase (SA-β-gal) staining on the cells at the same population doubling (PD) level and found that the number of SA-β-gal+ cells in SF-MSC culture was greater than that in iPSC-MSC culture. Quantitatively, SF-MSCs (76.5 ± 7.1%) were more prone to senescence than iPSC-MSCs (16.3 ± 3.4%) in culture (Figure 1A). We next measured the expression of senescence- and cell cycle-associated markers and found that levels of p53 and p21CIP1 were significantly lower and levels of cyclin-dependent kinase 1 (CDK1) were significantly higher in iPSC-MSCs than those in SF-MSCs at each cell passage whereas there were no differences in levels of p16INK4A between the two groups of cells (Figure 1B–E). Results of western blot images and quantifications (Figure 1F) corroborated those of mRNA expression determined by quantitative RT-PCR. Additionally, results showed that the telomere lengths of iPSC-MSCs determined by quantitative RT-PCR analysis were significantly longer than those of SF-MSCs (Figure 1G). Mitochondrial membrane potential (MMP) disruption increases with age.24 The ratio of red/green fluorescence of JC-1 dye as an indicator of mitochondrial polarization in iPSC-MSCs was higher than that in SF-MSCs (Figure 1H), suggesting an increased disruption of mitochondrial membrane integrity in SF-MSCs. Detection of microtubule-associated protein light chain 3-II (LC3-II) to monitor autophagy25 revealed a higher level of LC3-II in iPSC-MSCs compared that in SF-MSCs (Figure 1I). Expression levels of sirtuin 1 (SIRT1), a nutrient-sensor regulating aging and resistance to oxidative stress,26 exhibited the same trend between the two cell types (Figure 1J). Lastly, global DNA methylation of a cell decreases with aging.27 The extent of global DNA methylation in iPSC-MSCs measured by levels of 5-methylcytosine (5mC) and 5-hydroxymethylcytosine (5hmC) was greater than that in SF-MSCs (Figure 1K). Taken together, these results suggest that cellular and molecular hallmarks of aging are ameliorated in iPSC-MSCs.
Figure 1. Senescence-associated phenotypes and activities of SF-MSCs and iPSC-MSCs.
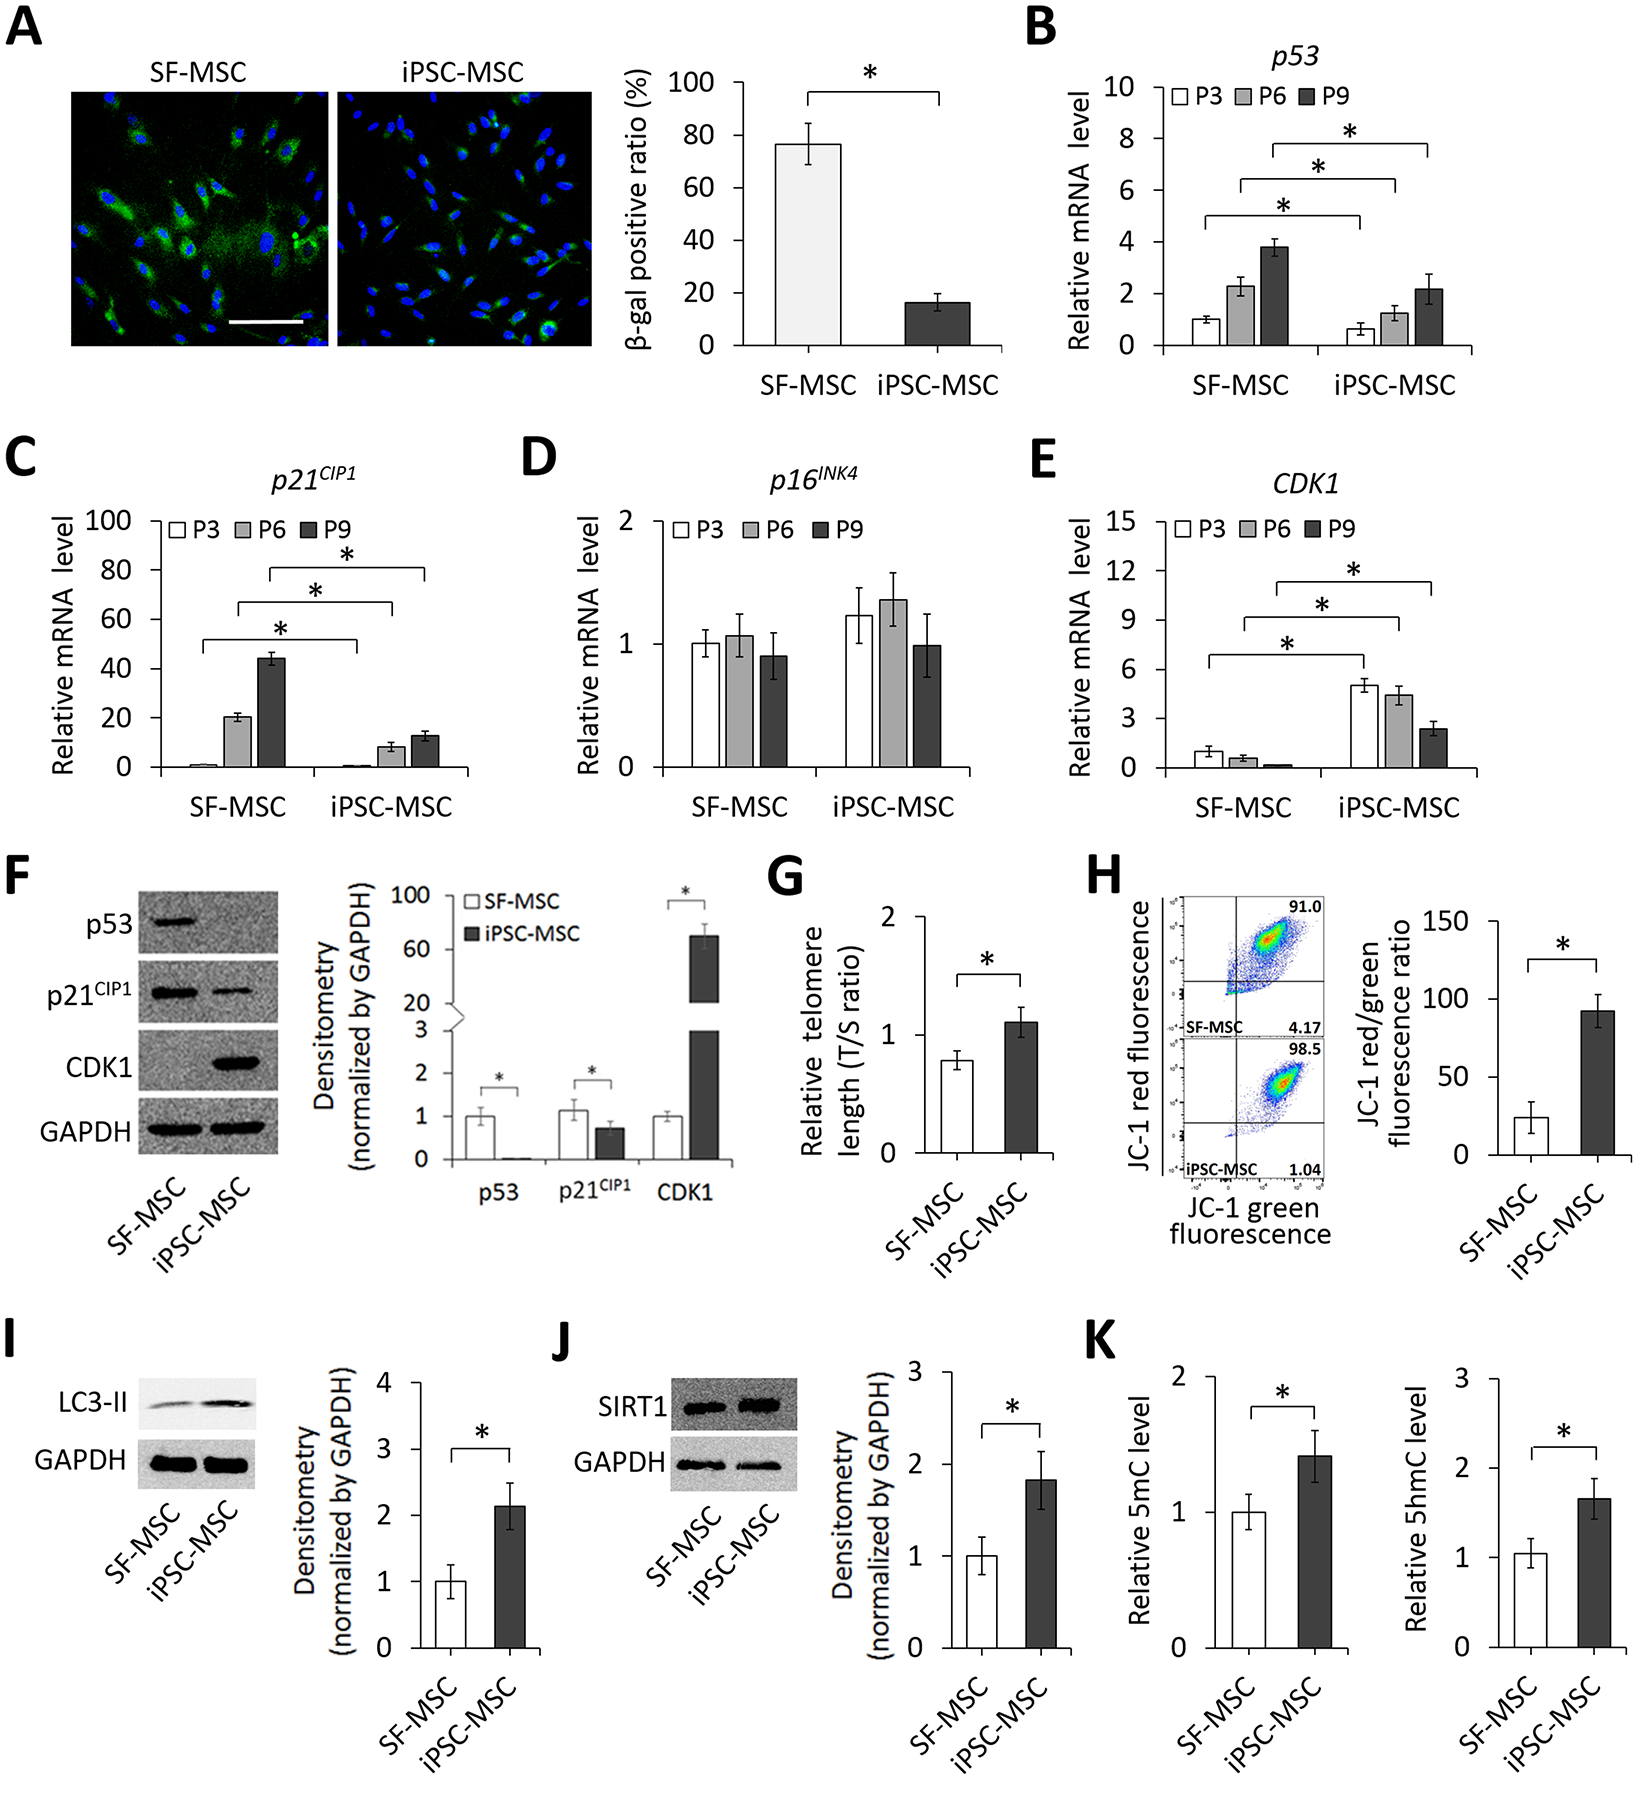
(A) Micrographs and quantification of SA-β-gal staining of SF-MSCs and iPSC-MSCs. DAPI stains the nucleus (blue). Scale bar = 100 μm. Quantification results are expressed as the percentage of stained cells. (B-E) Relative expression levels of p53, p21CIP1, p16INK4A, and CDK1 in SF-MSCs and iPSC-MSCs at different passages analyzed by quantitative RT-PCR. (F) Images and quantification of western blots detecting p53, p21CIP1, and CDK1 expression in SF-MSCs and iPSC-MSCs. GAPDH was used as a loading control. (G) Relative telomere length of cells shown as a ratio of copy number of telomere repeat to single control gene. (H) Flow cytometric analysis of the mitochondrial membrane potential of SF-MSCs and iPSC-MSCs. Percentages of cells are given in respective quadrants. Bar graphs show relative ratios of red to green fluorescent cells. (I) Images and quantification of western blots detecting autophagy-related protein LC3-II levels in SF-MSCs and iPSC-MSCs. GAPDH was used as a loading control. (J) Images and quantification of western blots detecting the nutrient-sensor, SIRT1, levels in SF-MSCs and iPSC-MSCs. GAPDH was used as a loading control. (K) Relative levels of global DNA methylation, 5mC and 5hmC, in SF-MSCs and iPSC-MSCs determined by ELISA. *p < 0.05; n = 3.
3.3. iPSC-MSCs share similarities in global transcriptome with SF-MSCs but retain molecular traits of iPSCs
To investigate changes in global gene expression resulting from cellular reprogramming, we performed an unbiased transcriptomic analysis by RNA-seq. Pairwise contrasts were extracted and genes with adjusted P-value < 0.05 and fold change > 2 were deemed to be differentially expressed (DE). Table S3 includes all analyzed genes differentially expressed in SF-MSCs, iPSCs, and iPSC-MSCs. As shown in Figure 2A, principal component analysis (PCA) of log-normalized RNA-seq data separated samples based on cell type along the first component rather than donor identity, and the 2 MSC populations were distinct from iPSCs. There was, nevertheless, also a clear distinction between the 2 MSC populations. Pairwise comparisons were made to identify DE genes (Figure S5). The unique superset of all DE genes from these analyses was used to cluster cell types and genes (Figure 2B, and Table S4). As expected from the PCA plot, iPSC-MSCs and SF-MSCs were clustered together and the majority of DE genes distinguished iPSCs from the 2 MSC populations (Groups A, n = 3563; Group D, n = 2337). Examination of functional annotations of the top 500 genes of these 2 subclusters revealed an enrichment of genes related to maintenance of a pluripotent stem cell population in Group A (p = 3.4 × 10⁻⁶, Figure 2C) while Group D was enriched for the extracellular matrix (ECM) genes (p = 1.9 × 10⁻¹⁷, Figure 2D). Groups B (n = 2010) and E (n = 1691), on the other hand, reflected similarities between iPSCs and their derived iPSC-MSCs relative to non-reprogrammed parental SF-MSCs. Given that SF-MSCs were isolated from diseased joints of osteoarthritis patients, it was interesting to find inflammatory response-associated genes enriched in Group E where the expression of SF-MSCs was highest (p = 1.8 × 10⁻⁵, Figure 2E). To gain further insights into the difference between SF-MSCs and iPSC-MSCs, gene set enrichment analysis (GSEA) was performed against hallmark gene-set signatures (Table S5 for details). Results revealed that the gene sets associated with inflammation/immune function, senescence/apoptosis, and myogenesis/adipogenesis were more strongly correlated with SF-MSCs (normalized enrichment score (NES) > 0) while those associated with cell proliferation and hedgehog signaling were enriched in iPSC-MSCs (NES < 0) (Figure 2F). Notably, the differences in enriched gene sets of cell proliferation and senescence/apoptosis between iPSC-MSCs and SF-MSCs may underlie the distinct cell growth rates shown in Figure S2C. Lists of hallmark gene sets up-regulated in iPSC-MSCs or SF-MSCs are provided in Table S6. Some of these gene sets, such as those associated with tumor necrosis factor alpha signaling via nuclear factor kappa B, the p53 pathway, and adipogenesis were enriched in SF-MSCs whereas those associated with E2F targets and hedgehog signaling correlated more strongly with iPSC-MSCs, as shown in the representative enrichment plots of gene sets (Figure 2G). Detailed lists of individual genes of the gene sets are provided in Table S7. Taken together, our RNA-seq results clearly indicate that iPSC-MSCs are more similar to SF-MSCs than to iPSCs despite differences between the 2 types of MSCs.
Figure 2. Differential expression analysis of RNA-seq.
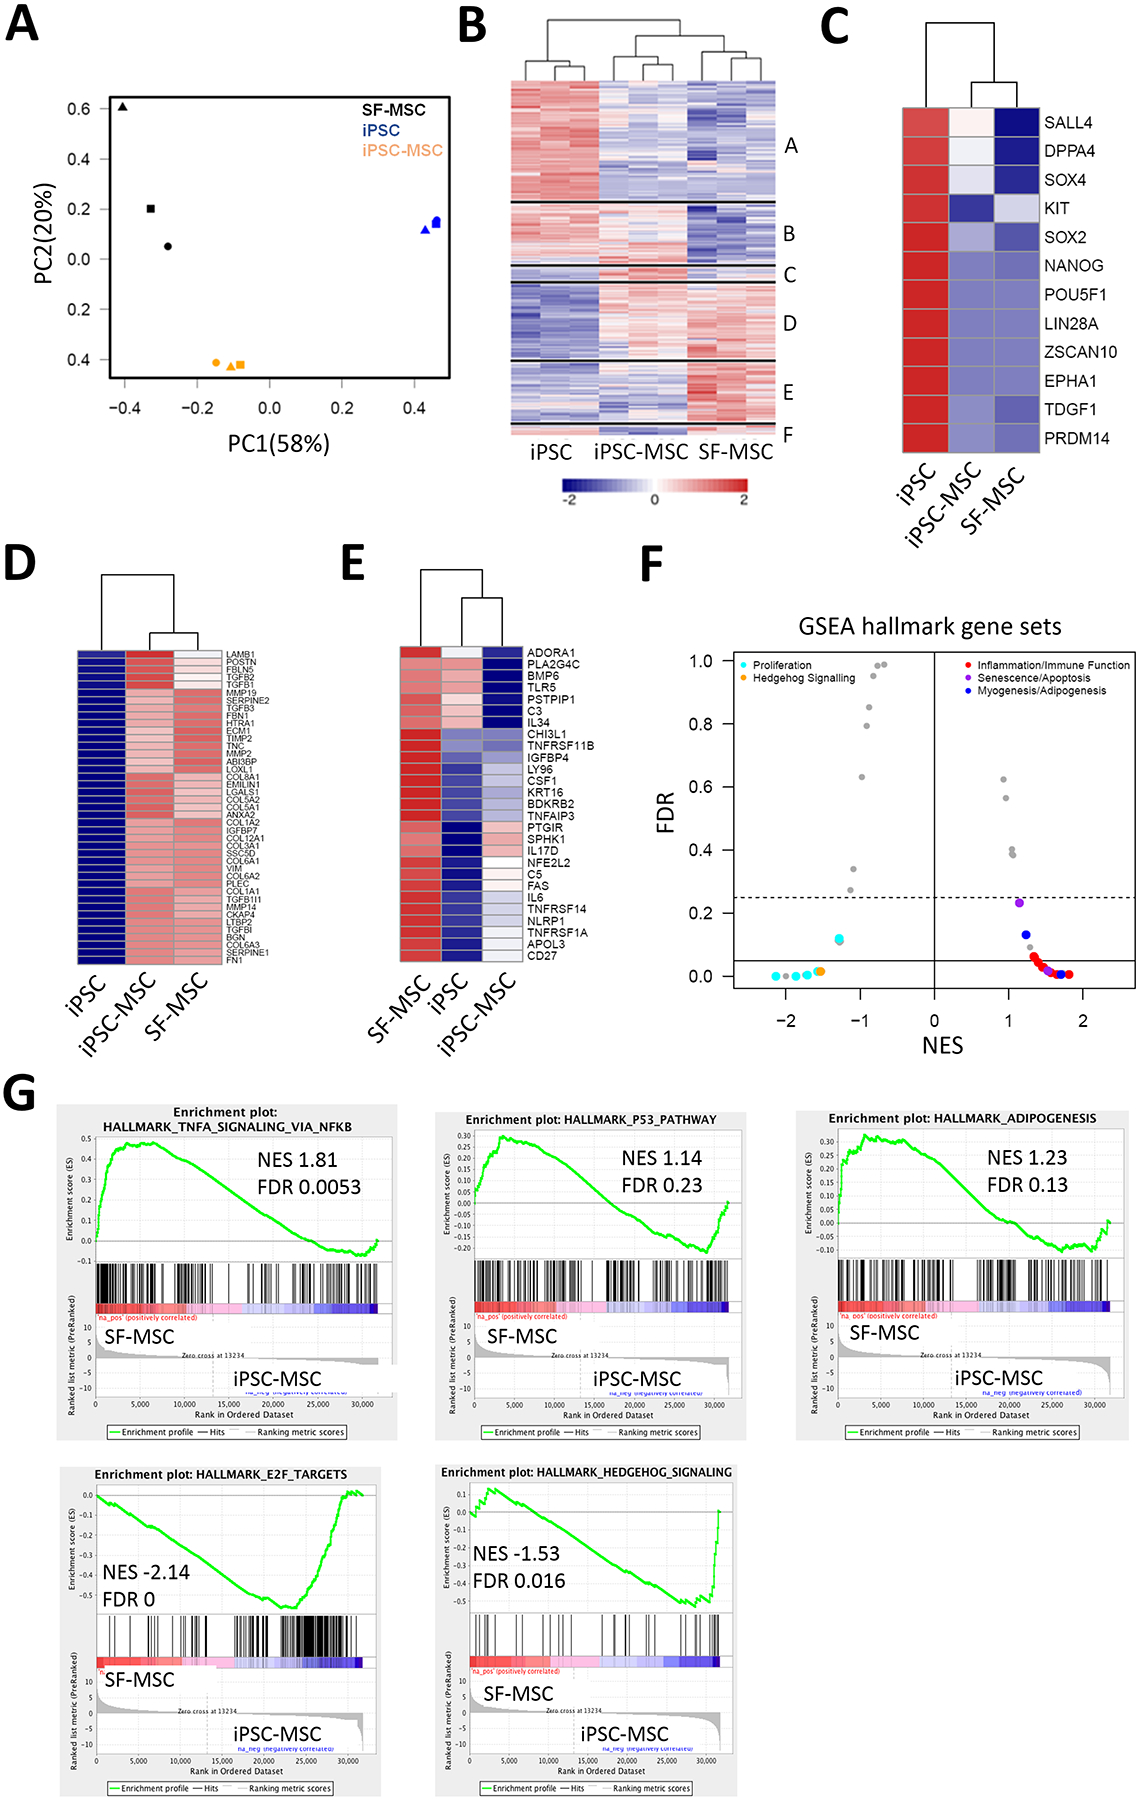
(A) Principal component analysis of SF-MSCs, iPSCs, and iPSC-MSCs from 3 independent donors (indicated by the 3 different symbol shapes). Regularized log2 values were used as input. (B) Hierarchical clustering using the unique superset of genes with differential expression in any pairwise combination of the 3 cell types. Each of the major clusters is separated by a horizontal line and identified by “A”-“F” to highlight sub-clusters where two cell types were more similar to each other than to the third. Clustering is by Euclidean distance for both genes and samples. The indicated groups are based on the gene dendrogram cut into 6 groups (up- and down-regulated genes for each of the 3 pairwise comparisons). Values are Z-scores of normalized log2 counts. (C) Heat map of GO: 0035019 corresponding to stem cell maintenance genes enriched in Group A from (B). (D) Heat map of GO: 0031012 corresponding to extracellular matrix genes enriched in Group D from (B). (E) Heat map of GO: 0006954 corresponding to inflammatory response genes enriched in Group E from (B). (F) Mustache plot of hallmark gene signatures enrichment. GSEA of genes pre-ranked by log2 fold-change of SF-MSCs versus iPSC-MSCs. Signatures with NES > 0 correlated strongly with SF-MSCs and those with NES < 0 enriched in iPSC-MSCs. (G) Mountain plots of 5 gene sets highlighted in (F). n = 3. NES: normalized enrichment score.
3.4. GATA binding protein 6 (GATA6) and FOXP1 control cellular reprogramming-induced changes of MSC activities
To identify TFs mediating the molecular regulation underlying MSC rejuvenation through cellular reprogramming, we first analyzed our RNA-seq results of differential gene expression between SF-MSCs, iPSCs, and iPSC-MSCs (Table S8). From the complete list, we initially identified a total of 48 TFs as molecules of interest (Table 1). Among those identified, 14 considered enhancers for regulation were upregulated in response to cellular reprogramming and then downregulated after MSC redifferentiation with higher resulting expression observed in iPSC-MSCs than that in SF-MSCs. On the other hand, 34 of them considered repressors were downregulated in response to cellular reprogramming and then upregulated after MSC redifferentiation with lower resulting expression in iPSC-MSCs than that in SF-MSCs. We then selected 11 representative targets with at least a 1.5-fold difference in the expression level between SF-MSCs and iPSC-MSCs from the 48 molecules for further investigation. Moreover, because FOXP1 has been shown as a key molecule regulating the lineage determination and senescence of MSCs,14 we also included FOXP1 as an added target in the subsequent analysis.
Table 1.
Expression levels of 48 transcription factors in SF-MSCs, iPSCs, and iPSC-MSCs
| Enhancing regulators | Repressing regulators | ||||||
|---|---|---|---|---|---|---|---|
| Gene name | SF-MSC | iPSC | iPSC-MSC | Gene name | SF-MSC | iPSC | iPSC-MSC |
| ARID3A | 8.30 | 11.28 | 10.02 | BCL3 | 9.75 | 6.24 | 7.98 |
| ETV1 | 6.43 | 10.63 | 8.61 | BCL6 | 10.68 | 7.54 | 9.14 |
| ETV4 | 5.35 | 12.03 | 9.78 | CEBPD | 10.32 | 5.58 | 8.37 |
| E2F5 | 7.73 | 10.62 | 9.11 | CREB5 | 11.47 | 5.19 | 8.33 |
| FOXA3 | 0.14 | 9.08 | 2.33 | EBF1 | 11.60 | 3.97 | 6.19 |
| FOXJ1 | 0.32 | 7.20 | 3.93 | EGR1 | 12.74 | 8.44 | 10.52 |
| HDAC2 | 10.17 | 12.87 | 11.66 | EPAS1 | 13.01 | 7.58 | 10.65 |
| NR1I2 | 0.90 | 5.99 | 3.49 | FOSL2 | 13.71 | 7.84 | 12.43 |
| PARP1 | 10.43 | 13.47 | 11.66 | FOXC1 | 11.89 | 3.49 | 9.05 |
| SALL3 | 1.01 | 9.31 | 2.62 | GABPB2 | 10.00 | 7.34 | 8.76 |
| SALL4 | 4.25 | 12.45 | 8.33 | GATA6 | 9.10 | 1.72 | 5.23 |
| SOX2 | 1.08 | 12.89 | 3.24 | HIVEP2 | 10.91 | 8.71 | 9.85 |
| SOX4 | 10.28 | 13.90 | 11.78 | JUNB | 12.01 | 6.19 | 10.59 |
| TFAP2C | 0.08 | 6.83 | 2.18 | JDP2 | 11.93 | 8.98 | 10.16 |
| KLF2 | 9.69 | 2.18 | 7.22 | ||||
| KLF4 | 12.47 | 5.98 | 10.19 | ||||
| MAF | 12.29 | 7.94 | 10.51 | ||||
| NEAT1 | 14.48 | 7.85 | 11.28 | ||||
| NFE2L2 | 11.73 | 9.54 | 10.65 | ||||
| NFIB | 10.99 | 8.02 | 9.29 | ||||
| NFIC | 12.84 | 7.55 | 11.81 | ||||
| NFIX | 13.92 | 3.69 | 10.48 | ||||
| NR3C1 | 11.91 | 8.61 | 10.35 | ||||
| PITX1 | 10.23 | 0.44 | 3.02 | ||||
| PLAGL1 | 12.08 | 5.67 | 10.41 | ||||
| PURA | 10.73 | 8.11 | 9.60 | ||||
| SMURF2 | 13.80 | 10.83 | 12.08 | ||||
| STAT6 | 13.49 | 10.68 | 11.74 | ||||
| TNFAIP3 | 10.78 | 6.09 | 7.66 | ||||
| TWIST1 | 10.04 | 3.15 | 8.81 | ||||
| TWIST2 | 9.46 | 5.42 | 7.50 | ||||
| VDR | 9.89 | 5.78 | 8.33 | ||||
| ZEB1 | 11.45 | 3.68 | 10.18 | ||||
| ZEB2 | 10.82 | 3.44 | 8.74 | ||||
Quantitative RT-PCR used to validate the result of RNA-seq showed that consistently expression levels of ETS variant 4 (ETV4), forkhead box A3 (FOXA3), forkhead box J1 (FOXJ1), nuclear receptor subfamily 1 group I member 2 (NR1I2), spalt like transcription factor 3 (SALL3), spalt like transcription factor 4 (SALL4), sex determining region Y-box 2 (SOX2), transcription factor AP-2 gamma (TFAP2C), and FOXP1 in iPSC-MSCs were significantly higher than those in SF-MSCs whereas expression levels of GATA6, paired like homeodomain 1 (PITX1), and early B-cell factor 1 (EBF1) between the two cell types showed an opposite trend (Figure 3A). To evaluate the functional role of these TFs in regulating MSC activities, we first examined effects of each of them with manipulated expression on directing multi-lineage differentiation of iPSC-MSCs by transfecting the cell with siRNA or a scrambled control, followed by 14 days of lineage-specific differentiation induction. Results showed that GATA6 knockdown resulted in markedly upregulated osteogenesis of the cell, as shown by an increase in the intensity of Alizarin red staining, calcium deposition, and the mRNA expression of bone-associated markers, core-binding factor subunit alpha 1 (CBFA1) and alkaline phosphatase (ALP) (Figure 3B). Similarly, GATA6 knockdown led to significantly upregulated chondrogenesis of the cell in micromass culture, as demonstrated by an increase in the intensity of Alcian blue staining, glycosaminoglycans (GAGs) production, and the mRNA expression of cartilage-associated markers, sex determining region Y-box 9 (SOX9) and collagen type 2 (COL2) (Figure 3C). Adipogenesis of the GATA6-knockdown cell, however, was significantly downregulated with a decrease in Oil red O staining and a decrease in mRNA expression of fat-associated markers, peroxisome proliferator-activated receptor gamma 2 (PPARG2) and lipoprotein lipase (LPL) (Figure 3D). On the other hand, FOXP1 knockdown generated a completely opposite effect on regulating multi-lineage differentiation of iPSC-MSCs compared to GATA6 knockdown (Figure 3B–D), suggesting that GATA6 and FOXP1 may function antagonistically in the mechanism. Because results of mRNA expression of lineage-associated markers showed that knockdown of the other 10 TFs did not or only partially affected multi-lineage differentiation of the cell (Figure S6), we decided not to further investigate their roles in this study.
Figure 3. Characterization of TF candidates in the regulation of MSC differentiation, senescence, proliferation, autophagy, and mitochondrial membrane potential.
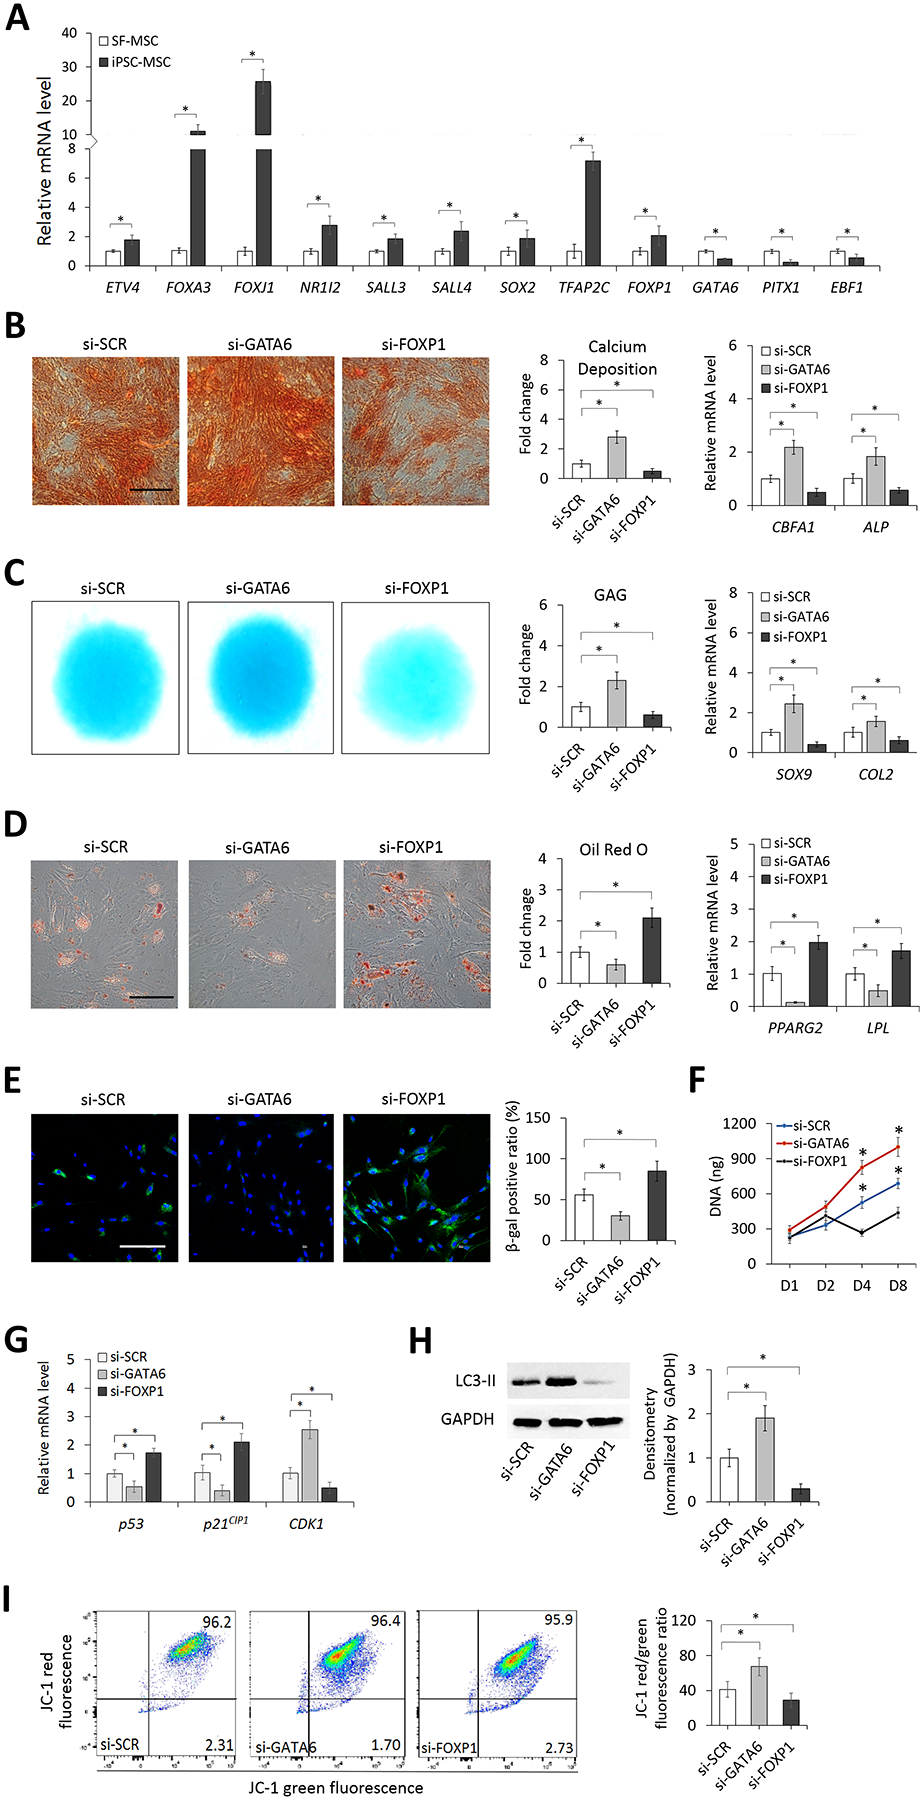
(A) Relative expression levels of 12 selected TFs in SF-MSCs and iPSC-MSCs analyzed by quantitative RT-PCR. Effects of GATA6 and FOXP1 knockdown on osteogenesis of iPSC-MSCs determined by Alizarin red staining (Scale bar = 200 μm), calcium deposition, and expression of bone-associated markers (B), chondrogenesis by Alcian blue staining, GAG content, and expression of cartilage-associated markers in cell micromass culture (C), and adipogenesis by Oil red O staining (Scale bar = 200 μm) and quantification and expression of fat-associated markers (D). (E) Micrographs and quantification of SA-β-gal staining of iPSC-MSCs transfected with scrambled control, GATA6, or FOXP1 siRNA (si-SCR, si-GATA6, or si-FOXP1). DAPI stains the nucleus (blue). Scale bar = 100 μm. Quantification results are expressed as the percentage of stained cells. (F) Proliferation of iPSC-MSCs transfected with si-SCR, si-GATA6, or si-FOXP1 determined by quantifying total DNA content. (G) Relative expression levels of p53, p21CIP1, and CDK1 in iPSC-MSCs transfected with si-SCR, si-GATA6, or si-FOXP1 analyzed by quantitative RT-PCR. (H) Western blot analysis of autophagy-related protein LC3-II levels in iPSC-MSCs transfected with si-SCR, si-GATA6, or si-FOXP1. (I) Mitochondrial membrane potential of iPSC-MSCs transfected with si-SCR, si-GATA6, or si-FOXP1 determined by flow cytometry. *p < 0.05; n = 3.
We then investigated whether GATA6 and FOXP1 were involved in the regulation of cellular senescence of iPSC-MSCs by comparing effects of siRNA knockdown of the molecules on the amount of SA-β-gal+ cells in culture. There was a significantly lower ratio of cells stained positive for SA-β-gal in the culture of GATA6-knockdown cells compared to that in the culture of control cells whereas the opposite trend was shown between the culture of FOXP1-knockdown and control cells (Figure 3E), suggesting that repressing the expression of GATA6 or FOXP1 leads to attenuation or increase of cellular senescence, respectively. Results of DNA content analysis showed that repressing the expression of GATA6 in iPSC-MSCs promoted cell proliferation whereas that of FOXP1 significantly inhibited cell proliferation (Figure 3F). In terms of the activity of senescence- and cell cycle-associated markers, GATA6 knockdown resulted in a significant decrease in the expression of p53 and p21CIP1 and a significant increase in the expression of CDK1. Conversely, FOXP1 knockdown significantly increased the p53 and p21CIP1 expression and significantly decreased the CDK1 expression (Figure 3G). Results of autophagy detection showed that the level of autophagy-related LC3-II was significantly higher in GATA6-knockdown cells and significantly lower in FOXP1-knockdown cells than that of control cells (Figure 3H). The analysis of mitochondrial polarization revealed that GATA6 knockdown significantly increased the JC-1 red/green fluorescence ratio whereas FOXP1 knockdown significantly reduced the ratio (Figure 3I). Interestingly, we found no differences in the extent of global DNA methylation and the expression level of SIRT1 between GATA6- or FOXP1-knockdown and control cells (Figure S7A–B).
To confirm the role of GATA6 and FOXP1 determined through loss-of-function mutation, we further examined effects of overexpression of the molecules on multi-lineage differentiation and aging hallmarks of iPSC-MSCs. Results showed that GATA6 overexpression significantly reduced osteogenesis and chondrogenesis but increased adipogenesis of the cell compared to those of the control (Figure 4A–C). In addition, GATA6-overexpressing cells exhibited increased aging hallmarks, as demonstrated by more SA-β-gal-positive cells (Figure 4D), reduced cell proliferation (Figure 4E), upregulated expression of senescence-associated markers (Figure 4F), decreased autophagic activity (Figure 4G), and increased disruption of mitochondrial membrane integrity (Figure 4H), compared to control cells. On the other hand, FOXP1-overexpressing cells exhibited increased osteogenesis/chondrogenesis and reduced aging hallmarks compared to control cells (Figure 4A–H). Similar to results of the knockdown assay, there were no differences in the extent of global DNA methylation and the expression level of SIRT1 between GATA6- or FOXP1-overexpressing and control cells (Figure S7C and D). Lastly, we examined whether GATA6 and FOXP1 directly interact with p53. Through the analysis of co-immunoprecipitation (co-IP), we detected the binding of FOXP1 to p53 (Figure 4I) but no direct interaction between GATA6 and p53 (data not shown). Taken together, these results suggest that GATA6 and FOXP1 are key controlling TFs downregulated and upregulated, respectively, in iPSC-MSCs to increase the capacity of cell proliferation and aging amelioration and modulate the differentiation propensity toward the osteogenic/chondrogenic lineage.
Figure 4. Effects of overexpression of GATA6 and FOXP1 on MSC differentiation, senescence, proliferation, autophagy, and mitochondrial membrane potential.
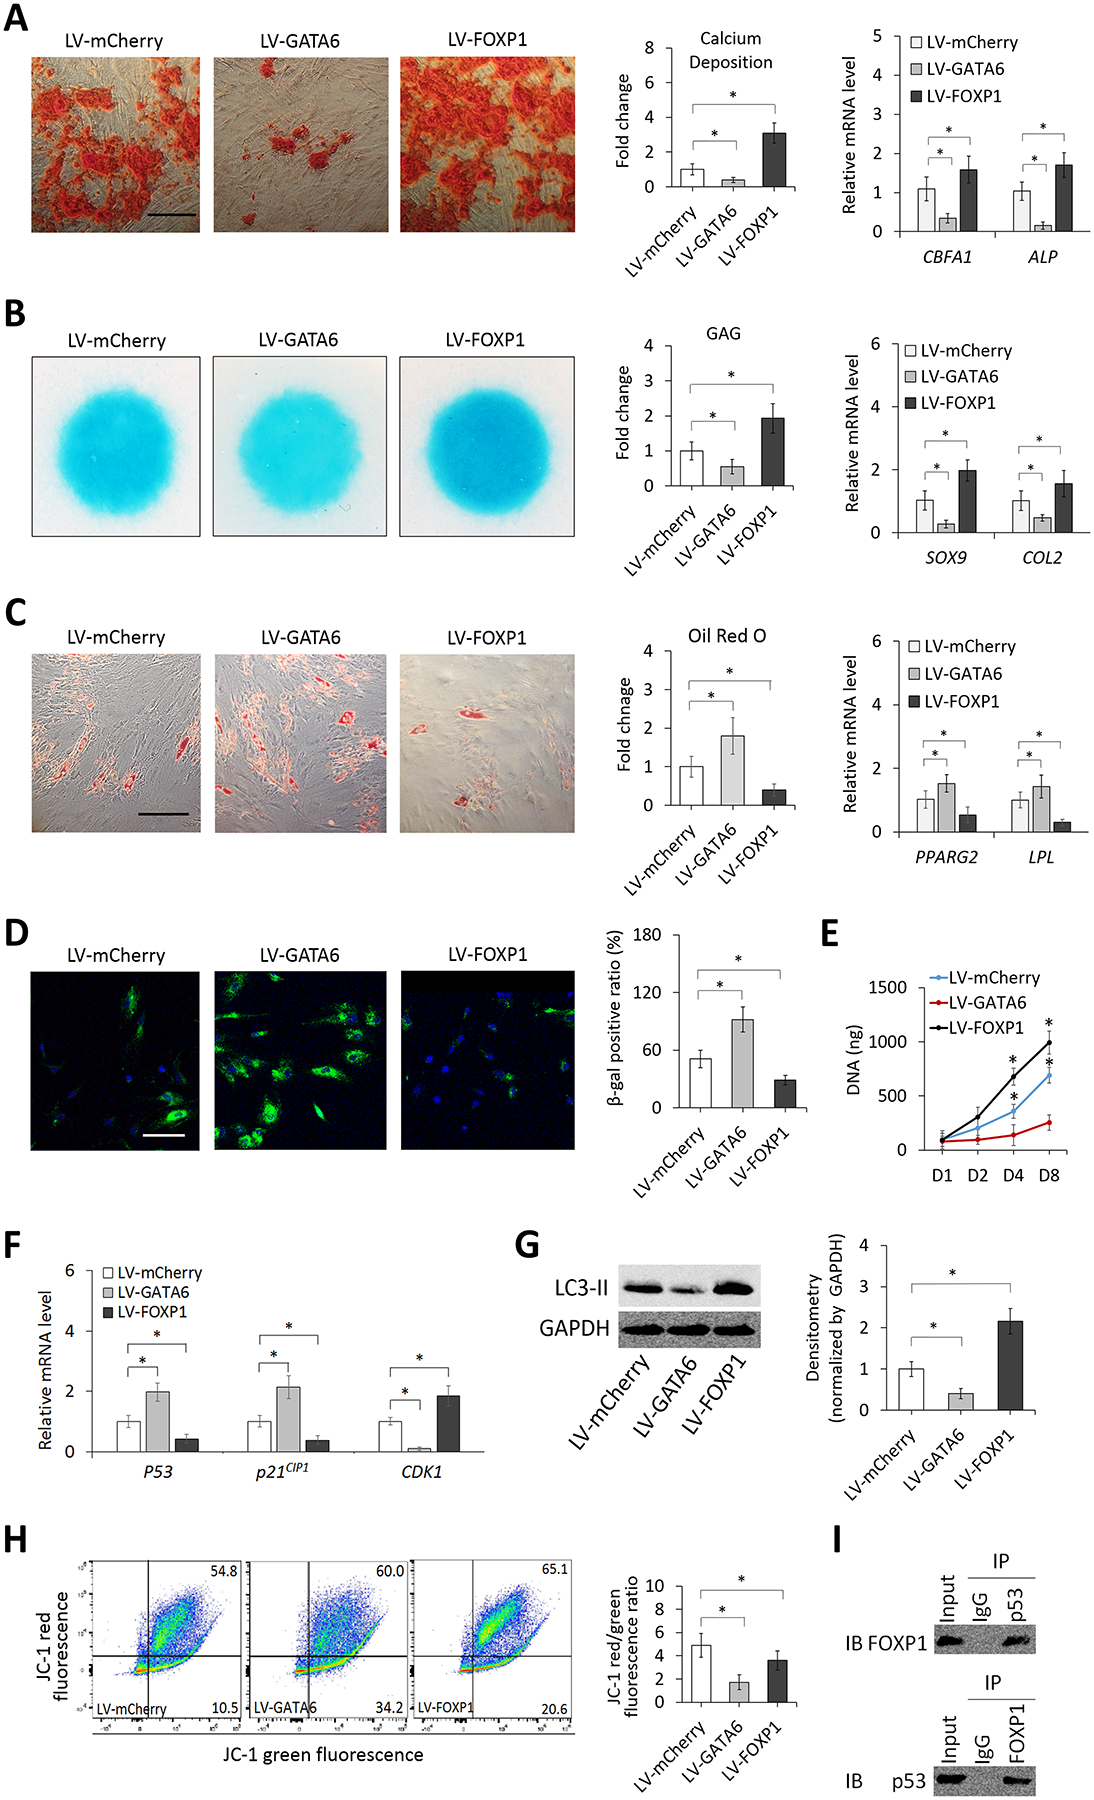
(A) Osteogenesis of GATA6- and FOXP1-overexpressing and control (mCherry-expressing) iPSC-MSCs determined by Alizarin red staining (Scale bar = 200 μm), calcium deposition, and expression of bone-associated markers. (B) Chondrogenesis of the cells in micromass culture determined by Alcian blue staining, GAG content, and expression of cartilage-associated markers. (C) Adipogenesis of the cell determined by Oil red O staining (Scale bar = 200 μm) and quantification and expression of fat-associated markers. (D) Micrographs and quantification of SA-β-gal staining of the cells. DAPI stains the nucleus (blue). Scale bar = 100 μm. Quantification results are expressed as the percentage of stained cells. (E) Proliferation of the cells determined by quantifying total DNA content. (F) Relative expression levels of p53, p21CIP1, and CDK1 in the cells analyzed by quantitative RT-PCR. (G) Western blot analysis of autophagy-related protein LC3-II levels in the cells. (H) Mitochondrial membrane potential of the cells determined by flow cytometry. (I) Interaction between FOXP1 with p53 in iPSC-MSCs analyzed by co-IP. *p < 0.05; n = 3. LV: lentivirus vector.
To further confirm the association of GATA6 and FOXP1 regulation with cell aging, we measured expression levels of the molecules in cultured human cells at different passages and in different tissue types of young (12-week-old) and aged (74-week-old) mice. Results showed that the GATA6 expression was increased while the FOXP1 expression was decreased with increased cell passage in both human iPSC-MSCs and bone marrow-derived MSCs (BMSCs) (Figure 5A and B). Similar trends of increased expression levels of Gata6 and decreased expression levels of Foxp1 were also found in cells harvested from bone marrow, muscle, and liver between young and aged mice (Figure 5C–E).
Figure 5. Relative expression levels of GATA6 and FOXP1 and effects of GATA6 knockdown on senescence-associated activities in cells at different passages or tissues of different age mice.
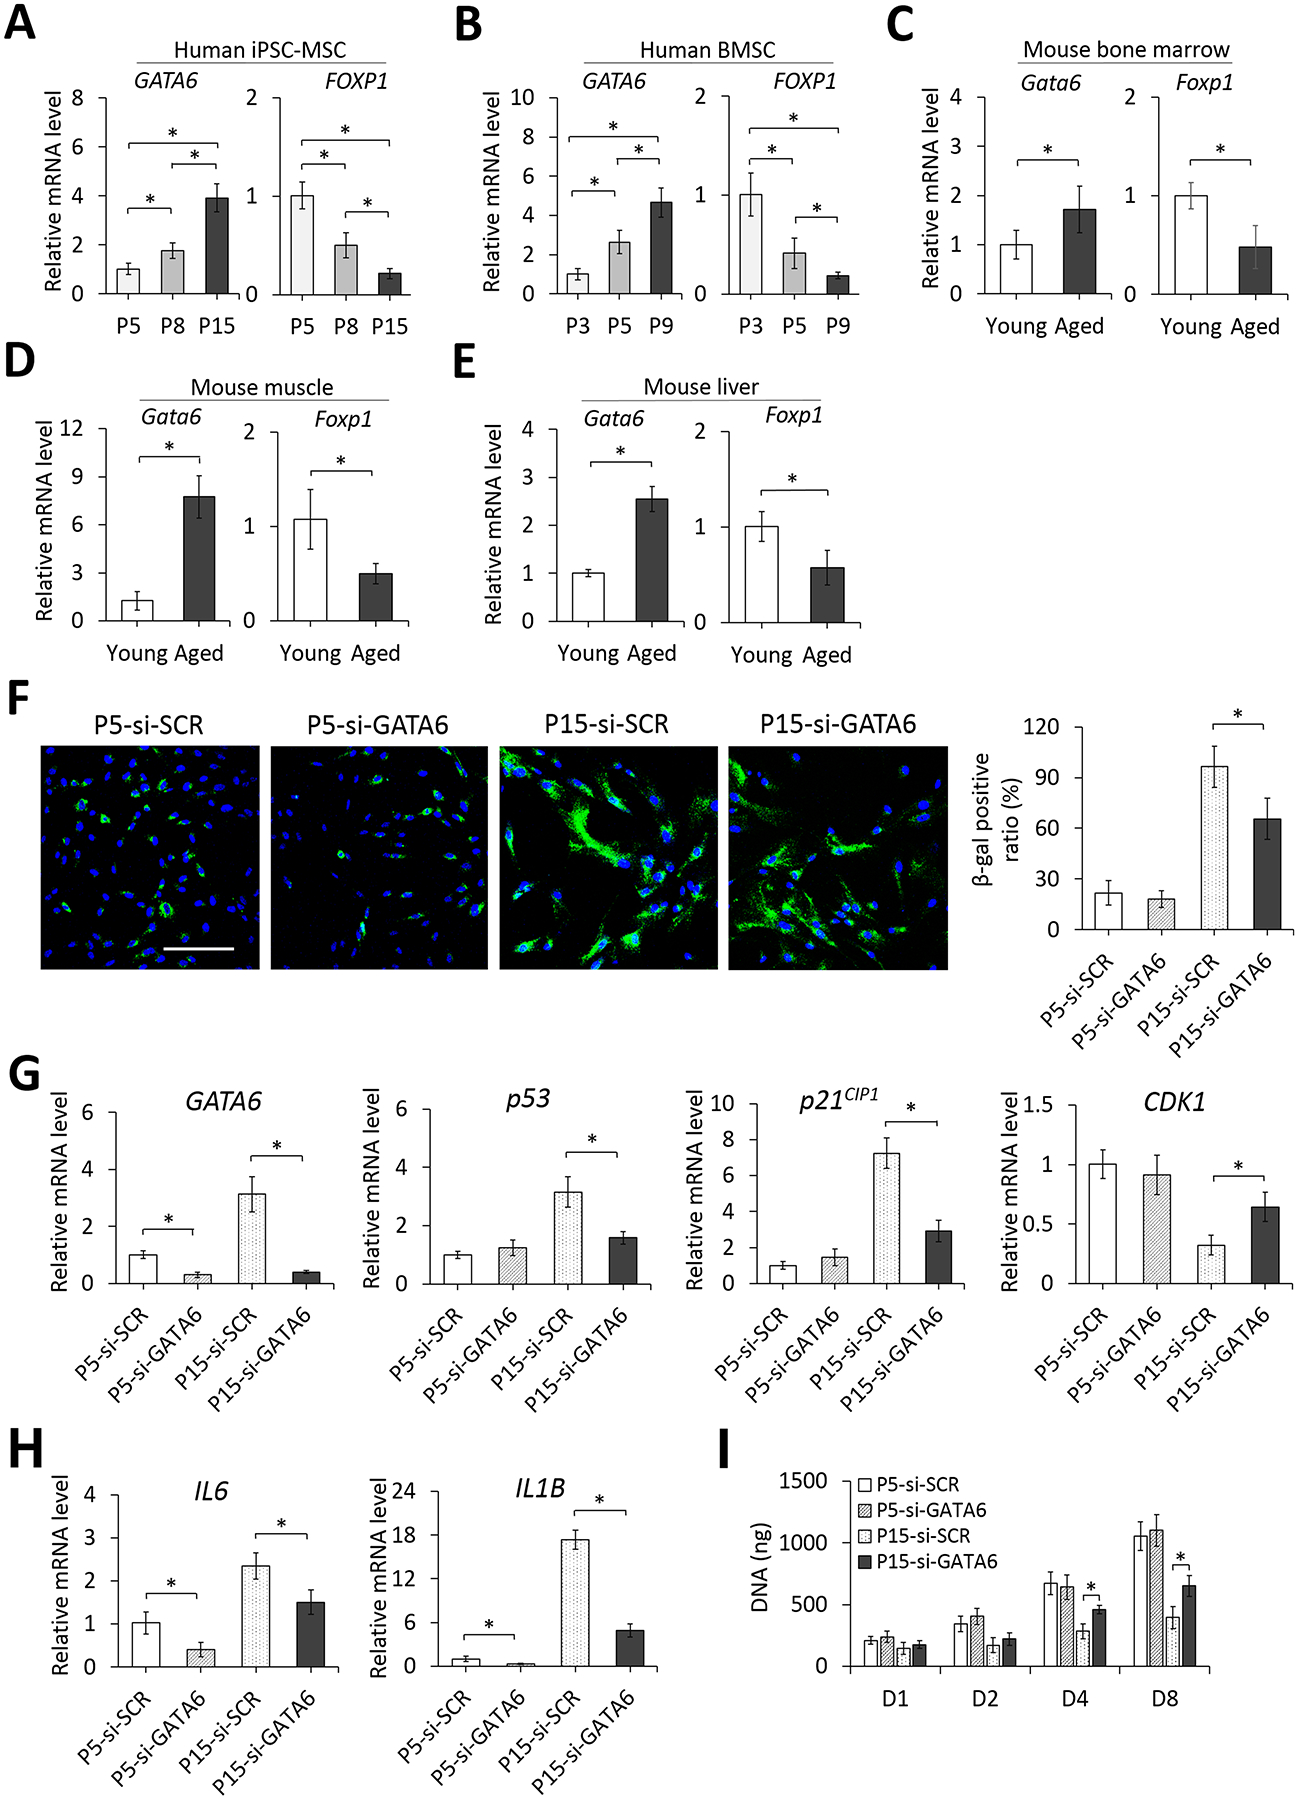
Relative mRNA levels of GATA6 and FOXP1 in cultured human iPSC-MSCs at P5, P8, and P15 (A) and BMSCs at P3, P5, and P9 (B) or cells isolated from bone marrow (C), muscle (D) and liver (E) of young (12-week-old) and aged (74-week-old) mice were analyzed by quantitative RT-PCR. (F) Micrographs and quantification of SA-β-gal staining of early (P5) and late passage (P15) iPSC-MSCs transfected with si-SCR and si-GATA6 siRNA. DAPI stains the nucleus (blue). Scale bar = 100 μm. Quantification results are expressed as the percentage of stained cells. (G) Effects of GATA6 knockdown on expression levels of p53, p21CIP1, and CDK1 in early and late passage iPSC-MSCs analyzed by quantitative RT-PCR. (H) Effects of GATA6 knockdown on expression levels of SASP markers IL6 and IL1B analyzed by quantitative RT-PCR. (I) Effects of GATA6 knockdown on cell proliferation of early and late passage iPSC-MSCs determined by quantification of total DNA content. *p < 0.05; n = 3.
3.5. GATA6 knockdown mitigates cellular senescence of iPSC-MSCs
Effects of GATA6 knockdown on the expression of senescence-related markers in iPSC-MSCs at an early (P5) and late passage (P15) were investigated. For the control group, SA-β-gal staining showed that the ratio of senescent to total cells was increased with cell passage (Figure 5F), suggesting the cell underwent replicative senescence in culture. GATA6 knockdown in cells at the late passage significantly reduced the ratio of senescent to total cells whereas that in cells at the early passage did not. Similarly, GATA6 knockdown markedly decreased the expression of p53 and p21CIP1 and significantly increased the expression of CDK1 in late-passage cells but did not affect early-passage cells (Figure 5G). Other than the effect on cell cycle regulators, GATA6 knockdown significantly downregulated mRNA levels of senescence-associated secretory phenotype (SASP) marker IL6 and IL1B in late-passage as well as early-passage iPSC-MSCs (Figure 5H). Moreover, proliferation of early-passage cells was not affected by GATA6 knockdown but late-passage cells with attenuated GATA6 activity grew significantly faster than control ones after 4 days of culture (Figure 5I). Taken together, these results suggest that GATA6 is a pro-senescence factor and by attenuating GATA6 expression, replicative senescence of cultured MSCs can be mitigated.
3.6. GATA6 negatively regulates activities of downstream sonic hedgehog (SHH) signaling and FOXP1
The functional enrichment analysis of global transcriptome revealed that SHH signaling molecules were significantly upregulated in iPSC-MSCs compared to those in their parental SF-MSCs (Figure 2F, G and Table S7). Using quantitative RT-PCR and western blot analysis, we confirmed the RNA-seq result (Figure 6A and B). To further demonstrate the association between the regulation of SHH signaling molecules and cell aging, we compared cultured cells at different passages or tissue cells harvested from animals at different ages. Results showed that expression levels of SMO and GLI1 in cultured iPSC-MSCs or BMSCs were consistently decreased with increased replicative senescence of the cell (Figure S8A and B). Similarly, expression levels of the signaling molecules in bone marrow, muscle, and liver of aged mice were significantly lower than those of young mice (Figure S8C–E).
Figure 6. Analysis of interaction between identified TFs and signaling molecules.
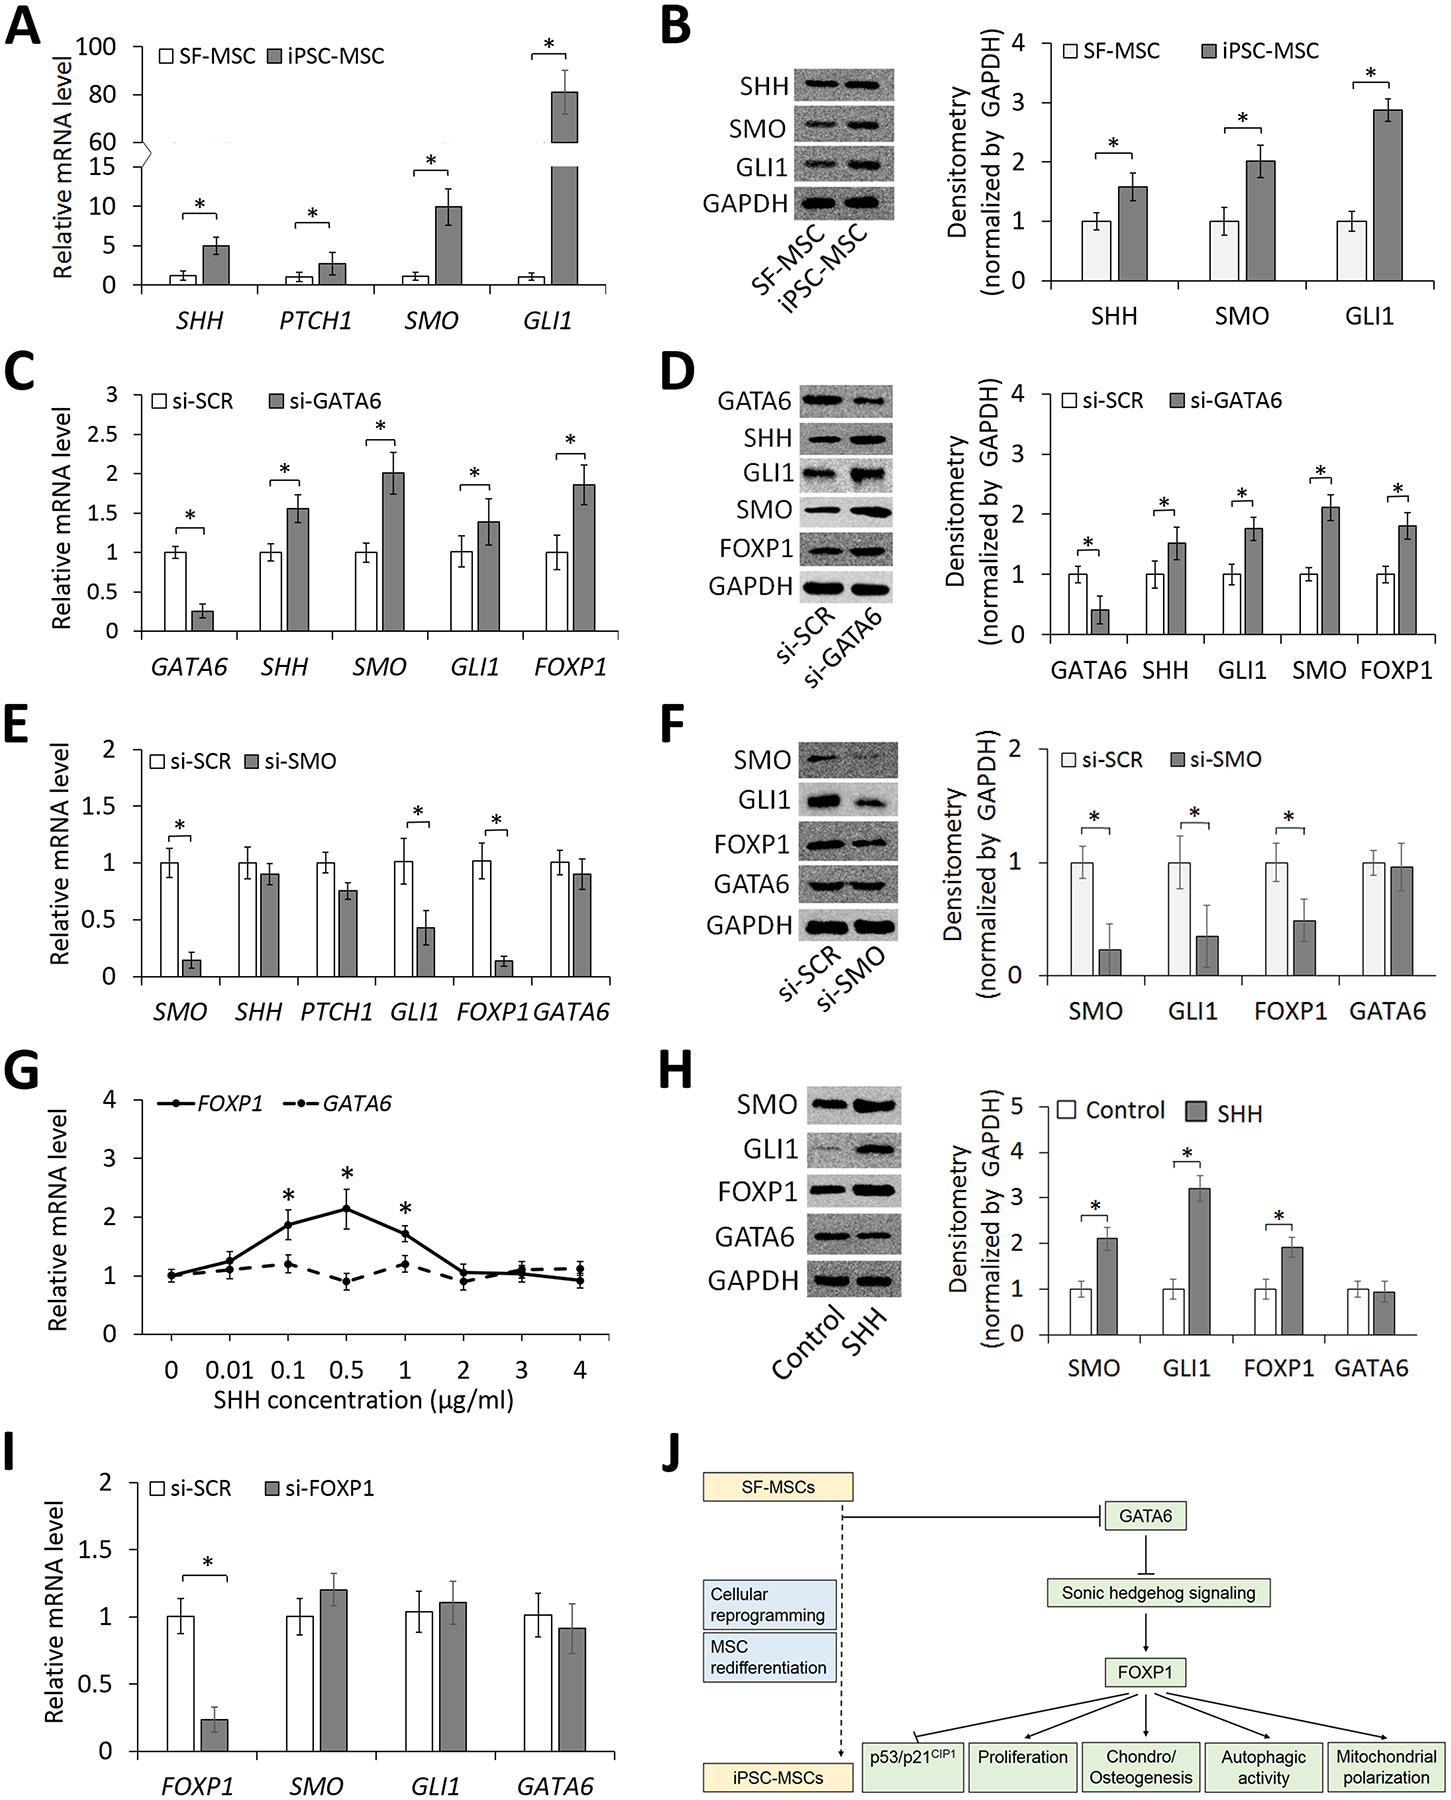
(A) Expression levels of SHH signaling molecules in SF-MSCs and iPSC-MSCs analyzed by quantitative RT-PCR. (B) Western blot analysis of expression of SHH signaling molecules in SF-MSCs and iPSC-MSCs. GAPDH serving as a control. (C) Effects of GATA6 knockdown by siRNA on mRNA expression levels of SHH signaling molecules and FOXP1 in iPSC-MSCs. (D) Western blot analysis of expression of SHH signaling molecules and FOXP1 in iPSC-MSCs with or without GATA6 knockdown. GAPDH used as a loading control. (E) Effects of SMO knockdown by siRNA on mRNA expression levels of SHH signaling molecules, GATA6, and FOXP1 in iPSC-MSCs. (F) Western blot analysis of expression of SHH signaling molecules, GATA6, and FOXP1 in iPSC-MSCs transfected with control or SMO siRNA. GAPDH used as a loading control. (G) Expression levels of FOXP1 and GATA6 responding to varying doses of SHH after 24 h of induction. (H) Western blot analysis of expression of SMO, FOXP1, and GATA6 in iPSC-MSCs treated with SHH at 0.5 μg/ml for 24 h. (I) Quantitative RT-PCR analysis of SHH signaling molecules and GATA6 in iPSC-MSCs with or without FOXP1 knockdown. (J) A schematic diagram illustrating the molecular mechanism underlying rejuvenation of reprogrammed MSCs. *p < 0.05; n = 3.
Having demonstrated that GATA6, FOXP1 and SHH signaling were differentially regulated in iPSC-MSCs, we were interested in further determining the mechanistic relationship between them using the loss-of-function approach. Knockdown of GATA6 resulted in an increase in the expression of the SHH signaling molecule SHH, SMO, and GLI1 as well as FOXP1 (Figure 6C and D), suggesting that GATA6 is an upstream inhibitory regulator of both SHH signaling and FOXP1. When the expression of SMO, a key molecule in the SHH pathway, was repressed, the expression of its downstream molecule GLI1 was decreased as well as that of FOXP1 (Figure 6E and F). Notably, SMO knockdown did not affect the GATA6 expression, confirming GATA6 being an upstream molecule of SHH signaling in the mechanism. We further investigated if the expression levels of GATA6 and FOXP1 respond to the induction dose of SHH. Results showed that in response to the induction by increased doses of SHH and induced activities of downstream SMO and GLI1 (Figure S9), the expression level of FOXP1, but not that of GATA6, followed the typical pattern of dose-dependent response (Figure 6G). Induced by SHH at the dose of 0.5 μg/ml, iPSC-MSCs showed significantly higher expression of FOXP1 but again not that of GATA6 compared to control cells (Figure 6H). With results showing that knocking FOXP1 down affected neither the expression of the SHH signaling molecules SMO and GLI1 nor that of GATA6 (Figure 6I), we confirmed that FOXP1 is a downstream molecule of SHH signaling. Together, our data suggest that GATA6 is a master molecule that regulates SHH signaling to control downstream FOXP1.
4. DISCUSSION
We use cellular reprogramming, a commonly used approach to reverse cell aging, to establish an isogenic young and old cell model for this study. Our results, while agreeing with previous findings in MSC rejuvenation by cellular reprogramming,6, 28 provide insight into how reprogrammed MSCs are regulated molecularly to ameliorate cellular hallmarks of aging.29 Specifically, we have demonstrated that reprogrammed MSCs are younger than their parental non-reprogrammed ones and even younger than juvenile MSCs (Figure S10). Through analysis of RNA-seq to compare global transcriptomic differences between reprogrammed and control SF-MSCs and loss- and gain-of-function assays to screen molecules of interest, we have identified the GATA6/SHH/FOXP1 pathway as a key mechanism that regulates MSC aging and rejuvenation. Our main finding is that for iPSC-MSCs exhibiting characteristics of rejuvenated cells, GATA6 is repressed to upregulate SHH signaling and FOXP1, resulting in attenuation of p53/p21CIP1 activity, increased proliferation, improved autophagic activity and mitochondrial polarization, as well as enhanced chondro/osteogenic differentiation (Figure 6J).
Our results show that cellular reprogramming leads to a reduction in the expression of GATA6, thereby attenuating cell aging-related activities. To determine which of Yamanaka factors is involved in repressing GATA6 in iPSCs, we analyzed GATA6 expression in response to knockdown of the factors and have found that only OCT4 and KLF4 are able to regulate GATA6 activity (Figure S11), consistent with some of previous finding.30–33 GATA6 is involved in the development of mesoderm- and endoderm-derived organs, including heart, liver, and pancreas through synergizing with GATA4.34–36 In addition to the well-recognized role in development, it is also found that GATA6 modulates proliferation and senescence of adult vascular smooth muscle cells by inducing p21Cip1 expression and G1 cell cycle arrest,37 controls renewal of peritoneal macrophages during homeostasis and in response to inflammation,38 and regulates senescence of hepatic stellate cells (HSCs) through coordination with autophagic activity.39 Interestingly, the study by Zhang et al. has shown that GATA6 in HSCs activates JNK1/2 signaling to regulate autophagic activity and mediate p53 upregulation, we did not find that JNK1/2 was involved in GATA6-induced regulation of MSC aging (data not shown). Most importantly, Budovskaya et al. have found that the GATA transcription factors, elt-3, elt-5, and elt-6, play a critical role in the normal aging process of C. elegans. They have demonstrated that the expression of elt-5 and elt-6 increases during aging of the worm to repress the expression of elt-3, which in turn regulates a circuit of genes in control of the lifespan of the organism.40 This finding supports results of our study using a human cell model, which independently identifies GATA6 as an important regulatory molecule of cell aging. Furthermore, a recently published finding has shown the role of GATA4 in the regulation of cellular senescence.41 Considering GATA4 and GATA6 often share common functions in regulating cell activities during development, our findings, which reveal the role of GATA6 in regulating cellular senescence, is new but not surprising. Given that the critical role of GATA6 is in mediating cell aging, it seems promising to use a repressor to regulate GATA6 activity for MSC rejuvenation. We detected the expression of BCOR, a previously identified GATA6 repressor,42 in iPSC-MSCs, SF-MSCs, and iPSCs. Our results showed that the trends of BCOR and GATA6 expression levels among the three types of cells were exactly reversed (Figure S12), suggesting that GATA6 is likely repressed by BCOR.
Another notable finding of this study is that we identify the role of SHH signaling in modulating cellular senescence, proliferation, and the differentiation propensity of iPSC-MSCs. Consistent with our finding, a previous study has reported that activities of SHH signaling molecules decrease with cell aging, and the aging-related decline in SHH signaling integrity leads to loss and dysfunction of endometrial stem cells.43 Our study further reveals that SHH signaling is a downstream pathway regulated by GATA6. Similarly, GATA6 has been shown to negatively regulate SHH signaling during limb bud development of mice by directly binding to the Gli1 promoter or Shh enhancer of cells.44 It is now clear that molecular regulation involving GATA6 and its downstream SHH signaling targets mediates development of mouse limb buds as well as aging-related activities of human stem cells.
The GSEA results reveal that gene sets associated with hedgehog signaling are enriched in iPSC-MSCs relative to SF-MSCs while those associated with adipogenesis are enriched in SF-MSCs relative to iPSC-MSCs, suggesting a potential link between hedgehog signaling and MSC differentiation fate. It has been reported that hedgehog signaling plays an important role in skeletal development and tissue homeostasis. For example, Suh et al. have found that hedgehog signaling plays a conserved role in adipose development and its activation inhibits fat formation in both Drosophila and mouse cells.45 Another study by Fontaine et al. has shown that stimulation of the hedgehog pathway alters adipogenic differentiation of human MSCs by regulating the expression of CCAAT/enhancer-binding protein alpha and PPARG2.46 In addition, SHH signaling has been shown to play a critical role in morphogenesis of developing limb cartilage47 and chondrogenesis of adult cartilage.48 In this study, we have found that reprogrammed MSCs with upregulated hedgehog signaling are less prone to adipogenesis and more to chondro/osteogenesis than control non-reprogrammed cells, indicating that regulation of the activity of SHH signaling controls the differentiation propensity of MSCs.
We have found that expression levels of FOXP1 in reprogrammed MSCs are upregulated by SHH signaling. FOXP1, previously identified as one of the MSC markers,49 has recently been reported as a regulator controlling MSC commitment and senescence associated with skeletal aging.14 Specifically, Li et al. has demonstrated that conditional depletion of Foxp1 in BMSCs leads to an increase in marrow adiposity and a decrease in bone mass and the capacity of MSC self-renewal, consistent with our current findings. Interestingly, they have discovered that FOXP1 directly represses p16INK4A to mitigate BMSC senescence whereas we have found that instead of p16INK4A, FOXP1 targets p53/p21CIP1 to regulate cellular senescence of iPSC-MSCs. The discrepancy on which of the p53 and p16INK4A pathways is engaged in the regulation of cellular senescence may be explained by the use of different MSC types.50
Differences in the growth rate between SF-MSCs and iPSC-MSCs shown in this study, consistent with the previous finding,10, 51 is likely the result of increased telomerase activity and longer telomere length in iPSC-MSCs compared to those in their parental SF-MSCs. We have found that telomerase reverse transcriptase (TERT) expression and telomerase activity in cells are significantly increased after cellular reprogramming but reduced to undetectable levels after redifferentiation into MSCs (Figure S13). The finding is in agreement with the previously published observation that iPSC-derived T cells possess longer telomeres than their parental cells.52 The reduction in TERT expression and telomerase activity in iPSC-MSCs may be considered beneficial for enhancing the safety of cell therapies using iPSCs since the ectopic expression of TERT is associated with the risk of tumorigenesis.53
Our results show that when induced for lineage-specific differentiation, iPSC-MSCs increasingly undergo chondrogenesis and osteogenesis but not adipogenesis compared to parental SF-MSCs, which partially agrees with a previously published finding that differentiation of all three lineages of iPSC-MSCs is upregulated compared to that of parental SF-MSCs.28 The discrepancy in the findings between the studies may result from variation in cell properties associated with approaches used to generate iPSCs and iPSC-MSCs; specifically, we used an integration-free approach to generate iPSCs and a commercial kit54 to prepare iPSC-MSCs whereas Zheng et al. used an integrating reprogramming method to generate iPSCs and an in-house protocol to create iPSC-MSCs. Our results are also different from previous ones that show iPSC-MSCs are less effectively inducible for chondrogenesis and osteogenesis than their parental BMSCs.6, 17 We speculate that the discrepancy between our and their results may be due to differences in the epigenetic memory of parental cells retained in iPSCs, which biasedly affects the redifferentiation propensity.55 Since the source of SF-MSCs is synovium that is derived from the same developmental origin as articular cartilage,56 it is expected that reprogrammed SF-MSCs are more prone to undergoing chondrogenesis than BMSCs.
A characteristic of aging MSCs is that the differentiation propensity of the cell is biased toward the adipo-lineage. It has been reported that cell aging promotes adipogenesis and suppresses osteogenesis of mouse MSCs,23 and adipose tissue volume in bone marrow is increased with age and/or diseases such as osteoporosis.22 Our results showing that reprogrammed adult tissue-derived MSCs become pro-osteogenic/pro-chondrogenic but not pro-adipogenic suggest that the cells may gain a “rejuvenated” status. This interpretation is also supported by our result that the SASP, a hallmark of aging cells,57 is mitigated in iPSC-MSCs. Specifically, our functional enrichment analysis has revealed that expression levels of inflammation- and senescence-related markers, including but not limited to IL6, IL1A, IL1B, CCL2, CXCL1, CXCL2, and CXCL6, in iPSC-MSCs are significantly reduced compared to those in SF-MSCs (Table S7), indicating that iPSC-MSCs are rejuvenated MSCs. Moreover, our result of MSC rejuvenation is also supported by a previously published finding that has identified 60 genes related to MSC aging.58 Among these genes, 56 of them are found differentially expressed between SF-MSCs and iPSC-MSCs in our result of RNA-seq analysis (Table S9).
5. CONCLUSION
In this study, we have demonstrated that SF-MSCs undergo substantial changes in properties and functions as a result of cellular reprogramming. These changes in iPSC-MSCs collectively indicate amelioration of cell aging. Although iPSC-MSCs seem not to gain advantage on immunomodulation, enhancement in the capacity of proliferation and osteogenesis/chondrogenesis is considered an advantage of using the cellular reprogramming approach to improve MSC properties for regenerative medicine. Most significantly, we have used the two isogenic SF-MSC and iPSC-MSC lines as a model to identify the GATA6/SHH/FOXP1 signaling pathway as an underlying mechanism that controls cell aging-related activities. We believe that our findings reported in this study help improve the understanding of MSC aging.
Supplementary Material
Figure S1. Generation and characterization of transgene-free iPSCs. (A) Schematic diagram illustrating the timeline of establishment of reprogrammed cell lines. (B) Morphologic changes of SF-MSCs during cellular reprogramming. (C) Identification of iPSC colonies by immunofluorescent staining detecting CD44 and TRA-1–60. (D) Immunofluorescent staining to detect pluripotency markers of NANOG, OCT4, SOX2, SSEA4, and TRA-1–60 in iPSC lines. DAPI stains the nucleus (blue). (E) Flow cytometry showing the expression of human pluripotent stem cell-specific markers (pink) and matched isotype controls (blue) in iPSC lines. (F) H&E staining of teratoma derived from a representative iPSC line. Gastro-intestine-like structure is shown in the left panel. Cartilage is shown in the middle panel. Neuronal rosette is shown in the right panel. (G) A representative iPSC line exhibits a normal diploid 46, XY karyotype. (H) Genomic DNA of 3 iPSC lines at Passage 15 and 3 iPSC-MSC lines at Passage 10. Genomic DNA of human SF-MSCs served as a negative control. DNA from SF-MSCs transfected with the reprogramming plasmids (4 days after transfection) was used as positive control. The letter “T” indicates that transgene-specific primers were used for PCR. (I) Expression of transgenes and endogenous pluripotency genes in 3 iPSC lines at Passage 15 and 3 iPSC-MSC lines at Passage 10. Total RNA of non-transfected SF-MSCs and SF-MSCs transfected with the reprogramming plasmids (4 days after transfection) was used as negative and positive control, respectively. Scale bar = 200 μm. n = 3.
Figure S2. Generation and characterization of iPSC-MSCs. (A) Images of phase-contrast microscopy revealing fibroblast-like morphology of iPSC-MSCs and SF-MSCs. (B) Expression of surface markers on SF-MSCs, iPSCs, and iPSC-MSCs. Blue histograms represent isotype controls. Pink histograms represent surface markers of interest. (C) Growth kinetics of iPSC-MSCs and SF-MSCs in long-term culture. (D) Immunomodulatory effects of SF-MSCs and iPSC-MSCs on proliferation of phytohaemagglutinin (PHA)-stimulated peripheral blood mononuclear cells (PBMCs), as determined by flow cytometric analysis. *p < 0.05; n = 3. NS: not significant. Scale bar = 200 μm.
Figure S3. Teratoma formation in severe combined immunodeficiency (SCID) mice. (A) A teratoma was formed 4–5 weeks after iPSC injection in a SCID mouse. (B) No teratoma was formed after iPSC-MSC injection in SCID mice. Left: Gross images of teratoma growth. Right: Micro CT images of teratoma growth. n = 3.
Figure S4. Lineage-specific differentiation of SF-MSCs and iPSC-MSCs. SF-MSCs and iPSC-MSCs were induced for chondrogenesis (A-C), adipogenesis (D-F), or osteogenesis (G-K) for 21 days. Alcian blue staining (A), quantification of GAG production (B), and relative mRNA expression levels of cartilage-associated markers (C) for evaluation of chondrogenesis. Oil red O staining (D), quantification of lipid droplets (E), and relative mRNA levels of fat-associated markers (F) for evaluation of adipogenesis. ALP staining (G) and activity (H), Alizarin red S staining (I), quantification of calcium deposition (J), and relative mRNA levels of bone-associated markers (K) for evaluation of osteogenesis. *p < 0.05; n = 3. Scale bar = 200 μm.
Figure S5. MA plots showing pairwise differential analysis of RNA-seq. The average normalized counts across all samples vs log2 fold changes for the indicated pairwise comparison. (A) SF-MSC vs iPSC-MSC. (B) SF-MSC vs iPSC. (C) iPSC-MSC vs iPSC. Dashed lines indicate 2-fold changes and red points have adjusted. n = 3.
Figure S6. The effects of 10 TF knockdown on multi-lineage differentiation of iPSC-MSCs. Osteogenesis, chondrogenesis, and adipogenesis of iPSC-MSCs determined by mRNA expression levels of CBFA1 and ALP, SOX9 and COL2, and PPARG2 and LPL, respectively, in response to knockdown of TF ETV4 (A), FOXA3 (B), FOXJ1 (C), NR1I2 (D), SALL3 (E), SALL4 (F), SOX2 (G), TFAP2C (H), EBF1 (I), and PITX1 (J). *p < 0.05; n = 3.
Figure S7. Effects of knockdown or overexpression of GATA6 and FOXP1 on extents of global DNA methylation and levels of SIRT1 in iPSC-MSCs. Relative 5mC and 5hmC levels (A) and expression levels of SIRT1 (B) of iPSC-MSCs transfected with si-SCR, si-GATA6, or si-FOXP1, detected by ELISA and western blotting analysis, respectively. Relative 5mC and 5hmC levels (C) and expression levels of SIRT1 (D) of iPSC-MSCs transduced with control LV-mCherry, LV-GATA6, or LV-FOXP1. *p < 0.05; n = 3. LV: lentivirus vector.
Figure S8. Relative expression levels of SHH signaling molecules in cells harvested from culture at different passages or tissues of different age mice. Cultured human iPSC-MSCs at P5, P8, and P15 (A) and BMSCs at P3, P5, and P9 (B) or cells isolated from bone marrow (C), muscle (D) and liver (E) of young (12-week-old) and aged (74-week-old) mice were prepared and analyzed by quantitative RT-PCR. *p < 0.05; n = 3.
Figure S9. Curves of SMO and GLI1 expression and SHH induction. (A) Expression levels of SMO in iPSC-MSCs in response to varying doses of SHH after 24 h of induction. (B) Expression levels of GLI1 in iPSC-MSCs in response to varying doses of SHH after 24 h of induction. *p < 0.05; n = 3.
Figure S10. Comparison of cellular senescence among SF-MSCs, iPSC-MSCs, and juvenile MSCs. (A) Images and quantification of western blots detecting p53, p21CIP1, and CDK1 expression in SF-MSCs and iPSC-MSCs compared to young MSC controls harvested from synovial fluid of 3 human donors between 14 and 17 years of age. GAPDH was used as a loading control. (B) Micrographs and quantification of SA-β-gal staining of SF-MSCs, iPSC-MSCs, and young MSC controls. DAPI stains the nucleus (blue). Scale bar = 100 μm. Quantification results are expressed as the percentage of stained cells.
Figure S11. Effects of knockdown of Yamanaka factors on GATA6 expression. Expression levels of GATA6 transcripts in iPSCs in response to knockdown of OCT4, SOX2, KLF4, or c-MYC analyzed by quantitative RT-PCR. *p < 0.05; n = 3.
Figure S12. Expression levels of BCOR and GATA6 in SF-MSCs, iPSCs, and iPSC-MSCs. Expression levels of BCOR and GATA6 transcripts in SF-MSCs, iPSCs, and iPSC-MSCs analyzed by quantitative RT-PCR. *p < 0.05; n = 3.
Figure S13. Analysis of telomerase activity, TERT expression, and relative telomere length in SF-MSCs, iPSCs, and iPSC-MSCs. (A) Telomerase activity levels in attomoles of product per microgram of protein compared. (B) Expression levels of TERT in different cells determined by quantitative RT-PCR. (C) Relative telomere length of cells shown as the ratio of copy number of telomere repeats to single control gene. *p < 0.05; n = 3.
Table S1. Detailed information of antibodies used in this study
Table S2. Primer sequences for analysis of quantitative RT-PCR
Table S5. Hallmark gene sets obtained through gene set enrichment analysis
Table S3. Genes differentially expressed between SF-MSCs, iPSCs, and iPSC-MSCs
Table S4. Differentially expressed genes included in the heatmap of Figure 2B
Table S6. Differentially expressed hallmark gene sets in SF-MSCs vs iPSC-MSCs
Table S9. Expression levels of MSC aging-related genes in SF-MSCs and iPSC-MSCs
Table S7. Details of hallmark gene sets shown in Figure 2G
Table S8. Expression levels of transcription factors in SF-MSCs, iPSCs, and iPSC-MSCs
ACKNOWLEDGMENTS
Research reported in this publication was supported by the National Institute of Arthritis and Musculoskeletal and Skin Diseases of the National Institutes of Health under Award Number R01 AR064803. The content is solely the responsibility of the authors and does not necessarily represent the official views of the National Institutes of Health.
Footnotes
CONFLICTS OF INTEREST
W-J.L. declared ownership interest with Microsoft; Costco; TSMC; Apple; Marriott. All of the other authors declared no potential conflicts of interest.
Data Availability Statement
The data that support the findings of this study are available on request from the corresponding author.
REFERENCES
- 1.Yener Ilce B, Cagin U, Yilmazer A. Cellular reprogramming: A new way to understand aging mechanisms. Wiley Interdisciplinary Reviews: Dev Biol. 2018;7(2):e308. [DOI] [PubMed] [Google Scholar]
- 2.Nishimura K, and Takahashi J. Therapeutic application of stem cell technology toward the treatment of Parkinson’s disease. Biol Pharm Bull. 2013;36(2):171–175. [DOI] [PubMed] [Google Scholar]
- 3.Ochalek A, Nemes C, Varga E, et al. Establishment of induced pluripotent stem cell (iPSC) line from a 57-year old patient with sporadic Alzheimer’s disease. Stem Cell Res. 2016;17 (1):72–74. [DOI] [PubMed] [Google Scholar]
- 4.Sarkar TJ, Quarta M, Mukherjee S, et al. Transient non-integrative nuclear reprogramming promotes multifaceted reversal of aging in human cells. Nat Commun. 2020;11:1545. [DOI] [PMC free article] [PubMed] [Google Scholar]
- 5.Suhr ST, Chang EA, Rodriguez RM, et al. Telomere dynamics in human cells reprogrammed to pluripotency. PloS One. 2009;4(12):e8124. [DOI] [PMC free article] [PubMed] [Google Scholar]
- 6.Frobel J, Hemeda H, Lenz M, et al. Epigenetic rejuvenation of mesenchymal stromal cells derived from induced pluripotent stem cells. Stem Cell Reports. 2014;3(3):414–422. [DOI] [PMC free article] [PubMed] [Google Scholar]
- 7.Prigione A, Fauler B, Lurz R, et al. The senescence‐related mitochondrial/oxidative stress pathway is repressed in human induced pluripotent stem cells. Stem Cells. 2010;28(4):721–733. [DOI] [PubMed] [Google Scholar]
- 8.Spitzhorn LS, Megges M, Wruck W, et al. Human iPSC-derived MSCs (iMSCs) from aged individuals acquire a rejuvenation signature. Stem Cell Res Ther. 2019;10(1):100. [DOI] [PMC free article] [PubMed] [Google Scholar]
- 9.Ghule PN, Medina R, Lengner CJ, et al. Reprogramming the pluripotent cell cycle: restoration of an abbreviated G1 phase in human induced pluripotent stem (iPS) cells. J Cell Physiol. 2011;226(5):1149–1156. [DOI] [PMC free article] [PubMed] [Google Scholar]
- 10.Ohmine S, Squillace KA, Hartjes KA, et al. Reprogrammed keratinocytes from elderly type 2 diabetes patients suppress senescence genes to acquire induced pluripotency. Aging (Albany NY). 2012;4(1):60. [DOI] [PMC free article] [PubMed] [Google Scholar]
- 11.Lin K, Hsin H, Libina N, et al. Regulation of the Caenorhabditis elegans longevity protein DAF-16 by insulin/IGF-1 and germline signaling. Nat Genet. 2001;28(2):139–145. [DOI] [PubMed] [Google Scholar]
- 12.Giannakou ME, Goss M, Jünger MA, et al. Long-lived Drosophila with overexpressed dFOXO in adult fat body. Science. 2004;305(5682):361–361. [DOI] [PubMed] [Google Scholar]
- 13.Xiong X, Tao R, DePinho RA, et al. The autophagy-related gene 14 (Atg14) is regulated by forkhead box O transcription factors and circadian rhythms and plays a critical role in hepatic autophagy and lipid metabolism. J Biol Chem. 2012;287(46):39107–39114. [DOI] [PMC free article] [PubMed] [Google Scholar]
- 14.Li H, Liu P, Xu S, et al. FOXP1 controls mesenchymal stem cell commitment and senescence during skeletal aging. J Clin Invest. 2017;127(4):1241–1253. [DOI] [PMC free article] [PubMed] [Google Scholar]
- 15.Bernard D, Gosselin K, Monte D, et al. Involvement of Rel/nuclear factor-κB transcription factors in keratinocyte senescence. Cancer Res. 2004;64(2):472–481. [DOI] [PubMed] [Google Scholar]
- 16.Ma S, Wang C, Hao Y. B Cell Dysfunction Associated With Aging and Autoimmune Diseases. Front Immunol. 2019;10:318. [DOI] [PMC free article] [PubMed] [Google Scholar]
- 17.Diederichs S, Tuan RS. Functional comparison of human-induced pluripotent stem cell- derived mesenchymal cells and bone marrow-derived mesenchymal stromal cells from the same donor. Stem Cells Dev. 2014;23(14):1594–1610. [DOI] [PMC free article] [PubMed] [Google Scholar]
- 18.Morito T, Muneta T, Hara K, et al. Synovial fluid-derived mesenchymal stem cells increase after intra-articular ligament injury in humans. Rheumatology. 2008;47(8):1137–1143. [DOI] [PubMed] [Google Scholar]
- 19.Brown PT, Squire MW, Li W-J. Characterization and evaluation of mesenchymal stem cells derived from human embryonic stem cells and bone marrow. Cell Tissue Res. 2014; 358(1): 149–164. [DOI] [PMC free article] [PubMed] [Google Scholar]
- 20.Soleimani M, Nadri S. A protocol for isolation and culture of mesenchymal stem cells from mouse bone marrow. Nat Protoc. 2009;4(1):102–106. [DOI] [PubMed] [Google Scholar]
- 21.Yu J, Hu K, Smuga-Otto K, et al. Human induced pluripotent stem cells free of vector and transgene sequences. Science. 2009;324(5928):797–801. [DOI] [PMC free article] [PubMed] [Google Scholar]
- 22.Justesen J, Stenderup K, Ebbesen E, et al. Adipocyte tissue volume in bone marrow is increased with aging and in patients with osteoporosis. Biogerontology. 2001;2(3):165–171. [DOI] [PubMed] [Google Scholar]
- 23.Moerman EJ, Teng K, Lipschitz DA, et al. Aging activates adipogenic and suppresses osteogenic programs in mesenchymal marrow stroma/stem cells: the role of PPAR‐γ2 transcription factor and TGF‐β/BMP signaling pathways. Aging Cell. 2004;3(6):379–389. [DOI] [PMC free article] [PubMed] [Google Scholar]
- 24.Trifunovic A, Larsson NG. Mitochondrial dysfunction as a cause of ageing. J Intern Med. 2008;263(2):167–178. [DOI] [PubMed] [Google Scholar]
- 25.Camuzard O, Santucci-Darmanin S, Breuil V, et al. Sex-specific autophagy modulation in osteoblastic lineage: a critical function to counteract bone loss in female. Oncotarget. 2016;7(41):66416–66428. [DOI] [PMC free article] [PubMed] [Google Scholar]
- 26.Alcendor RR, Gao S, Zhai P, et al. Sirt1 regulates aging and resistance to oxidative stress in the heart. Circ Res. 2007;100(10):1512–1521. [DOI] [PubMed] [Google Scholar]
- 27.Talens RP, Christensen K, Putter H, et al. Epigenetic variation during the adult lifespan: cross‐sectional and longitudinal data on monozygotic twin pairs. Aging cell. 2012;11(4):694–703. [DOI] [PMC free article] [PubMed] [Google Scholar]
- 28.Zheng YL, Sun YP, Zhang H, et al. Mesenchymal stem cells obtained from synovial fluid mesenchymal stem cell-derived induced pluripotent stem cells on a Matrigel coating exhibited enhanced proliferation and differentiation potential. PloS One. 2015; 10(12): e0144226. [DOI] [PMC free article] [PubMed] [Google Scholar]
- 29.López-Otín C, Blasco MA, Partridge L, et al. The hallmarks of aging. Cell. 2013;153 (6):1194–1217. [DOI] [PMC free article] [PubMed] [Google Scholar]
- 30.Babaie Y, Herwig R, Greber B, et al. Analysis of Oct4‐dependent transcriptional networks regulating self‐renewal and pluripotency in human embryonic stem cells. Stem cells. 2007;25(2):500–510. [DOI] [PubMed] [Google Scholar]
- 31.Greber B, Lehrach H, Adjaye J. Silencing of core transcription factors in human EC cells highlights the importance of autocrine FGF signaling for self-renewal. BMC Dev Biol. 2007;7:46. [DOI] [PMC free article] [PubMed] [Google Scholar]
- 32.Aksoy I, Giudice V, Delahaye E, et al. Klf4 and Klf5 differentially inhibit mesoderm and endoderm differentiation in embryonic stem cells. Nat Commun. 2014;5:1–15. [DOI] [PubMed] [Google Scholar]
- 33.Smith KN, Singh AM, Dalton S. Myc represses primitive endoderm differentiation in pluripotent stem cells. Cell stem cell. 2010;7(3):343–354. [DOI] [PMC free article] [PubMed] [Google Scholar]
- 34.Xin M, Davis CA, Molkentin JD, et al. A threshold of GATA4 and GATA6 expression is required for cardiovascular development. Proc Natl Acad Sci. 2006;103(30):11189–11194. [DOI] [PMC free article] [PubMed] [Google Scholar]
- 35.Xuan S, Sussel L. GATA4 and GATA6 regulate pancreatic endoderm identity through inhibition of hedgehog signaling. Development. 2016;143(5):780–786. [DOI] [PMC free article] [PubMed] [Google Scholar]
- 36.Zhao R, Watt AJ, Li J, et al. GATA6 is essential for embryonic development of the liver but dispensable for early heart formation. Mol Cell Biol. 2005;25(7):2622–2631. [DOI] [PMC free article] [PubMed] [Google Scholar]
- 37.Perlman H, Suzuki E, Simonson M, et al. GATA-6 Induces p21Cip1 Expression and G1 Cell Cycle Arrest. J Biol Chem. 1998;273(22):13713–13718. [DOI] [PubMed] [Google Scholar]
- 38.Rosas M, Davies LC, Giles PJ, et al. The transcription factor Gata6 links tissue macrophage phenotype and proliferative renewal. Science. 2014;344(6184):645–648. [DOI] [PMC free article] [PubMed] [Google Scholar]
- 39.Zhang Z, Yao Z, Zhao S, et al. Interaction between autophagy and senescence is required for dihydroartemisinin to alleviate liver fibrosis. Cell Death Dis. 2017;8(6):e2886–e2886. [DOI] [PMC free article] [PubMed] [Google Scholar]
- 40.Budovskaya YV, Wu K, Southworth LK, et al. An elt-3/elt-5/elt-6 GATA transcription circuit guides aging in C. elegans. Cell. 2008;134(2):291–303. [DOI] [PMC free article] [PubMed] [Google Scholar]
- 41.Kang C, Xu Q, Martin TD, et al. The DNA damage response induces inflammation and senescence by inhibiting autophagy of GATA4. Science. 2015:349(6255): aaa5612. [DOI] [PMC free article] [PubMed] [Google Scholar]
- 42.Cooper S, Brockdorff N. Genome-wide shRNA screening to identify factors mediating Gata6 repression in mouse embryonic stem cells. Development. 2013;140(19):4110–4115. [DOI] [PMC free article] [PubMed] [Google Scholar]
- 43.Cho A, Park S-R, Kim S-R, et al. An Endogenous Anti-aging Factor, Sonic Hedgehog, Suppresses Endometrial Stem Cell Aging through SERPINB2. Mol Ther. 2019;27(7):1286–1298 [DOI] [PMC free article] [PubMed] [Google Scholar]
- 44.Kozhemyakina E, Ionescu A, Lassar AB. GATA6 is a crucial regulator of Shh in the limb bud. PLoS Genet. 2014;10(1):e1004072. [DOI] [PMC free article] [PubMed] [Google Scholar]
- 45.Suh JM, Gao X, McKay J, et al. Hedgehog signaling plays a conserved role in inhibiting fat formation. Cell Metab. 2006;3(1):25–34. [DOI] [PubMed] [Google Scholar]
- 46.Fontaine C, Cousin W, Plaisant M, et al. Hedgehog signaling alters adipocyte maturation of human mesenchymal stem cells. Stem Cells. 2008;26(4):1037–1046. [DOI] [PubMed] [Google Scholar]
- 47.Laufer E, Nelson CE, Johnson RL, et al. Sonic hedgehog and Fgf-4 act through a signaling cascade and feedback loop to integrate growth and patterning of the developing limb bud. Cell. 1994;79(6):993–1003. [DOI] [PubMed] [Google Scholar]
- 48.Enomoto‐Iwamoto M, Nakamura T, Aikawa T, et al. Hedgehog proteins stimulate chondrogenic cell differentiation and cartilage formation. J Bone Miner Res. 2000; 15(9):1659–1668. [DOI] [PubMed] [Google Scholar]
- 49.Kubo H, Shimizu M, Taya Y, et al. Identification of mesenchymal stem cell (MSC)‐ transcription factors by microarray and knockdown analyses, and signature molecule‐marked MSC in bone marrow by immunohistochemistry. Genes Cells. 2009;14(3):407–424. [DOI] [PubMed] [Google Scholar]
- 50.Campisi J, di Fagagna FdA. Cellular senescence: when bad things happen to good cells. Nat Rev Mol Cell Biol. 2007;8(9):729–740. [DOI] [PubMed] [Google Scholar]
- 51.Lapasset L, Milhavet O, Prieur A, et al. Rejuvenating senescent and centenarian human cells by reprogramming through the pluripotent state. Genes Dev. 2011;25(21):2248–2253. [DOI] [PMC free article] [PubMed] [Google Scholar]
- 52.Nishimura T, Kaneko S, Kawana-Tachikawa A, et al. Generation of rejuvenated antigen- specific T cells by reprogramming to pluripotency and redifferentiation. Cell stem cell. 2013;12(1), 114–126. [DOI] [PubMed] [Google Scholar]
- 53.Khattar E, Kumar P, Liu CY, et al. Telomerase reverse transcriptase promotes cancer cell proliferation by augmenting tRNA expression. J Clin Invest. 2016;126(10):4045–4060. [DOI] [PMC free article] [PubMed] [Google Scholar]
- 54.Liang Q, Monetti C, Shutova MV, et al. Linking a cell-division gene and a suicide gene to define and improve cell therapy safety. Nature. 2018;563(7733):701–704. [DOI] [PubMed] [Google Scholar]
- 55.Kim K, Doi A, Wen B, et al. Epigenetic memory in induced pluripotent stem cells. Nature. 2010;467(7313):285–290. [DOI] [PMC free article] [PubMed] [Google Scholar]
- 56.Roelofs AJ, Zupan J, Riemen AH, et al. Joint morphogenetic cells in the adult mammalian synovium. Nat Commun. 2017;8:15040. [DOI] [PMC free article] [PubMed] [Google Scholar]
- 57.Lopes-Paciencia S, Saint-Germain E, Rowell M-C, et al. The senescence-associated secretory phenotype and its regulation. Cytokine. 2019;117:15–22. [DOI] [PubMed] [Google Scholar]
- 58.Alves H, Van Ginkel J, Groen N, et al. A mesenchymal stromal cell gene signature for donor age. PloS one. 2012;7:e42908. [DOI] [PMC free article] [PubMed] [Google Scholar]
Associated Data
This section collects any data citations, data availability statements, or supplementary materials included in this article.
Supplementary Materials
Figure S1. Generation and characterization of transgene-free iPSCs. (A) Schematic diagram illustrating the timeline of establishment of reprogrammed cell lines. (B) Morphologic changes of SF-MSCs during cellular reprogramming. (C) Identification of iPSC colonies by immunofluorescent staining detecting CD44 and TRA-1–60. (D) Immunofluorescent staining to detect pluripotency markers of NANOG, OCT4, SOX2, SSEA4, and TRA-1–60 in iPSC lines. DAPI stains the nucleus (blue). (E) Flow cytometry showing the expression of human pluripotent stem cell-specific markers (pink) and matched isotype controls (blue) in iPSC lines. (F) H&E staining of teratoma derived from a representative iPSC line. Gastro-intestine-like structure is shown in the left panel. Cartilage is shown in the middle panel. Neuronal rosette is shown in the right panel. (G) A representative iPSC line exhibits a normal diploid 46, XY karyotype. (H) Genomic DNA of 3 iPSC lines at Passage 15 and 3 iPSC-MSC lines at Passage 10. Genomic DNA of human SF-MSCs served as a negative control. DNA from SF-MSCs transfected with the reprogramming plasmids (4 days after transfection) was used as positive control. The letter “T” indicates that transgene-specific primers were used for PCR. (I) Expression of transgenes and endogenous pluripotency genes in 3 iPSC lines at Passage 15 and 3 iPSC-MSC lines at Passage 10. Total RNA of non-transfected SF-MSCs and SF-MSCs transfected with the reprogramming plasmids (4 days after transfection) was used as negative and positive control, respectively. Scale bar = 200 μm. n = 3.
Figure S2. Generation and characterization of iPSC-MSCs. (A) Images of phase-contrast microscopy revealing fibroblast-like morphology of iPSC-MSCs and SF-MSCs. (B) Expression of surface markers on SF-MSCs, iPSCs, and iPSC-MSCs. Blue histograms represent isotype controls. Pink histograms represent surface markers of interest. (C) Growth kinetics of iPSC-MSCs and SF-MSCs in long-term culture. (D) Immunomodulatory effects of SF-MSCs and iPSC-MSCs on proliferation of phytohaemagglutinin (PHA)-stimulated peripheral blood mononuclear cells (PBMCs), as determined by flow cytometric analysis. *p < 0.05; n = 3. NS: not significant. Scale bar = 200 μm.
Figure S3. Teratoma formation in severe combined immunodeficiency (SCID) mice. (A) A teratoma was formed 4–5 weeks after iPSC injection in a SCID mouse. (B) No teratoma was formed after iPSC-MSC injection in SCID mice. Left: Gross images of teratoma growth. Right: Micro CT images of teratoma growth. n = 3.
Figure S4. Lineage-specific differentiation of SF-MSCs and iPSC-MSCs. SF-MSCs and iPSC-MSCs were induced for chondrogenesis (A-C), adipogenesis (D-F), or osteogenesis (G-K) for 21 days. Alcian blue staining (A), quantification of GAG production (B), and relative mRNA expression levels of cartilage-associated markers (C) for evaluation of chondrogenesis. Oil red O staining (D), quantification of lipid droplets (E), and relative mRNA levels of fat-associated markers (F) for evaluation of adipogenesis. ALP staining (G) and activity (H), Alizarin red S staining (I), quantification of calcium deposition (J), and relative mRNA levels of bone-associated markers (K) for evaluation of osteogenesis. *p < 0.05; n = 3. Scale bar = 200 μm.
Figure S5. MA plots showing pairwise differential analysis of RNA-seq. The average normalized counts across all samples vs log2 fold changes for the indicated pairwise comparison. (A) SF-MSC vs iPSC-MSC. (B) SF-MSC vs iPSC. (C) iPSC-MSC vs iPSC. Dashed lines indicate 2-fold changes and red points have adjusted. n = 3.
Figure S6. The effects of 10 TF knockdown on multi-lineage differentiation of iPSC-MSCs. Osteogenesis, chondrogenesis, and adipogenesis of iPSC-MSCs determined by mRNA expression levels of CBFA1 and ALP, SOX9 and COL2, and PPARG2 and LPL, respectively, in response to knockdown of TF ETV4 (A), FOXA3 (B), FOXJ1 (C), NR1I2 (D), SALL3 (E), SALL4 (F), SOX2 (G), TFAP2C (H), EBF1 (I), and PITX1 (J). *p < 0.05; n = 3.
Figure S7. Effects of knockdown or overexpression of GATA6 and FOXP1 on extents of global DNA methylation and levels of SIRT1 in iPSC-MSCs. Relative 5mC and 5hmC levels (A) and expression levels of SIRT1 (B) of iPSC-MSCs transfected with si-SCR, si-GATA6, or si-FOXP1, detected by ELISA and western blotting analysis, respectively. Relative 5mC and 5hmC levels (C) and expression levels of SIRT1 (D) of iPSC-MSCs transduced with control LV-mCherry, LV-GATA6, or LV-FOXP1. *p < 0.05; n = 3. LV: lentivirus vector.
Figure S8. Relative expression levels of SHH signaling molecules in cells harvested from culture at different passages or tissues of different age mice. Cultured human iPSC-MSCs at P5, P8, and P15 (A) and BMSCs at P3, P5, and P9 (B) or cells isolated from bone marrow (C), muscle (D) and liver (E) of young (12-week-old) and aged (74-week-old) mice were prepared and analyzed by quantitative RT-PCR. *p < 0.05; n = 3.
Figure S9. Curves of SMO and GLI1 expression and SHH induction. (A) Expression levels of SMO in iPSC-MSCs in response to varying doses of SHH after 24 h of induction. (B) Expression levels of GLI1 in iPSC-MSCs in response to varying doses of SHH after 24 h of induction. *p < 0.05; n = 3.
Figure S10. Comparison of cellular senescence among SF-MSCs, iPSC-MSCs, and juvenile MSCs. (A) Images and quantification of western blots detecting p53, p21CIP1, and CDK1 expression in SF-MSCs and iPSC-MSCs compared to young MSC controls harvested from synovial fluid of 3 human donors between 14 and 17 years of age. GAPDH was used as a loading control. (B) Micrographs and quantification of SA-β-gal staining of SF-MSCs, iPSC-MSCs, and young MSC controls. DAPI stains the nucleus (blue). Scale bar = 100 μm. Quantification results are expressed as the percentage of stained cells.
Figure S11. Effects of knockdown of Yamanaka factors on GATA6 expression. Expression levels of GATA6 transcripts in iPSCs in response to knockdown of OCT4, SOX2, KLF4, or c-MYC analyzed by quantitative RT-PCR. *p < 0.05; n = 3.
Figure S12. Expression levels of BCOR and GATA6 in SF-MSCs, iPSCs, and iPSC-MSCs. Expression levels of BCOR and GATA6 transcripts in SF-MSCs, iPSCs, and iPSC-MSCs analyzed by quantitative RT-PCR. *p < 0.05; n = 3.
Figure S13. Analysis of telomerase activity, TERT expression, and relative telomere length in SF-MSCs, iPSCs, and iPSC-MSCs. (A) Telomerase activity levels in attomoles of product per microgram of protein compared. (B) Expression levels of TERT in different cells determined by quantitative RT-PCR. (C) Relative telomere length of cells shown as the ratio of copy number of telomere repeats to single control gene. *p < 0.05; n = 3.
Table S1. Detailed information of antibodies used in this study
Table S2. Primer sequences for analysis of quantitative RT-PCR
Table S5. Hallmark gene sets obtained through gene set enrichment analysis
Table S3. Genes differentially expressed between SF-MSCs, iPSCs, and iPSC-MSCs
Table S4. Differentially expressed genes included in the heatmap of Figure 2B
Table S6. Differentially expressed hallmark gene sets in SF-MSCs vs iPSC-MSCs
Table S9. Expression levels of MSC aging-related genes in SF-MSCs and iPSC-MSCs
Table S7. Details of hallmark gene sets shown in Figure 2G
Table S8. Expression levels of transcription factors in SF-MSCs, iPSCs, and iPSC-MSCs