Abstract
FUS (Fused in sarcoma) is a predominantly nuclear multifunctional RNA/DNA binding protein that regulates multiple aspects of gene expression. FUS mutations are associated with familial Amyotrophic Lateral Sclerosis (fALS) and frontotemporal lobe degeneration (FTLD) in humans. At the molecular level, the mutated FUS protein is reduced in the nucleus but accumulates in cytoplasmic granules. Oligodendrocytes (OL) carrying clinically relevant FUS mutations contribute to non-cell autonomous motor neuron disease progression, consistent with an extrinsic mechanism of disease mediated by OL. Knocking out FUS globally or in neurons lead to behavioral abnormalities that are similar to those present in FTLD. In this study, we sought to investigate whether an extrinsic mechanism mediated by loss of FUS function in OL contributes to the behavioral phenotype.
We have generated a novel conditional knockout (cKO) in which Fus is selectively depleted in OL (FusOL cKO). The FusOL cKO mice show increased novelty-induced motor activity and enhanced exploratory behavior, which are reminiscent of some manifestations of FTLD. The phenotypes are associated with greater myelin thickness, higher number of myelinated small diameter axons without an increase in the number of mature OL. The expression of the rate-limiting enzyme of cholesterol biosynthesis (HMGCR) is increased in white matter tracts of the FusOLcKO and results in higher cholesterol content. In addition, phosphorylation of Akt, an important regulator of myelination is increased in the FusOLcKO. Collectively, this work has uncovered a novel role of oligodendrocytic Fus in regulating myelin deposition through activation of Akt and cholesterol biosynthesis.
Keywords: Fus, myelin, Akt, cholesterol, hyperactivity, FTLD
INTRODUCTION
FUS (Fused in sarcoma) is a predominantly nuclear multifunctional RNA/DNA binding protein that regulates transcription1–3, RNA processing and complexity4–6 and protein expression7 (for review8). FUS mutations are associated with familial Amyotrophic Lateral Sclerosis (fALS) and frontotemporal lobe degeneration (FTLD) in humans9. At the molecular level, the mutated FUS protein is absent from the nucleus and accumulates in cytoplasmic granules10, resulting in loss of FUS nuclear function and gain of cytoplasmic function11.
While selective loss of Fus in motor neuron (MN) is not sufficient to cause MN degeneration (12 and unpublished data Zhu et al.), behavioral abnormalities, similar to those present in FTLD, manifest in Fus depleted models, such as global Fus KO13 and Fus neuronal cKO14,15. These data suggest that loss of FUS function contributes to behavioral abnormalities associated with FTLD and ALS.
Oligodendrocytes (OL) play a critical role for neuron function and survival through neuroprotective roles mediated by myelin proteins on axons16–18 and direct trophic and metabolic support of neuronal cells19. The highest concentration of OL is in the white matter, however, OL are also present in all layers of cortex, especially the input and output layers (IV-V) and regulate cortical neuronal function20.
OL carrying mutations in genes associated with fALS contribute to non-cell autonomous MN loss and disease progression21–24. OL carrying a single copy of FUS with an ALS truncating mutation contribute to motor symptom progression through defective myelinated axons23. In contrast, heterozygous depletion (or haploinsufficiency) of Fus in OL did not lead to motor deficits23. The impact that complete depletion of oligodendrocytic FUS has on oligodendrocyte and function has not been explored. Since mice carrying constitutive deletion of Fus exhibit behavioral abnormalities that mimic FTLD13, we investigated whether an extrinsic mechanism mediated by Fus deficient OL contributes to the behavioral phenotype. To test this hypothesis, we have generated a novel cKO in which Fus is selectively depleted in OL (Fus OL cKO). The Fus OL cKO mice show increased novelty-induced motor activity and enhanced exploratory behavior associated with greater myelin thickness, higher number of myelinated small diameter axons without an increase in the number of mature OL. The expression of the rate-limiting enzyme of cholesterol biosynthesis (HMGCR) is increased in white matter tracts of the Fus OLcKO and results in higher cholesterol content. In addition, phosphorylation of Akt25, an important regulator of myelination is increased in OL and white matter tracts of the Fus OL cKO.
Collectively, the data have uncovered a novel role of oligodendrocytic Fus in regulating myelin deposition through activation of Akt and enhanced cholesterol biosynthesis leading to greater motor activity.
Materials and Methods
Ethics Statement.
The use of animals in this study followed the guidelines of Institutional Animal Care and Use Committees (IACUC) of the Veterans Administration Pittsburgh Health Sciences (Animal Welfare Assurance number A3376–01) and of the University of Pittsburgh (Animal Welfare Assurance number A3187–01) and was approved by IACUC under protocols, #0321 and #15043715.
Generation of the Fus floxed mouse line.
The Fus fl/fl mouse line was generated by microinjecting recombinant ES cells made by the EUCOMM (EUCOMM, project #: 84575) into oocytes at the UC Davis microinjection facility (KOMP and UC Davis). Founders heterozygous for the Fus targeted allele (FUStm1a(EUCOMM)Wtsi) which contains LacZ and neomycin sequences flanked by Flippase recombination targets (FRT) sites and the FUS exons 4–6 flanked by loxP sites inserted in the adjacent introns (Fig. S1) were crossed with a deleter line, C57BL/6N-Tg(CAG-Flpo)1Afst/Mmucd, (MMRRC, 036512-UCD)26 to remove the selectable markers and Fus fl/+ mice were identified by tail DNA PCR and crossed to homozygosity Fus fl/fl (Fig. S1). The Fus fl/fl mice were crossed with the CNPCre/+ mouse17 to generate the Fus fl/fl/CNPcre/+ referred to as Fus OLcKO. Mice were housed in a temperature- and humidity-controlled animal facility with 12 h dark/light cycle. Food and water were available ad libitum. All efforts were made to minimize animal suffering and the number of animals used.
Genotyping.
Mouse genotypes were determined by PCR of tail-derived DNA. To detect Fus floxed alleles we used forward primer “GTG TGA TAA GTA AAC ACG GTC GG” and reverse “GGG AGA CAG GGC AAG AAT TAG ATT GG” spanning across FUS exons 4–6 (Fig. S1). The CNPcre allele was identified by using primers previously described17.
Behavioral testing.
Open Field test:
Motor and exploratory activity was examined with the open field test27 using an arena with automated photo-beam detection system (ENV-5155) connected to Activity Monitor 5 Software (Med Associates, Inc). The mice were acclimated for 30 minutes in a 20–40 lux lit room prior to testing. Each mouse was placed on the right corner of a 12”×12” chamber and allowed to freely explore the chamber for 30 minutes. Most of the activity in the new chamber during the first 30 min represents novelty induced exploratory behavior28. Activity was tracked by I/R beams located on the four walls, which provide X, Y and Z axis to record horizontal and vertical activity (all activities while standing on rear limbs) and was analyzed with the Activity Monitor software (Med Associates Inc.). The software produces several sub-variables, including the total distance traveled taken as measure of locomotion, horizontal and vertical activity, the latter taken as a measure of exploration. To measure anxiety the area was divided in center (75% of the box size) and periphery (25% of the box size) and horizontal and vertical activity was measured in these defined fields (Med Associates Inc.). The measures that we analyzed are: total distance traveled (represents the distance traveled by moving outside of blocks), ambulatory time (time spent walking), ambulatory counts (distance traveled within beams), vertical counts (the number of times the animal rears).
Elevated Plus Maze (EPM) test:
To assess anxiety behavior we used the elevated plus maze29. Mice were acclimated for 30 minutes prior to testing in a well-lit room. The mouse was placed in a closed arm of the EPM (LaFayette Instruments) which has two closed arms and two open arms, and was allowed to explore the apparatus for 5 min. Experiments were conducted at full light. All movements were recorded by an overhead camera using Limelight Software. All the videos were collected and analyzed by an examiner who was blinded to the mouse identity. We measured time spent in the open arms as a measure of anxiety and the number of arm entries and of crossings into each zone, as a measure of activity. Time spent in the open arms was taken as an inverse measure of anxiety.
Light/Dark Transition Test:
The light/dark transition test is another test to measure anxiety behavior30. Boxes consist of an open side and a dark (enclosed side) connected by a small hole to allow the mouse to travel between each side (Maze Engineers). The mouse was placed in the dark side and movements were recorded using an overhead camera with Limelight Software for ten minutes. Videos were analyzed by an examiner blinded to the mouse identity and expressed as time spent in the light vs. dark side, and the number of times the mouse crossed the opening between sides. The time spent in the light side is taken as an inverse measure of anxiety.
Wheel Test:
Wheel cages (Lafayette Neuroscience) are specialized boxes (with food and water holders) equipped with running wheels that are used to measure spontaneous running activity31. We used both Regular Wheels, which consist of 38 regularly placed rungs and Complex Wheels, in which 16 rungs are removed leaving 19 rungs in place in a repeated pattern32. To keep the test results uniform, we used males since females were overall more active than males in this test (unpublished and32). Each mouse was housed individually in the wheel cage with either the Regular or Complex Wheel and activity was recorded during the 12 hrs of dark time. Mice were tested first in the regular wheel and then in the complex wheel. Wheel rotations are recorded automatically by an infrared detector. Data were recorded and analyzed with the Scurry Software (LaFayette). We measured the total distance traveled (meters) and the average speed (meters/min).
Y Maze:
To assess spatial working memory and exploration, we tested mice in the Y Maze (Bioseb Inc.)33,34. The mouse was placed at the end of any of the arms of the maze at 80 Lux illumination and allowed to explore freely for 5 min. The number of arm entries, distance traveled and rearing counts were recorded with a monochrome camera from the Imaging Source and analyzed using the software Panlab SMART and taken as a measure of exploration/activity. Spontaneous alternations were counted when the mouse entered three different arms consecutively and taken as a measure of spatial working memory.
Immunolabeling of frozen sections.
Mice were anesthetized and perFused transcardially with 4% paraformaldehyde (PFA) in PBS, brains were post-fixed for 18hrs in the same fixative followed by 48hrs in 30% sucrose/PBS. Half brains divided through midline and cervical cords were embedded in OCT and frozen at −80C°. 20 μm brain coronal sections from rostral to caudal (+1.18 mm/−1.46 mm from Bregma)35 and 20 μm C1-C8 cervical cord cross sections were collected using a Microm cryostat and were stored free floating in cryoprotectant. For all cellular stains, six sequential brain sections and 8 sequential cervical sections were permeabilized free floating in 0.1% triton-X with 10% normal goat serum in PBS at room temperature for 1 hour and incubated with primary antibody to APC/CC1 (1:100, AbCam #OP80), GFAP (1:1000 Abcam #Ab7260), Iba1 (1:1000 Wako #019–19741), NG2 (1:100, Millipore #ab5320), NeuN (1:200 Millipore, Burlington, Massachusetts USA, #MAB377), FUS (1:500 Bethyl #A300–302A) overnight and P-Akt (1:200 Cell Signaling #4060s) for 48 hours at 4C° and reacted with Alexa Fluor 488/594/647 conjugated anti-rabbit/mouse/chicken/rat (1:200 Jackson ImmunoResearch) for 1 hr at RT. Sections were mounted to positively charged slides and allowed to dry overnight in the dark before mounting with DAPI Fluoromount-G (SouthernBiotech #0100–20)36.
Cell Counts.
20X images were taken from the medial corpus callosum (CC) and ventral columns of the cervical cord using an Olympus BX-51 epifluorescent microscope with MicroSuite software. 8-bit grey scale TIFF format images were uploaded into ImageJ via Image Sequence command before being analyzed by a blinded examiner. For all quantitative analyses, we examined 6 regions of interest (ROI), 100×100μm in the medial portion of CC in six sequential sections from rostral to caudal36. For the cervical cord, we examined 3 ROI 100×100 μm on the ventral columns on either side of the anterior fissure in 8 sequential sections. ImageJ (v1.48) was used in data analysis. APC, NG2, FUS, GFAP, Iba1 in the corpus callosum and ventral columns of the cord and NeuN cells in CA3 and α motor neurons in the anterior horns were counted manually. Since NeuN does not label γ motor neurons, only NeuN+ α motor neurons with a nuclear area of 400–1400 μm2 were counted in the lateral portion of the ventral horns37,38. Counts of NeuN cells in midcoronal cortical layers IV-VI of the motor cortex were obtained using general analysis in Nikon NIS Elements software. APC+/Fus+, NG2+/Fus+ and NeuN+/Fus− were manually counted. To minimize bias, the ROI was chosen by using the DAPI stained section and then the positive cells for each marker were counted. For p-Akt/APC staining analysis, we captured 10–15 fields imaged at 60× with 1.5 optical zoom with Z stacks for 11 steps with a 1 μm step size using a Nikon A1R confocal microscope. The Maximum Intensity Projection (MaxIP, NIS Element, Nikon) was created from the individual Z stack images and used to manually count positive cells per field. To improve image quality, we have used the recently released Denoise.ai functionality for NIS Elements software, which improves the signal to noise ratio by removing the inherent noise generated during image acquisition. Importantly, the original intensity and structure of the images are maintained in the post-acquisition processing (Nikon, Application Note, Nature Methods December 2019).
Protein Isolation and Western Blot Analysis.
Mice were deeply anesthetized, rapidly decapitated, brains and cervical cord were removed. Corpus callosum was dissected in brain slices 1mm in thickness (+ 1/−1 from Bregma)35 under a dissecting microscope. All tissues were rapidly frozen in liquid nitrogen and stored at −80C°. Tissues were homogenized in RIPA buffer (10× Millipore) supplemented with SDS (final concentration 0.15%) and 100× Halt Protease and Phosphatase Inhibitors (1:100 diluted, ThermoFisher). Homogenates were sonicated twice in 20sec/bursts and centrifuged for 15 min at 13,000 rpm at 4C, clear supernatants were transferred to fresh tubes, proteins were measured using BioRad DC protein assay and aliquots were stored at −80C°. For signaling pathway analysis, tissues were homogenized in T-per reagent (ThermoFisher Scientific) followed by sonication. Lysates were kept on ice for 30 min, centrifuged at 10.000 g for 10 min at 4 C and supernatants were collected and kept at −80C. Proteins were measured using the Pierce BCA protein assay (ThermoFisher Scientific). Proteins were separated in either 10 or 13% SDS-PAGE, transferred to Immobilon FL membranes and reacted with primary Ab (Table S1) and labeled with IR Dye 680RD/800CW secondary’s (Li-Cor Biosciences). Membranes were imaged and quantified using Odyssey Image Studio software. Loading accuracy was determined using either U1A or GAPDH as internal control.
RNA and RT-qPCR.
Total RNA was extracted from dissected callosa and cervical cord using TRIzol (Ambion). After treatment with DNAase (Invitrogen) 1 μg of RNA was used for cDNA synthesis with qScript™ cDNA SuperMix (Quanta). Q-PCR was performed on an ABI 7900HT real-time thermocycler (Life Technologies) and analyzed using the ΔΔCT method39 and normalized to β-actin as the internal control. qPCR primers used are listed in40. Primers used for HMGCR are mus_Hmgcr_QTRT-1 CTGAAGGGTTTGCAGTGATAAAG, mus_ Hmgcr_QTRT-2 CCTGGACTGGAAACGGATATAG and for MAG are mus_QTRT_MAG_1 AACCAGTATGGCCAGAGAGC, mus_QTRT_MAG_2 GTTCCGGGTTGGATTTTACC.
Cholesterol Quantification.
Dissected corpus callosum samples were homogenized for 10 min in 500 μL of Folch solvent spiked with the internal standard cholesterol-d7. Samples were spun down at 16,000 × g to remove particulate and the supernatant was transferred to a clean tube and dried under N2. Samples were reconstituted in 100 μL of CHCl3:MeOH (2:1) and injected (10 μL) onto a Luna C18(2) column (2 × 100, Phenomenex) at a flow rate of 0.45 mL/min. Analytes were separated using a Shimadzu chromatograph with a CTC PAL autosampler. Solvent A consisted of 1:1 H2O:ACN with 0.1% formic acid and Solvent B consisted of 2:3 ACN/IPA with 0.1% formic acid. The gradient started at 65%B and increased to 100%B over 13 min. The column was held at 100%B for 3 min before returning to starting conditions for equilibration. Cholesterol (369.3→147.3) and cholesterol-d7 (376.4→147.3) were analyzed by a Sciex 5000 triple quadrupole using selected reaction monitoring in positive ion mode. Peak area of cholesterol was normalized to the peak area of cholesterol-d7 and tissue weight, and reported as a relative amount.
Electron Microscopy (EM).
Mice were anesthetized and perFused transcardially with 2.5% glutaraldehyde in PBS, brains were harvested and the corpus callosum was isolated from half coronal sections 2 mm thick (+1 to −1 from Bregma)35. The specimens were fixed in cold 2.5% glutaraldehyde (25% glutaraldehyde EM grade, Taab Chemical) in 0.01 M PBS (sodium chloride, potassium chloride, sodium phosphate dibasic, potassium phosphate monobasic, Fisher), pH 7.3, were rinsed in PBS, post-fixed in 1% Osmium Tetroxide (Osmium Tetroxide crystals, Electron Microscopy Sciences), dehydrated through a graded series of ethanol (30% - 90% - Reagent Alcohol, Fisher, and 100% - Ethanol 200 Proof, Pharmco) and embedded in Epon (Dodecenyl Succinic Anhydride, Nadic Methyl Anhydride, Scipoxy 812 Resin and Dimethylaminomethyl, Polysciences). The pieces of CC were oriented so that sections could be cut from midline in a sagittal plane.
Thin sections (65 nm) were cut, stained with 2% uranyl acetate (Uranyl Acetate dihydrate, Electron Microscopy Sciences, Hatfield, PA) and Reynold’s lead citrate (Lead Nitrate, Sodium Citrate and Sodium Hydroxide, Fisher, Pittsburgh, PA) and visualized at 5000× and 10,000× on JEOL 1400 transmission electron microscope (JEOL Peabody, MA) with a side mount AMT 2k digital camera (Advanced Microscopy Techniques, Danvers, MA). G ratio calculations were done on 10,000× images from three animals per genotype. G ratios (inner axon diameter/total diameter) were measured on 100–150 myelinated axons per mouse using ImageJ software. Scatter plot was used to identify the differences in myelin thickness between groups over the range of axon diameter. To establish the size distribution of myelinated axons, we measured an average of 153 axons per brain using the ImageJ line measurement function over 3 full EM fields acquired at 10,000×. All axons on the edge of the image were omitted as well as axons impacted by artifacts. The axon size was calculated by averaging two perpendicular diameter measurements and data are expressed as the percent of axons in each diameter bracket (<0.5 to >2 μm) over the total axons analyzed.
Bioinformatics Analysis of Fus binding motif in cholesterol metabolism genes.
We conducted this analysis using FIMO (Find Individual Motifs Occurrences) in the MEME motif-based sequence analysis tools version 5.1.141. We analyzed the entire gene sequences (exons and introns) of genes involved in cholesterol metabolism against the consensus sequence motif identified in the 3′-UTR of Fus mRNA targets42 using the default p-value cutoff (0.0001).
Statistics.
Data from the Open Field Test were analyzed with SAS Base 9.4 (SAS Institute Inc., Cary, NC). The data were standardized via SAS Proc Stdize procedure to keep the results comparable in similar studies across times of testing. The formula used in the standardization step is:
Where observed is the raw individual values; minimum and maximum are the minimum and maximum values within each genotype, respectively, thus the individual raw values were standardized to a value between 0 and 1, of which 0 means that the individual value is the minimum and 1 means that its observed value is the maximum. The data were then analyzed using repeated measures analysis of variance (ANOVA) with the factor of genotype (2 levels), sex (2 levels), and week (5 levels). The dependent variables are the behavioral parameters (e.g., total distance, vertical counts, ambulatory time). Post-hoc tests were performed and the results were adjusted for multiple comparisons with Bonferroni tests. An alpha level of .05 was used for all statistical tests. For all comparisons, significance was set at p < 0.05.
All other statistical analyses were performed using GraphPad Prism Version 6.00. We utilized a two-tailed, unpaired Student’s t-test for all pair-wise comparisons. P values less than 0.05 were considered significant. All values are shown as mean ± SEM.
RESULTS
Generation and Characterization of the Fus OL cKO
To conditionally deplete Fus in OL, the Fus fl/fl mice (referred to as WT) in which flox sites flank Fus exons 4–6 were crossed with the CNPCre/+ mouse17 to generate the Fus fl/fl/CNPcre/+ referred to as Fus OLcKO. Fus fl/fl/CNPcre/+ were generated at the expected frequency and showed normal postnatal survival. The expression of Fus protein was reduced by 70% in WB of lysates prepared from corpus callosum (CC) of 6 week-old Fus OLcKO vs. WT (Fig. 1a) consistent with selective depletion of Fus in OL. We have measured depletion of Fus in the oligodendrocyte lineage by counting cells co-stained with FUS and APC/CC1, a marker of OL, or NG2, a marker of OPC, in 6 week-old Fus OLcKO and WT corpus callosum and cervical cord ventral columns. A nearly complete depletion of FUS was detected in OL of the FusOLcKO corpus callosum (Fig. 1b, 5% APC/FUS in FusOLcKO vs. 76% in WT) and ventral columns (Fig. 1c, 1% APC/Fus in FusOLcKO vs. 99.8% in WT). Interestingly, while almost 100% of WT OL express Fus in the cord, only 76% do in corpus callosum. The significance of this finding is unclear. Partial depletion of Fus was detected in the OPC of the FusOLcKO corpus callosum (Fig. 1d, NG2/Fus 78% in FusOLcKO vs. 93% in WT) and ventral columns (Fig. 1e, NG2/Fus 76% in FusOLcKO vs. 97% in WT). The density of APC+ and NG2+ cells was not affected by depletion of FUS in either CC or ventral columns of the cervical cord (Fig. 1b–e).
Figure 1. Fus expression is reduced in OL of the FusOLcKO.
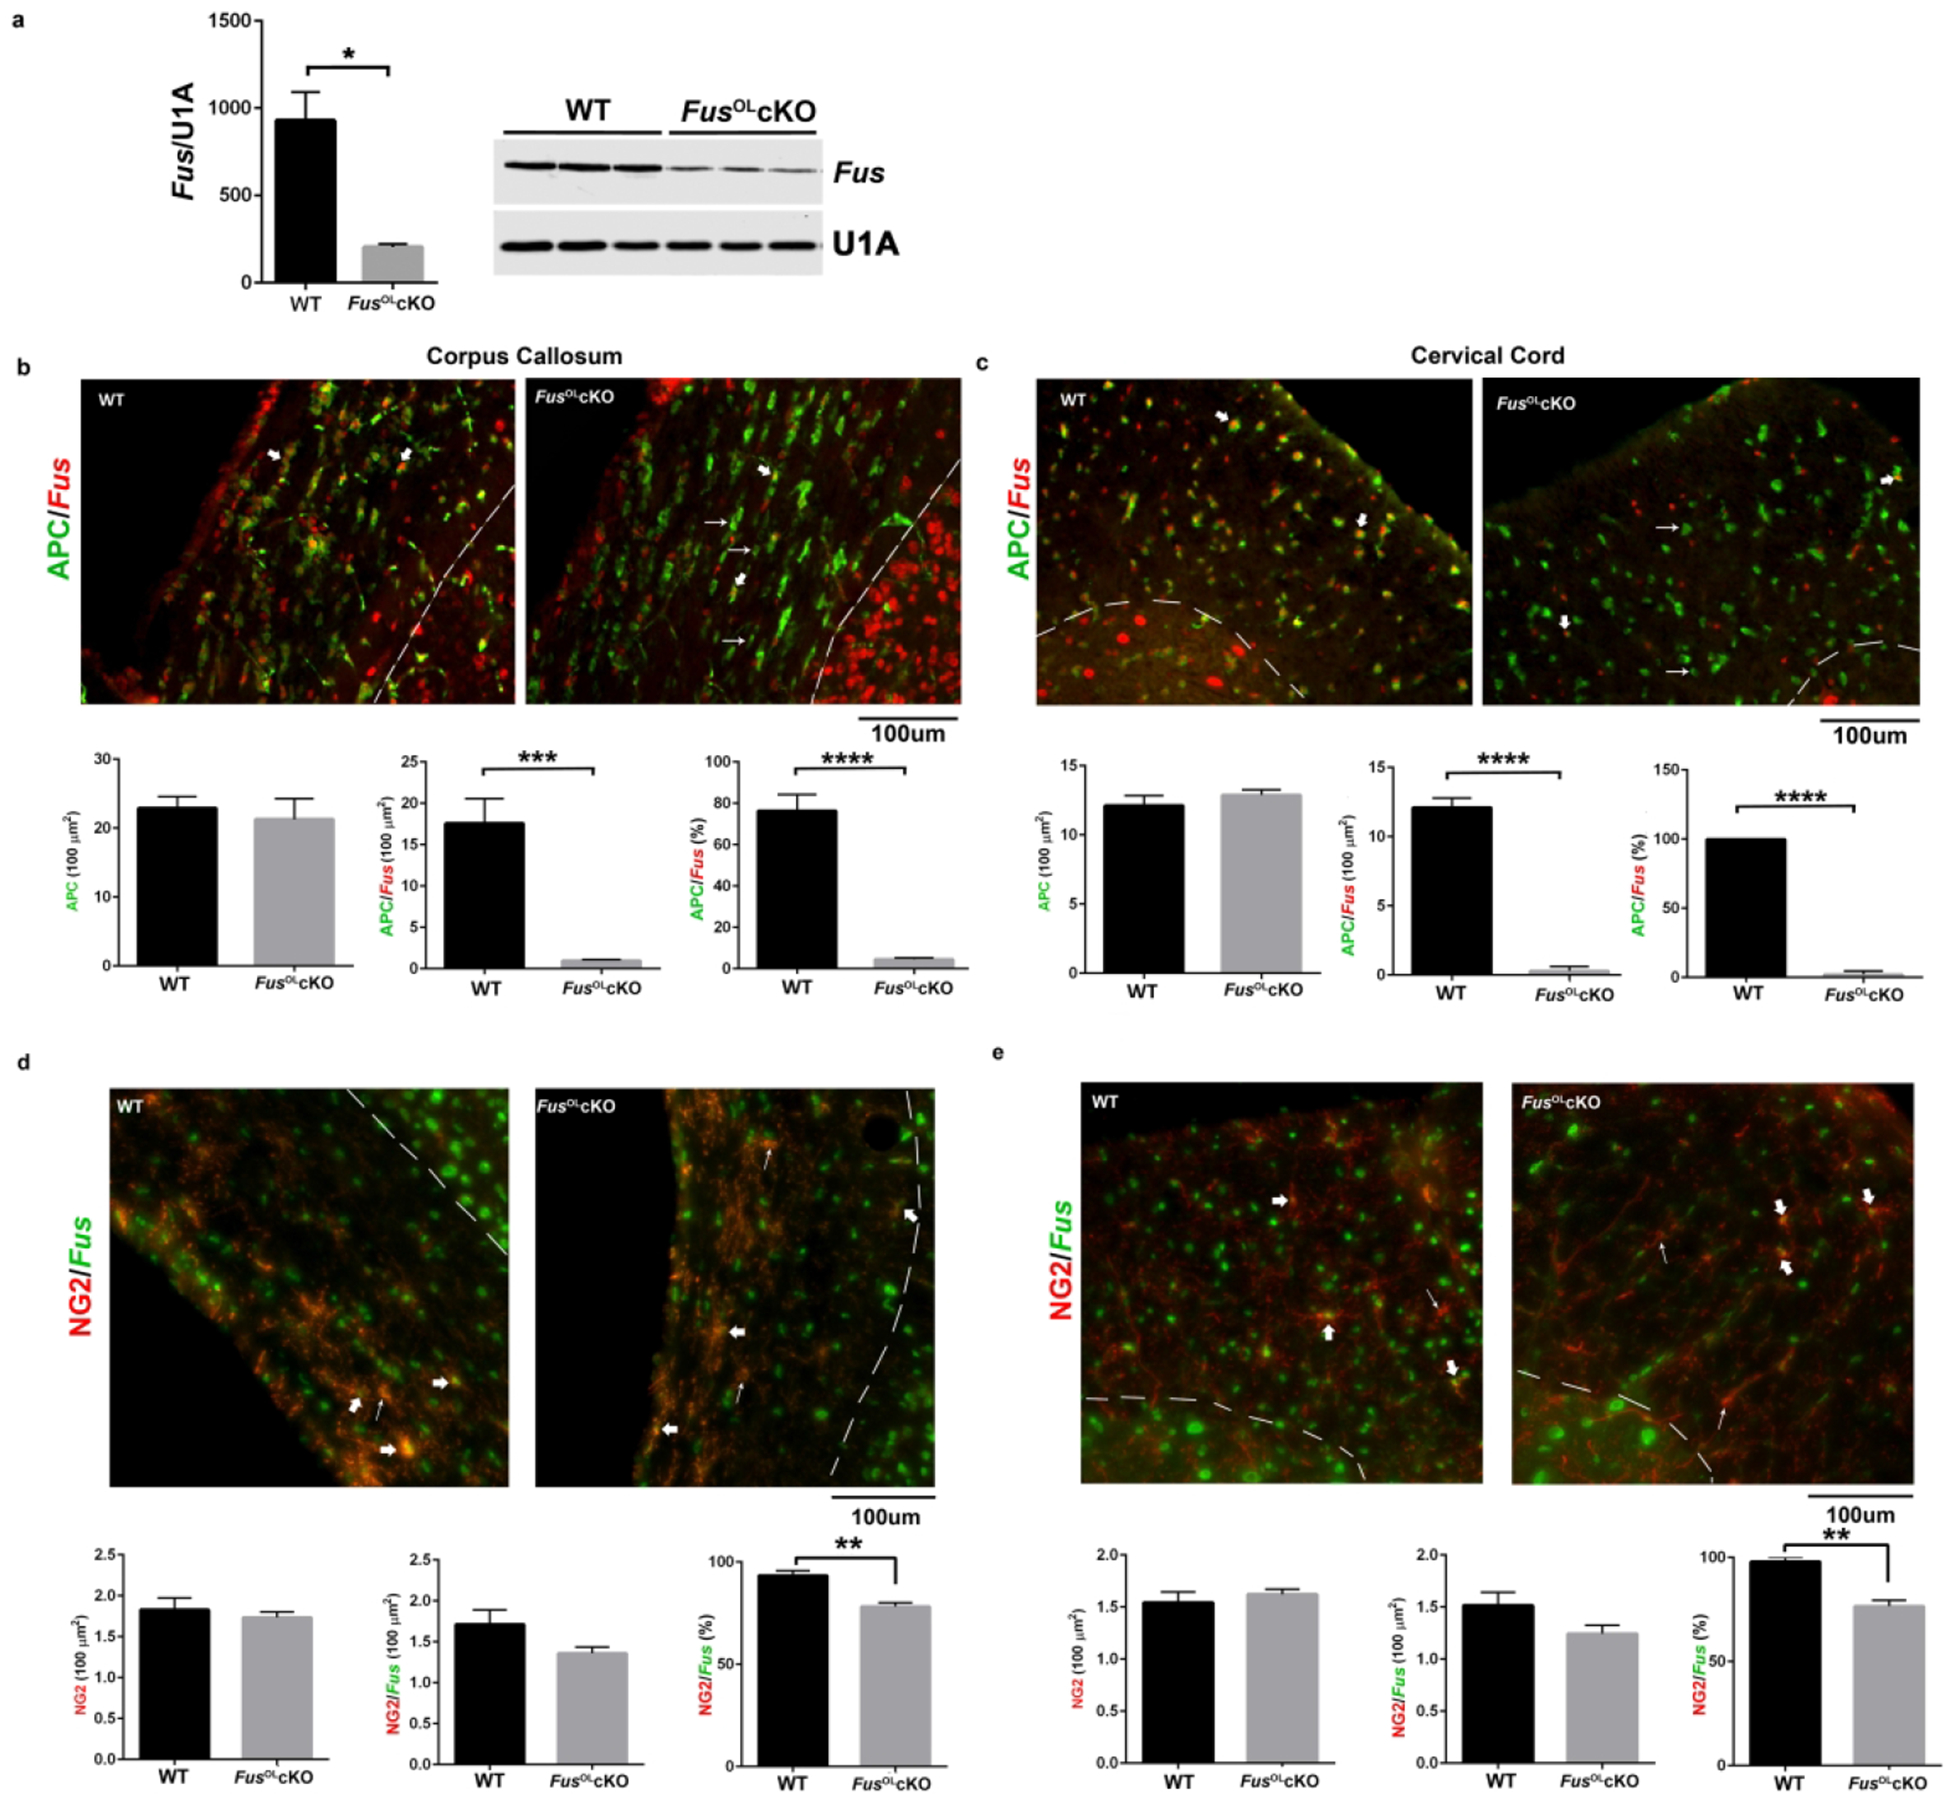
a. Representative Western blot shows FUS in lysates prepared from 6 weeks old WT and FusOLcKO CC and bar graph shows quantification (n=3, *p<0.05). b. Representative 20× epifluorescent image of 6 weeks old WT and FusOLcKO CC stained with APC and FUS antibodies. APC+/Fus− cells in the FusOLcKO (thin arrows), APC+/FUS+ cells (thick arrows), APC−/Fus+ cells (arrow heads) represent non-OL, consistent with conditional ablation. Bar graphs represent the mean±SE of APC cells (ns) and APC/Fus cells (***p<0.001) counted in 6 ROI from 6 sections rostral to caudal and the percent of Fus/APC (****p<0.0001) (n=3). c. Representative 20× epifluorescent images of 6 weeks old WT and FusOLcKO ventral columns cervical cord stained with APC and FUS antibodies. APC+/Fus− cells in the FusOLcKO (thin arrows), APC+/Fus+ cells (thick arrows) and APC−/Fus+ cells (arrow heads) represent non-OL, consistent with conditional ablation. Bar graphs represent the mean±SE of APC cells (ns) and APC/Fus cells (****p<0.0001) counted in 3 ROI from 8 sections rostral to caudal and the percent of Fus/APC (****p<0.0001) (n=3). d. Representative 20× epifluorescent image of 6 weeks old WT and FusOLcKO CC stained with NG2 and FUS antibodies. NG2+/Fus− cell in the FusOLcKO (thin arrows) and NG2+/Fus+ cells (thick arrows). Bar graphs represent the mean±SE of counts of NG2 cells (ns), NG2/Fus cells (ns) counted in 6 ROI from 6 sections rostral to caudal and percent of NG2/Fus (**p<0.01) (n=3). e. Representative 20× epifluorescent images of 6 weeks old WT and FusOLcKO ventral columns cervical cord stained with NG2 and FUS antibodies. NG2+/Fus− cells in the FusOLcKO (thin arrows), NG2+/Fus+ cells (thick arrows). Bar graphs represent the mean±SE of NG2 cells (ns), NG2/Fus cells (ns) counted in 3 ROI from 8 sections rostral to caudal and the percent of Fus/NG2 (**p<0.01) (n=3).
To assess the specificity of Fus depletion to the oligodendrocyte lineage, we have measured FUS expression in neurons by co-staining Fus with NeuN in 6 week-old FusOLcKO and WT output layers (IV-VI) of motor cortex, CA3 of the dentate gyrus of the hippocampus and in the anterior horns of the cervical cord. 100% of NeuN+ cells are Fus+ in the WT cortex and CA3 and >98% of NeuN+ cells are Fus + in the same regions of the FusOLcKO. 93±9.4% of WT NeuN+ α-motor neurons were Fus+ and 76±4.5% of NeuN+ α-motor neurons were Fus+ in the FusOLcKO (SFig. 2c, all ns). There were no differences in the density of NeuN+ cells between 6 week-old FusOLcKO motor cortex (WT: 242±8 vs. FusOLcKO 233±17/100μm2, ns, SFig. 2a), CA3 (WT: 49.7±5.3 vs. FusOLcKO 51.2±4.5, ns, SFig. 2b) and number of NeuN+ α motor neurons in anterior horns of the cervical cord compared to control littermates (WT:8.3±0.27 vs. FusOLcKO:9.7±0.83, ns, SFig. 2c). The low depletion of neuronal Fus does not impact the total number of neurons.
These data show efficient knock out of Fus in the oligodendrocyte lineage and normal OL lineage progression and OPC/OL cell number.
FusOLcKO exhibit hyperactivity and enhanced exploration
To determine the phenotypic consequences of oligodendrocytic Fus depletion, we have performed behavioral testing longitudinally in a large cohort (n=20–40, 60% males and 40% females) of FusOLcKO and WT mice from 12 to 70 weeks of age. In the open field, the FusOLcKO mice exhibited an enhanced motor/exploratory behavior, which was most prominent at 12 and 20 weeks and still present but less pronounced at 40, 60 and 70 weeks (Fig. 2). The behavioral parameters that showed significant genotype*age interaction effect using repeated measures analysis of variance (ANOVA) were the total ambulatory time (Fig. 2a), distance traveled (Fig. 2b), the ambulatory counts (Fig. 2c) and periphery ambulatory counts (Fig. 2d) upon standardization, indicating that the enhanced behavior in FusOLcKO mice at 12 and 20 weeks may be attributed to the interaction between genotype and age (Fig. 2). In contrast, a significant genotype and age interaction was not found for ambulatory time in the center of the field and vertical counts in the periphery (a measure of exploration) and only main effect of genotype was significant (p<0.03) (data not shown).
Figure 2. Fus knockout in OL leads to novelty-induced hyperactivity and exploration.
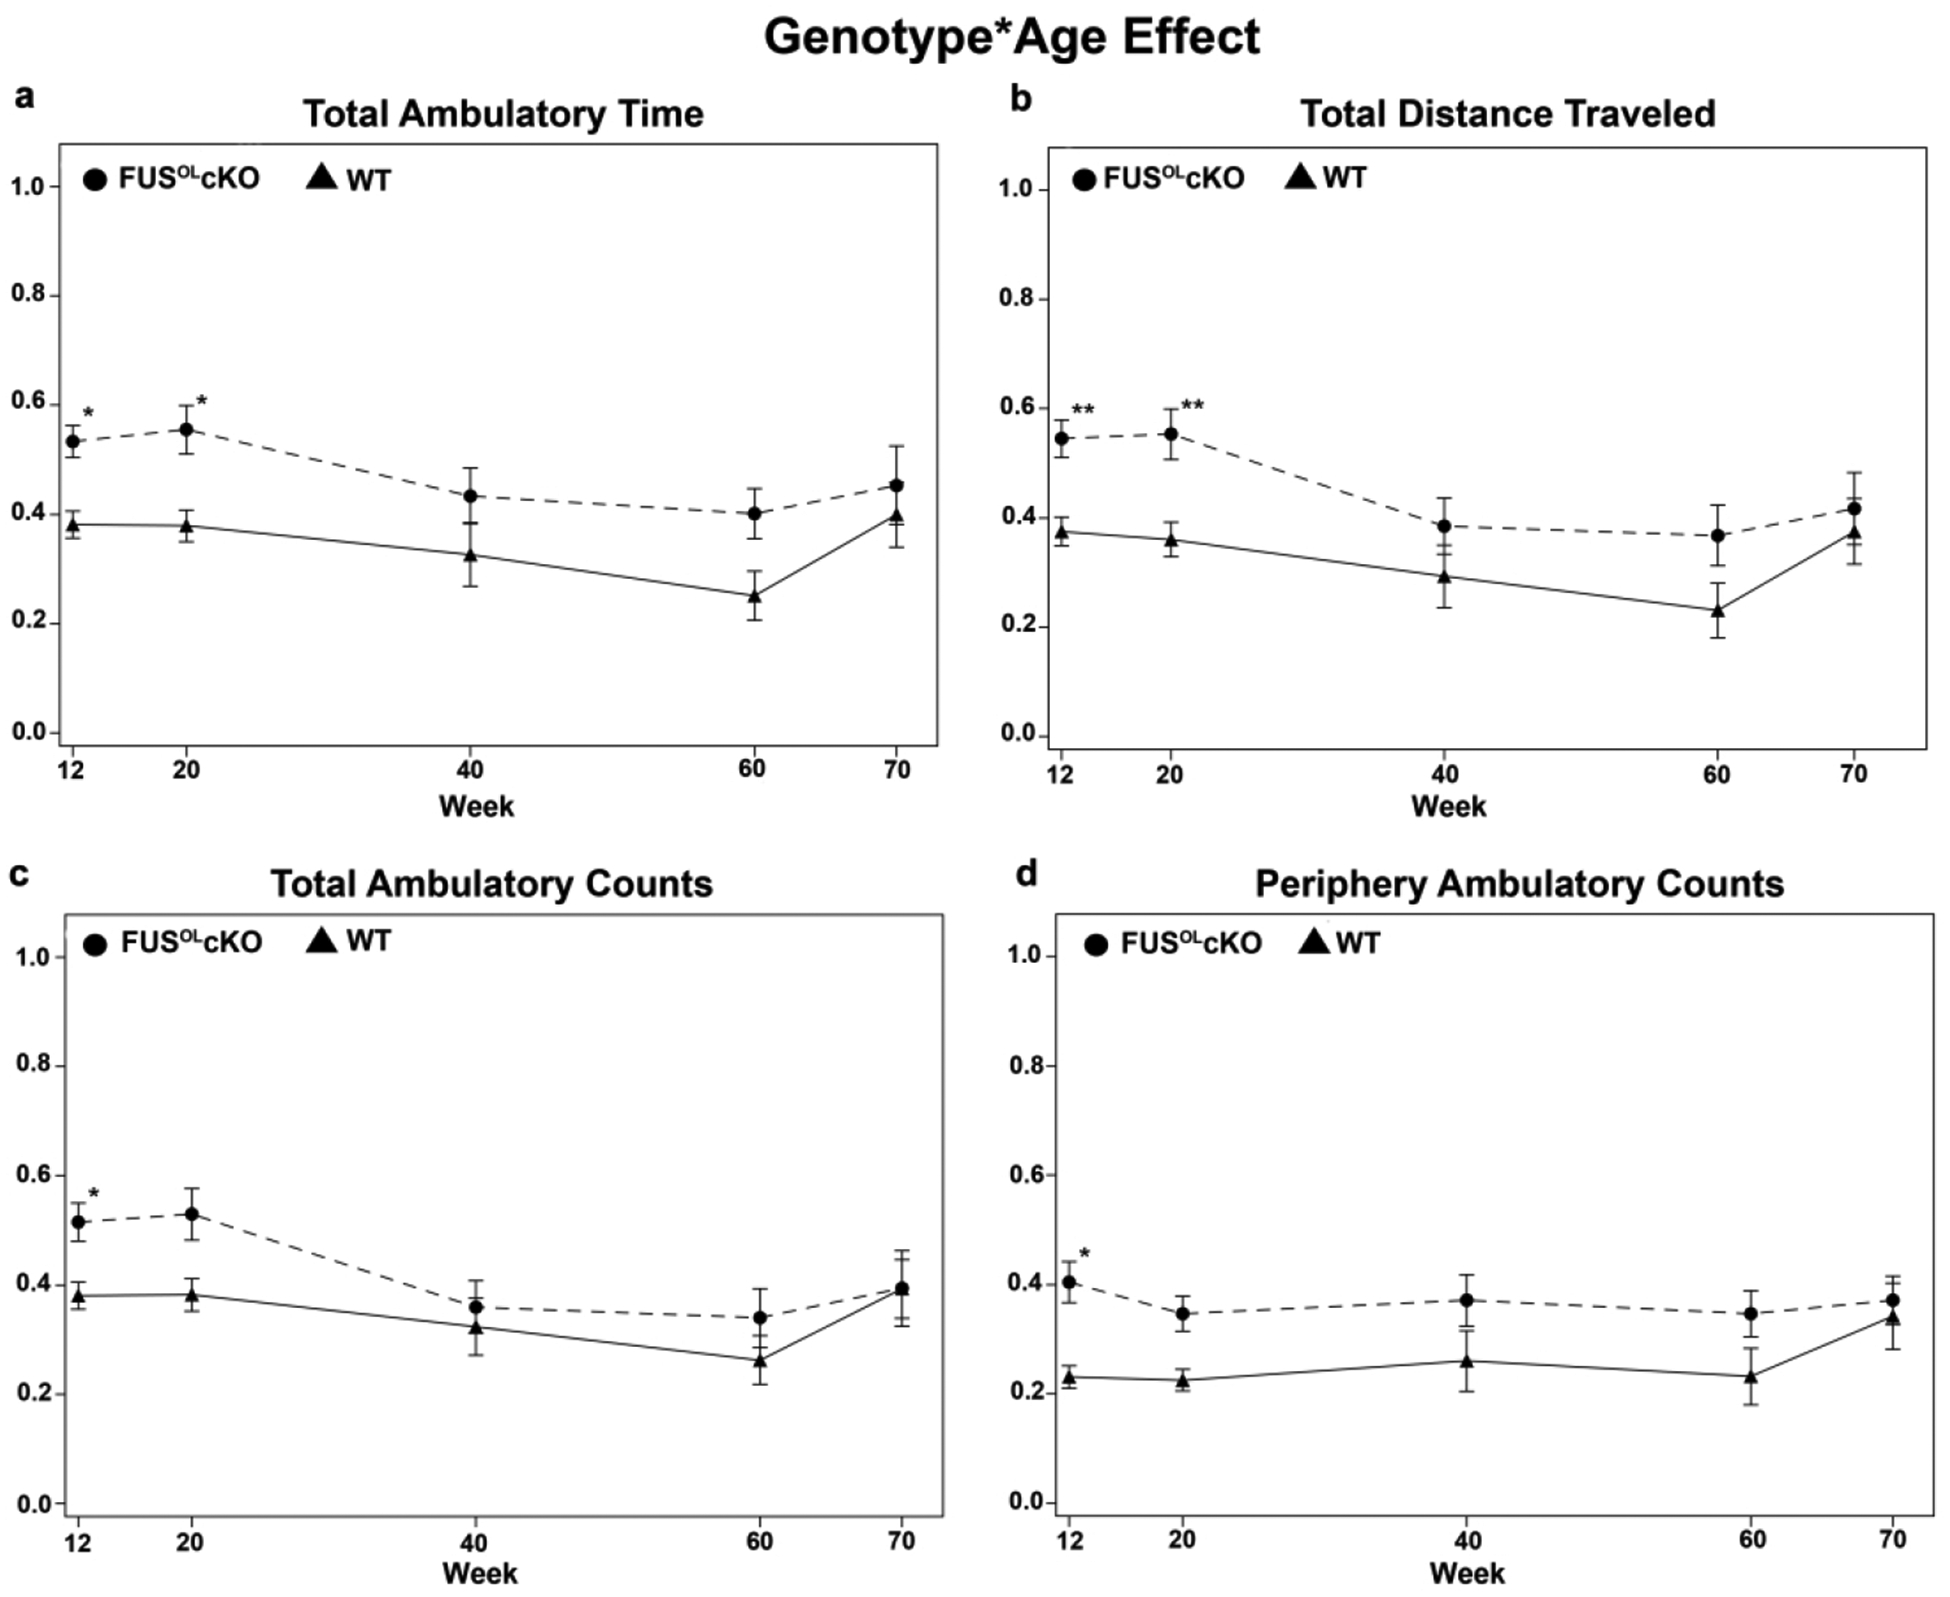
Open field analysis of 12, 20, 40, 60 and 70 weeks old FusOLcKO and WT revealed a significant interaction between genotype*age at 12 and 20 weeks for the total ambulatory time (a) and distance traveled (b). Significance for genotype*age was present at 12 weeks for total (c) and periphery ambulatory counts (d) (see Methods). Although no statistically significant interaction was present at older ages, the FusOLcKO mice performed consistently better than the WT in all measures. The data were analyzed using repeated measures analysis of variance (ANOVA). The post-hoc analysis was performed by multiple comparisons with Bonferroni tests. For all comparisons, significance was set at p < 0.05.
To determine if the increased motor/exploratory behavior was related to heightened anxiety, we tested anxiety in each genotype (n=7–17) with the elevated plus maze29 and light/dark transition34. These tests did not show differences in the time spent in the open arm of the EPM and in the time spent in the light vs. dark box (data not shown). These results indicate that the FusOLcKO mice are not more anxious than the WT, hence, the greater activity measured in the open field does not reflect differences in anxiety between genotypes.
Next, we measured motor activity, endurance and dexterity in the running wheel31,32,43 (n=5–6/genotype) and working memory/exploration in the Y maze33 (n=6/genotype). Mice caged with the “regular wheel” or the “complex wheel” ran spontaneously on the wheel. We tested 8, 12 and 20 week old mice since at these ages they showed the greatest motor activity in the open field test. There were no statistically significant differences in distance traveled and speed between genotypes at each age (Fig. 3a, 3b). In the Y maze test, the number of rearings was higher at 8 weeks in the FusOLcKO vs. WT (Fig. 3f), while the number of alternations (Fig. 3c), resting time (Fig. 3d) and total arm entries (Fig. 3e) were similar between genotypes.
Figure 3. Motor function on the wheel and spatial working memory are not affected by Fus knockout in OL.
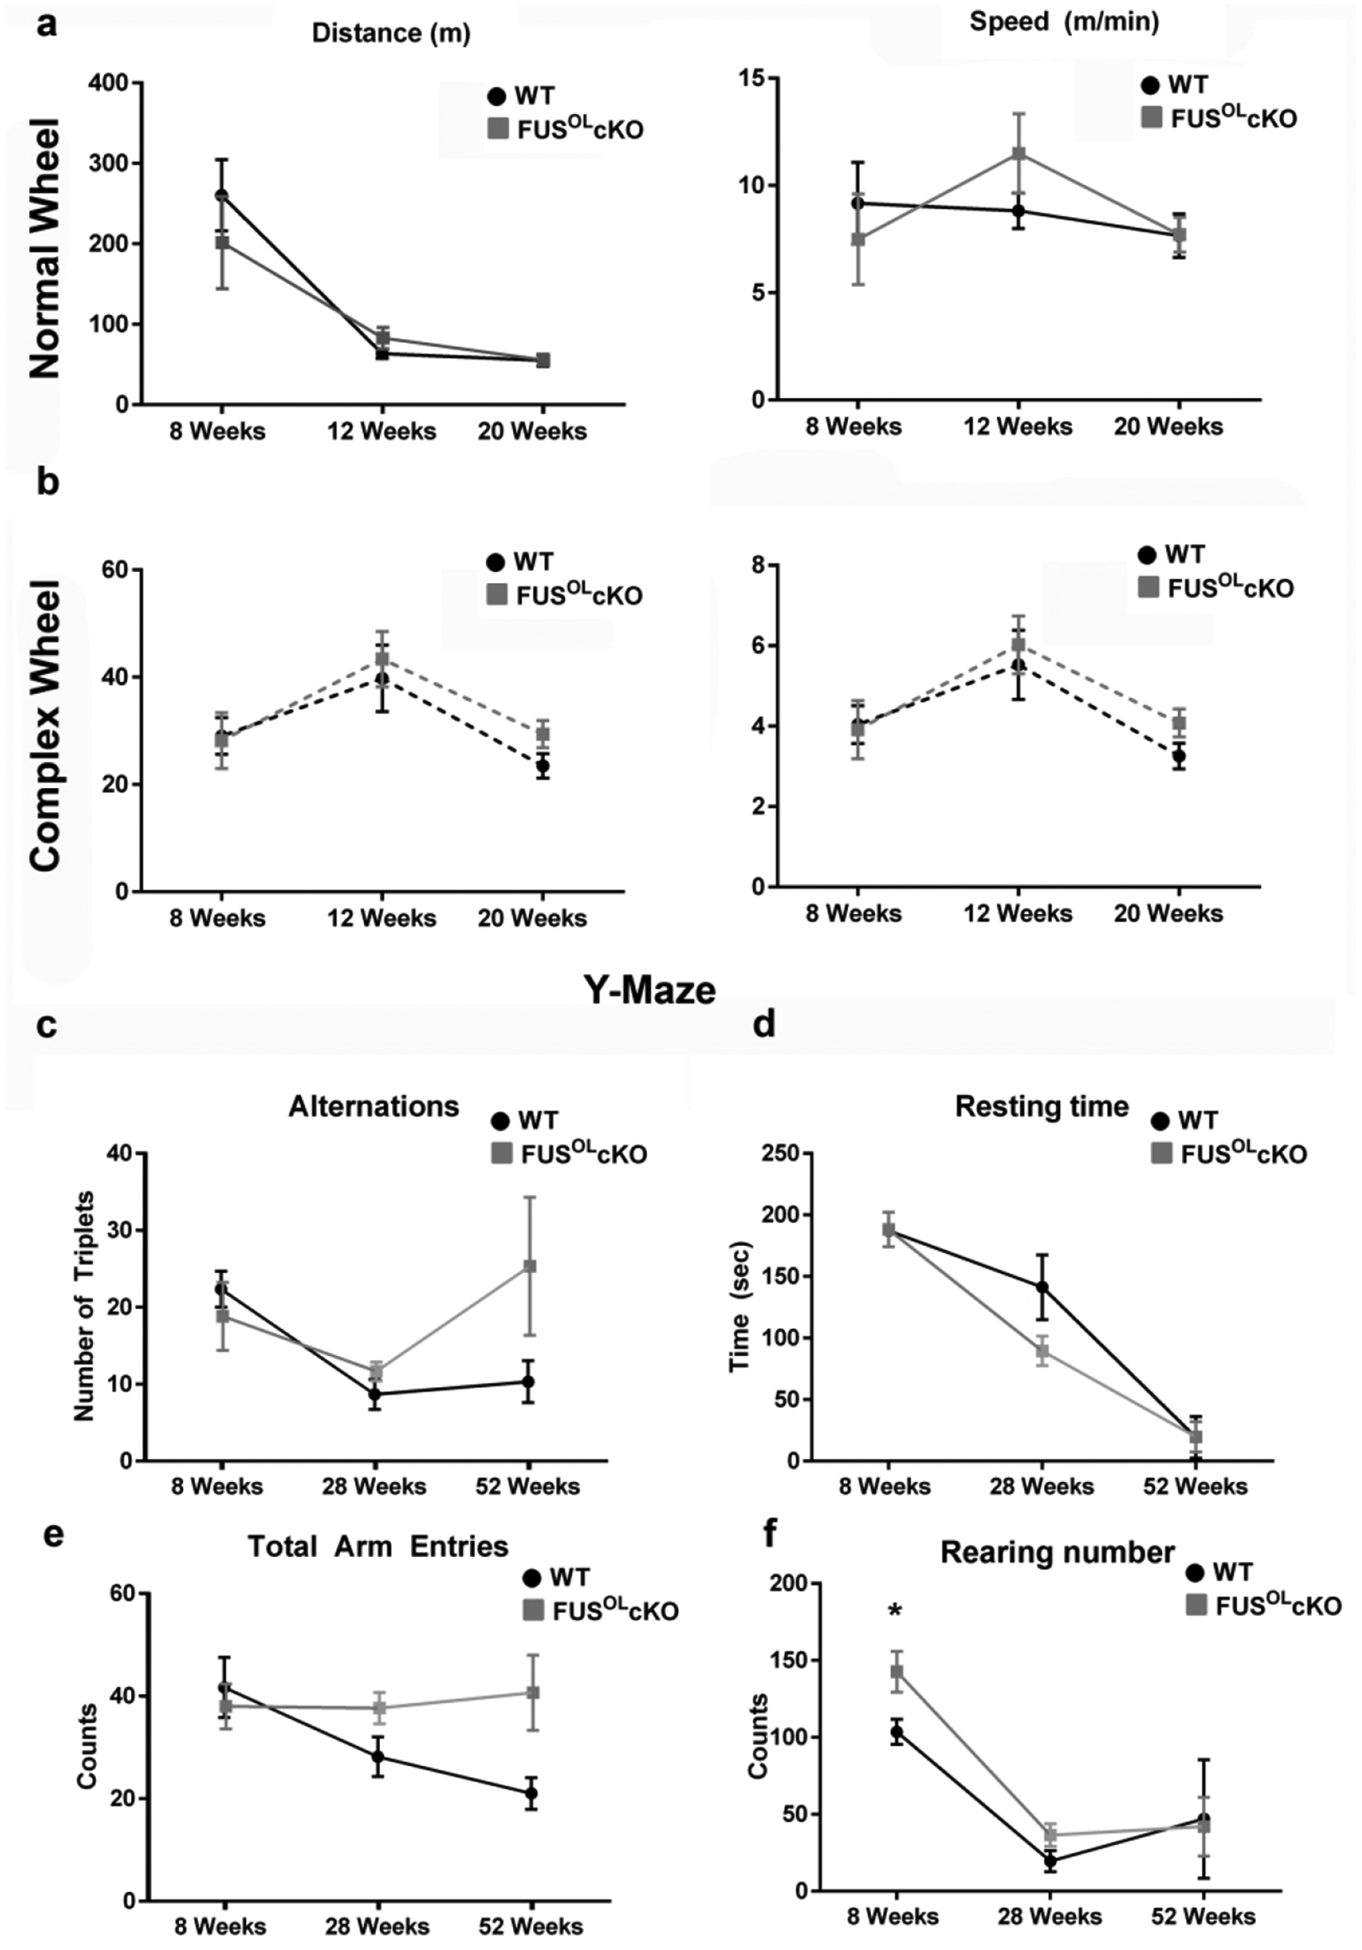
a, b. FusOLcKO and WT mice were tested at 8, 12 and 20 weeks of age in the regular and complex wheel (n=5–6/genotype). Distance and speed were not different between genotypes. c-f. FusOLcKO and WT mice were tested at 8, 12 and 20 weeks of age in the Y maze (n=6/genotype). Alternations (c), resting time (d) and arm entries (e) were not different between genotypes. The number of rearings (f) was higher in the 8 weeks old FusOLcKO vs. WT (*p<0.05).
Collectively, the data suggest that novelty-induced motor activity and exploratory behavior are increased in the FusOLcKO mice compared to WT especially up to 20 weeks of age.
Fus depletion in OL is associated with hypermyelination
To characterize the molecular substrate(s) underlying the hyperactive phenotype, we have examined myelination of axons. Myelin thickness was visualized by EM followed by G ratio analysis of myelinated axons in the medial callosum of 6 week- (myelination is complete), 20 week- (the peak of the motor phenotype) and 70 week-old mice (the endpoint). G ratios were significantly lower in FusOLcKO compared to WT across all axon sizes (Fig. 4b, scatter plot), indicating thicker myelin (mean G ratios: 6 weeks WT=0.78±0.004 and FusOLcKO= 0.70±0.005, 20 weeks WT=0.74±0.005 and FusOLcKO=0.69±0.005, 70 weeks WT=0.77±0.004 and FusOLcKO =0.71±0.0051 ****p<0.0001 for all comparisons, Fig. 4a–c). Myelinated axon size distribution demonstrated a 2–3 fold increase in the percent of myelinated small diameter axon (<0.5μm) in the FusOLcKO compared to WT at the three ages (Fig. 4d, p<0.05–0.01). An age-dependent increase in the percent of myelinated small caliber axons occurs in both FusOLcKO and WT, however, the separation between the FusOLcKO vs. WT persists through adulthood (Fig. 4d). In one class of myelinated higher caliber axons the percent was lower in 6 and 20 weeks old FusOLcKO compared to WT (Fig. 4d).
Figure 4. FusOLcKO mice demonstrate increased myelin thickness and greater myelination of small diameter axons.
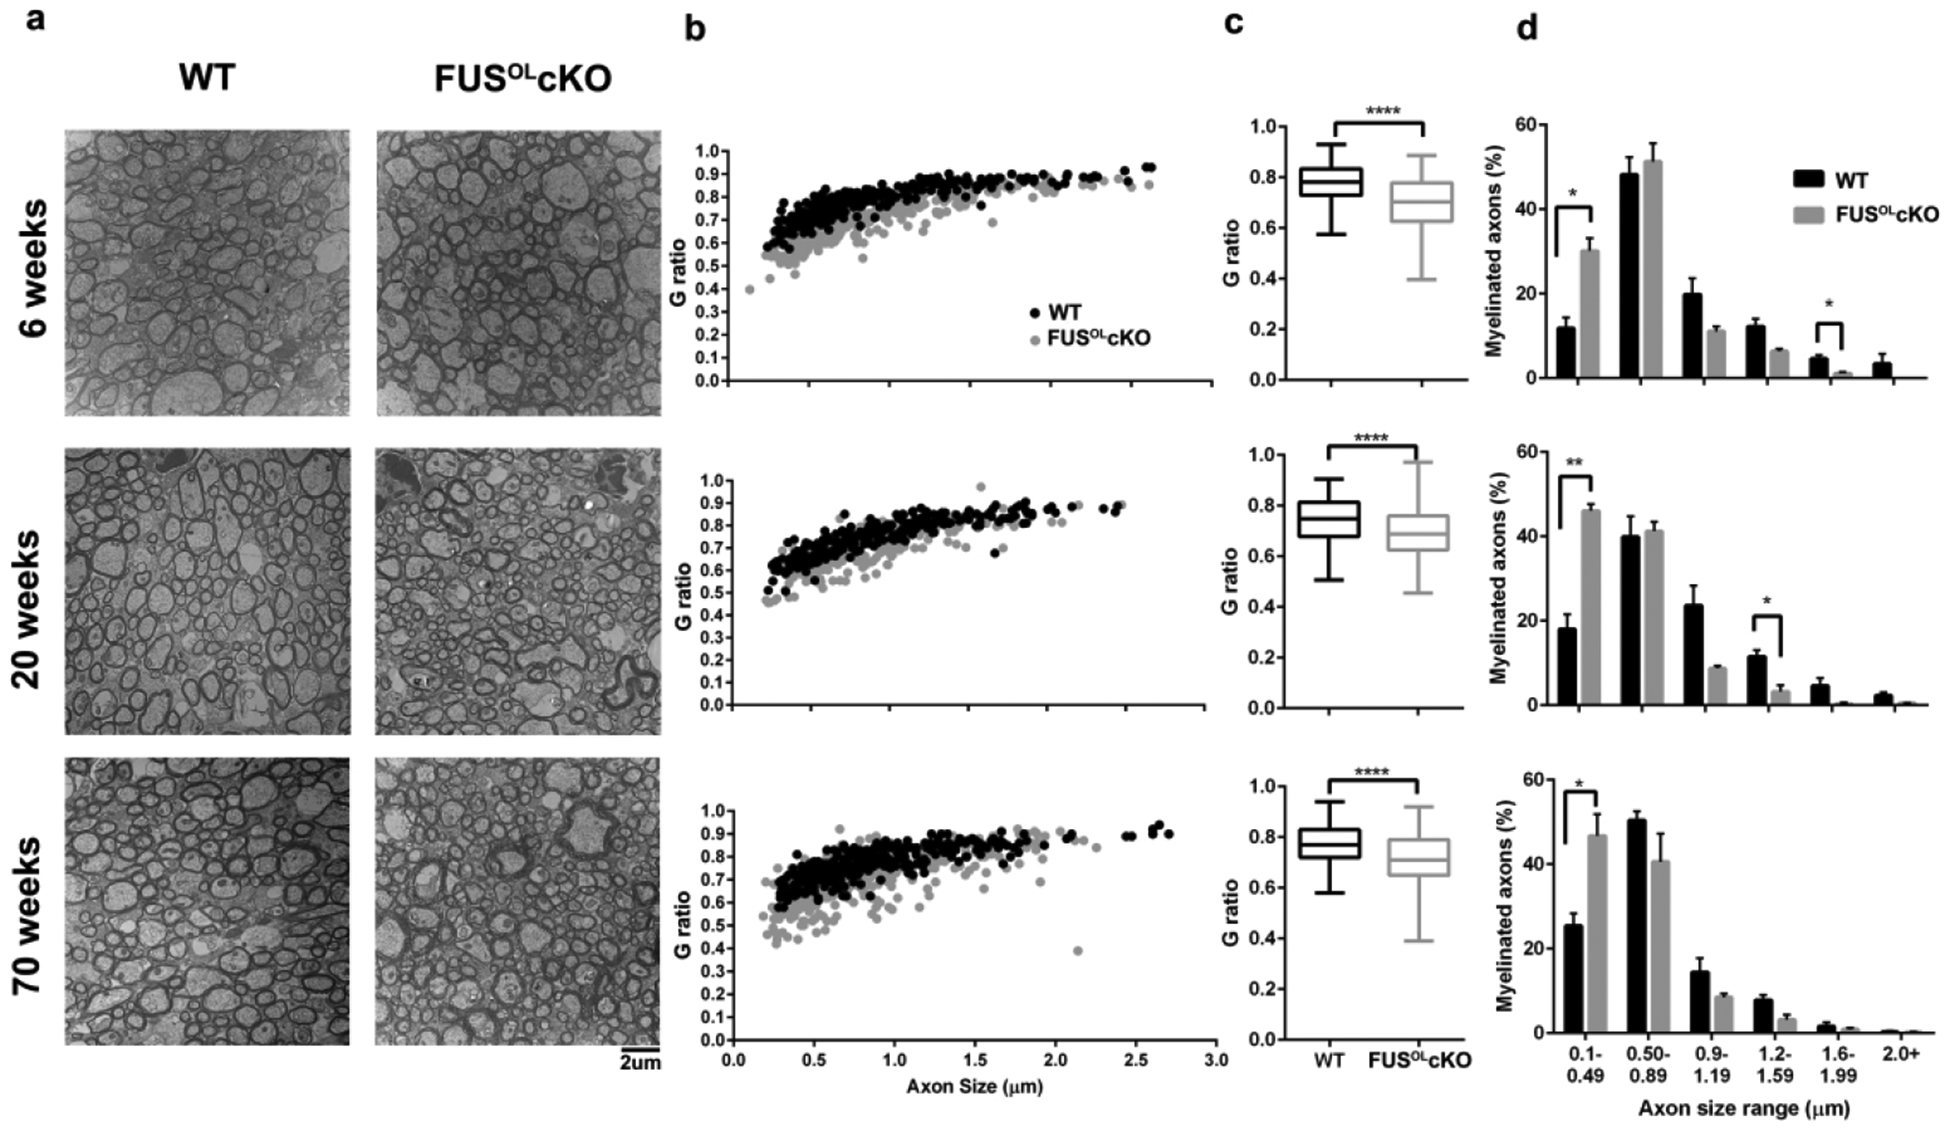
a. Representative electron micrographs of matched thin sections through the medial CC of 6, 20 and 70 weeks old FusOLcKO and WT mice (n=3). b. On scatter plot, the G ratio is consistently smaller in the FusOLcKO vs. WT across all axon sizes. c. Mean G ratios for each genotype are shown and are significantly smaller in the FusOLcKO (n=250–300 axons/mouse brain, ****p<0.0001). d. Percent of myelinated axons over the axon size distribution shows a higher percent of myelinated axons <0.5 μm in diameter in the FusOLcKO at 6, 20 and 70 weeks of age (n=150 axons/mouse, *p<0.05). The percent of myelinated axons in axons >0.99μ in diameter was generally lower in the FusOLcKO, but reached significance only for the 1.6–2 μm at 6 weeks and 1.2–1.6 μm at 20 weeks (*p<0.05).
Importantly, the density of APC+ cells was similar in the CC of 6, 20 and 70 week old FusOLcKO vs. WT (Fig. 5a,b). Iba1+ cell counts were similar between genotypes in 6 and 20 weeks old mice (Fig. 5c,d). GFAP+ cell counts were similar between genotypes in 6 weeks old mice, but counts were lower in the 20 weeks old WT compared to FusOLcKO (Fig. 5e, f p<0.05). This difference reflects a decrease in density of GFAP+ cells in 20 vs. 6 weeks old WT (Fig. 5e,f). In contrast, the density of GFAP+ cells was unchanged between 20 and 6 weeks old FusOLcKO (Fig. 5e,f). The significance of this decrease in the WT type remains to be explored. Collectively, the data show that conditional depletion of oligodendrocytic FUS leads to increased myelin deposition with a shift to myelination of small caliber axons without expansion of the pool of mature OL or changes in density of microglia and astrocytes.
Figure 5. Density of mature OL and other glia in the FusOLcKO.
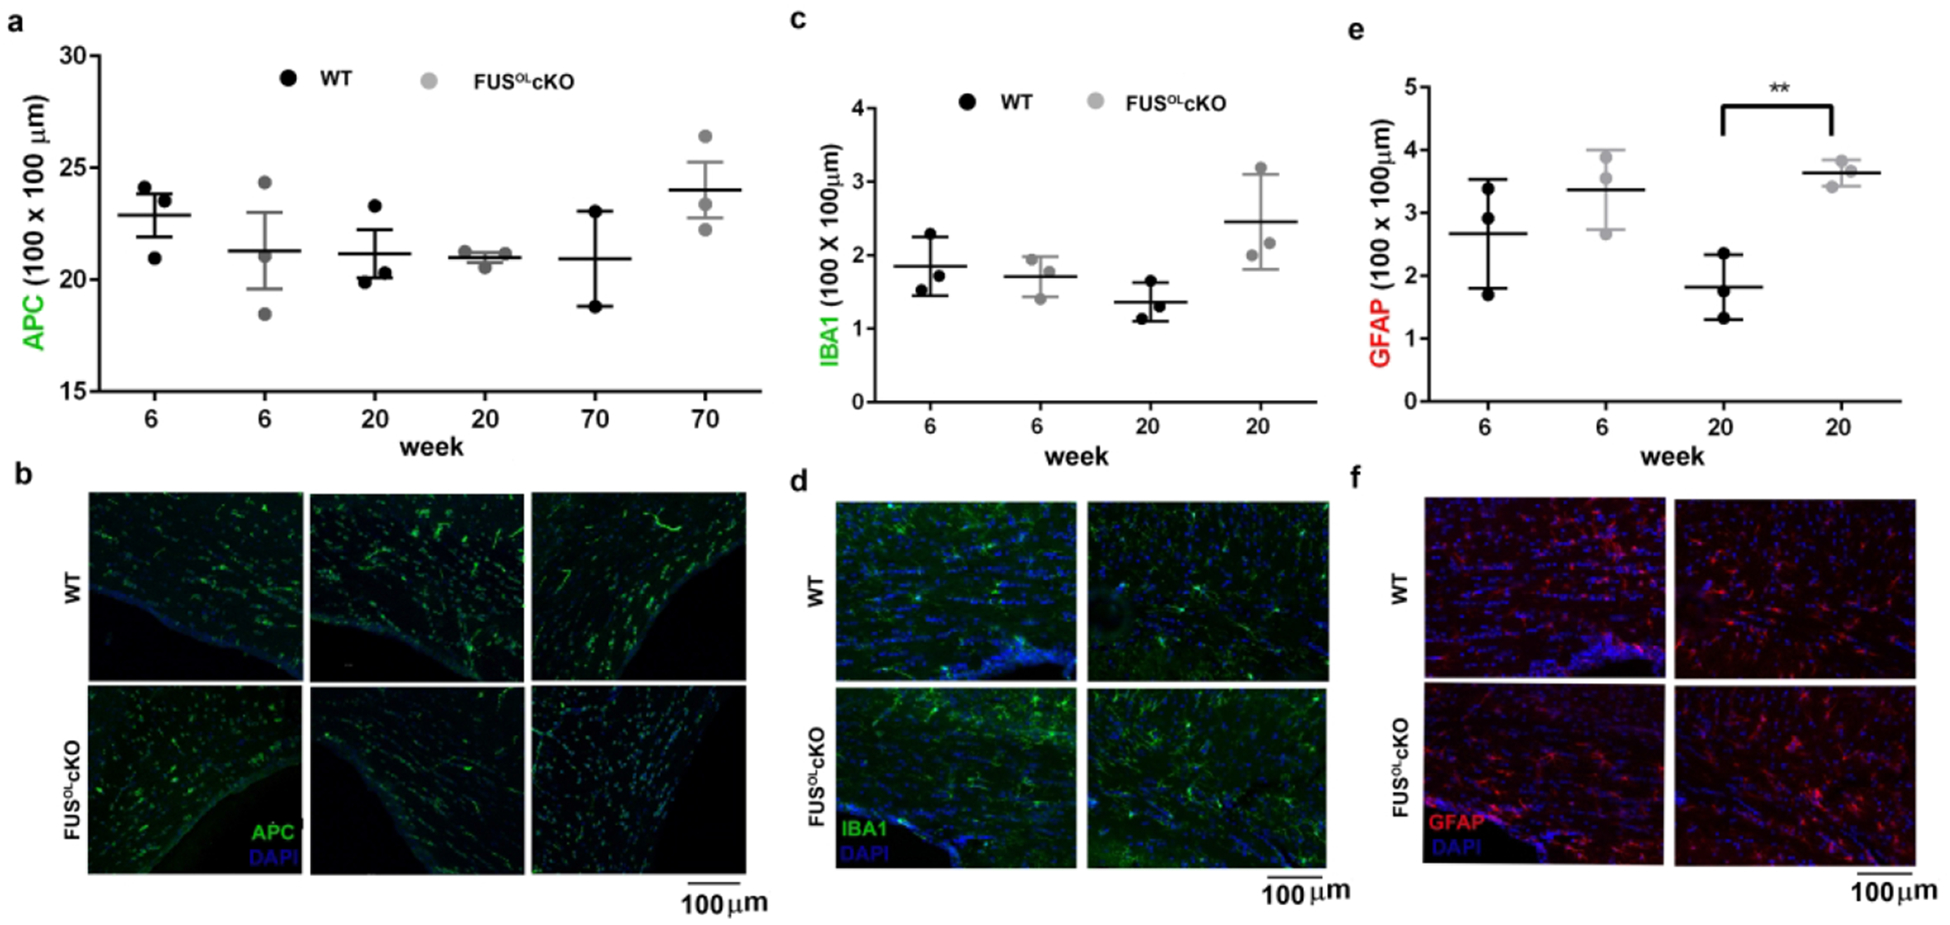
a. Graphs show the APC+ cell counts in 6, 20 and 70 weeks old FusOLcKO and WT callosa. b. Representative 20× epifluorescent images of callosum stained with APC. c and e. Graphs show the Iba1+ and GFAP+ cell counts in 6 and 20 weeks old FusOLcKO and WT callosa, respectively. d and f. Representative 20× epifluorescent images of callosum stained with Iba1 and GFAP, respectively.
Fus depletion in OL is associated with activation of Akt and cholesterol biosynthesis
To investigate the mechanisms underlying the increase in myelin deposition in the FusOLcKO, we have measured activation of PI3K/Akt and MEK/Erk1/2 pathways that regulate myelin deposition25,44–46 and the expression of the rate-limiting enzyme of cholesterol biosynthesis (3-hydroxy-3-methylglutaryl-coenzyme A reductase, HMGCR)47. WB of lysates prepared from callosa of 6 and 28 week old mice showed higher p-Akt/Akt levels in FusOLcKO vs. WT at both ages (Fig. 6a, p<0.005 at 6 weeks and p<0.01 at 28 weeks). To determine whether p-Akt is increased in OL, we costained sections of callosum with p-Akt and APC. The number of p-Akt+/APC+ cells was higher in callosum sections of the FusOLcKO vs. WT (Fig. 7, p<0.05). Since the number of APC+ cells was similar between genotypes (Fig. 1b), a greater percent of OL contain p-Akt in the FusOLcKO (Fig. 7), indicating an increase of mature OL with activated Akt. There is an overall increase in p-Akt+ cells (Fig. 7, p<0.05), which is in great part accounted for by the increase in p-Akt+/APC+ (38% in the WT vs. 57% in the FusOLcKO). No changes were detected in p-Erk1/Erk1 and p-Erk2/Erk2 by WB analysis (Fig. 6b). Phosphorylation of mTOR (Fig. 6c) and S6 RP (Fig. 6d), downstream targets of Erk1/2 and Akt, was similar between FusOLcKO and WT.
Figure 6. Phosphorylation of Akt and expression of HMGCR are increased in FusOLcKO callosum.
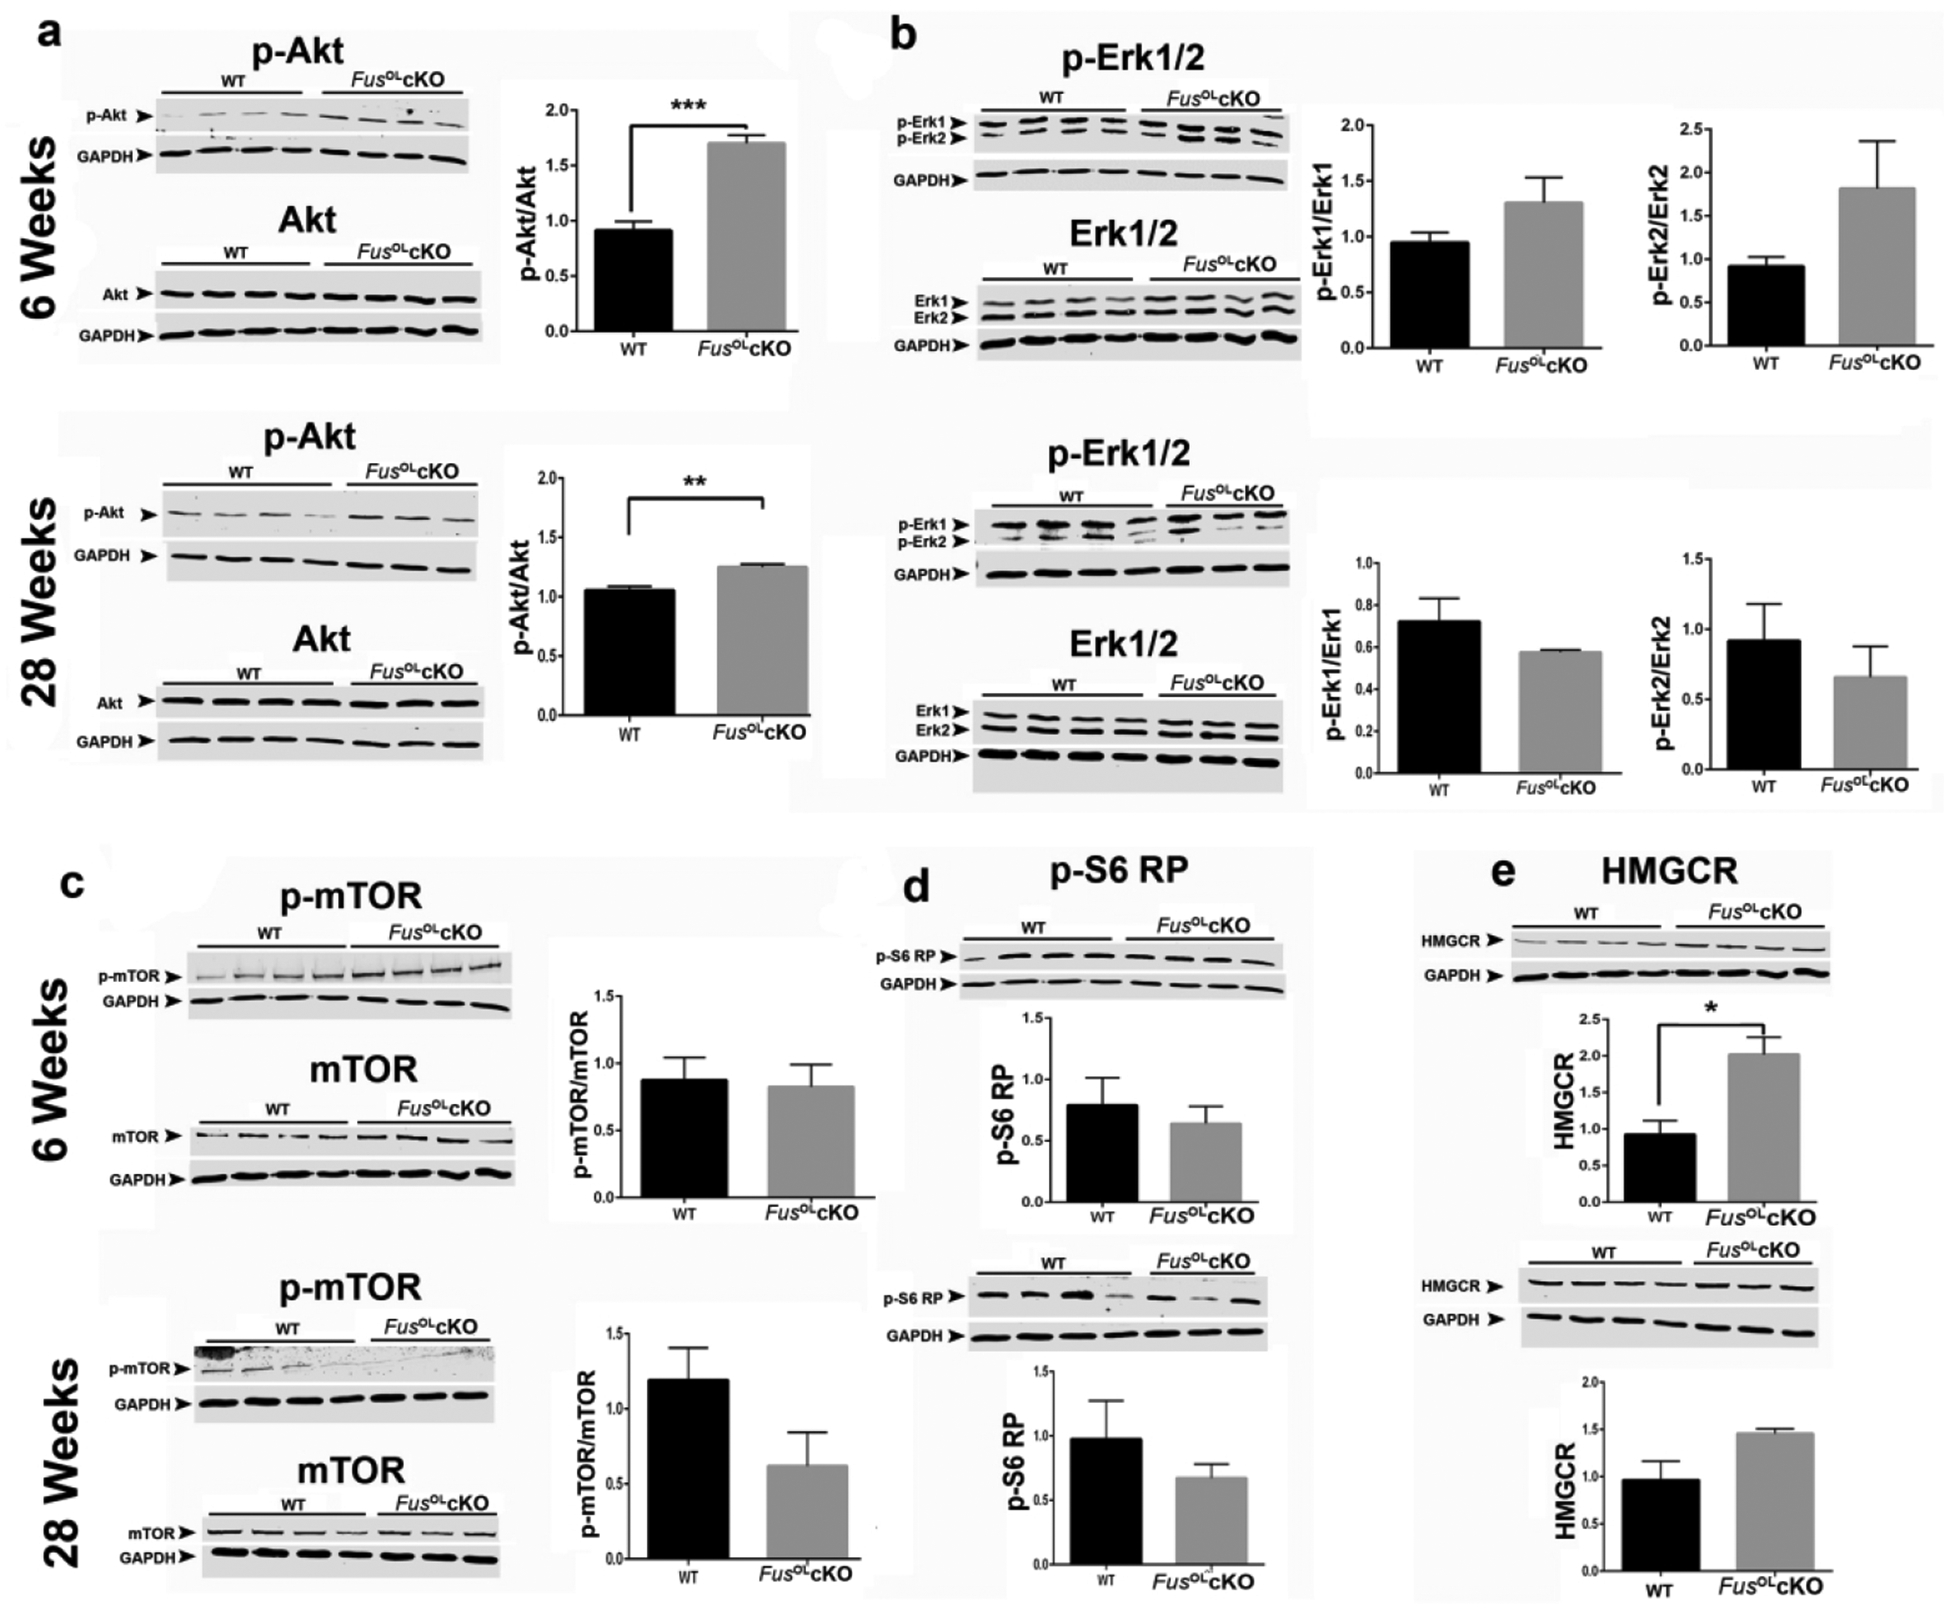
Representative Western blots of protein lysates prepared from 6 and 28 weeks old FusOLcKO and WT callosa (n=4) and probed with antibodies to: a. p-Akt and Akt, b. p-Erk1/2 and Erk1/2, c. p-mTOR and mTOR, d. p-S6 RP and e. HMGCR. The corresponding graphs show quantifications of protein levels corrected by the internal control (GAPDH). pAkt, pErk1/2 and p-mTOR were normalized to the total protein levels Akt, Erk1/2 and mTOR, respectively. Data represents the mean±SE. The p-Akt/Akt ratio is higher in the FusOLcKO vs. WT at 6 weeks (***p<0.001) and 28 weeks (**p<0.01). The expression of HMGCR is higher in the 6 weeks old FusOLcKO vs. WT (*p<0.05). Please note, the blots were run on the same gel and therefore have the same GAPDH loading control: 6 weeks - Akt, mTOR, Erk1/2, HMGCR; 6 weeks – pAkt, pmTOR, pErk1/2, pS6RP; 28 weeks – mTOR, HMGCR, Erk1/2; 28 weeks – pmTOR, pErk1/2, pSP6RP; 28 weeks – Akt; 28 weeks – pAkt.
Figure 7. Fus knockout is associated with increased number of p-Akt+ mature OL.
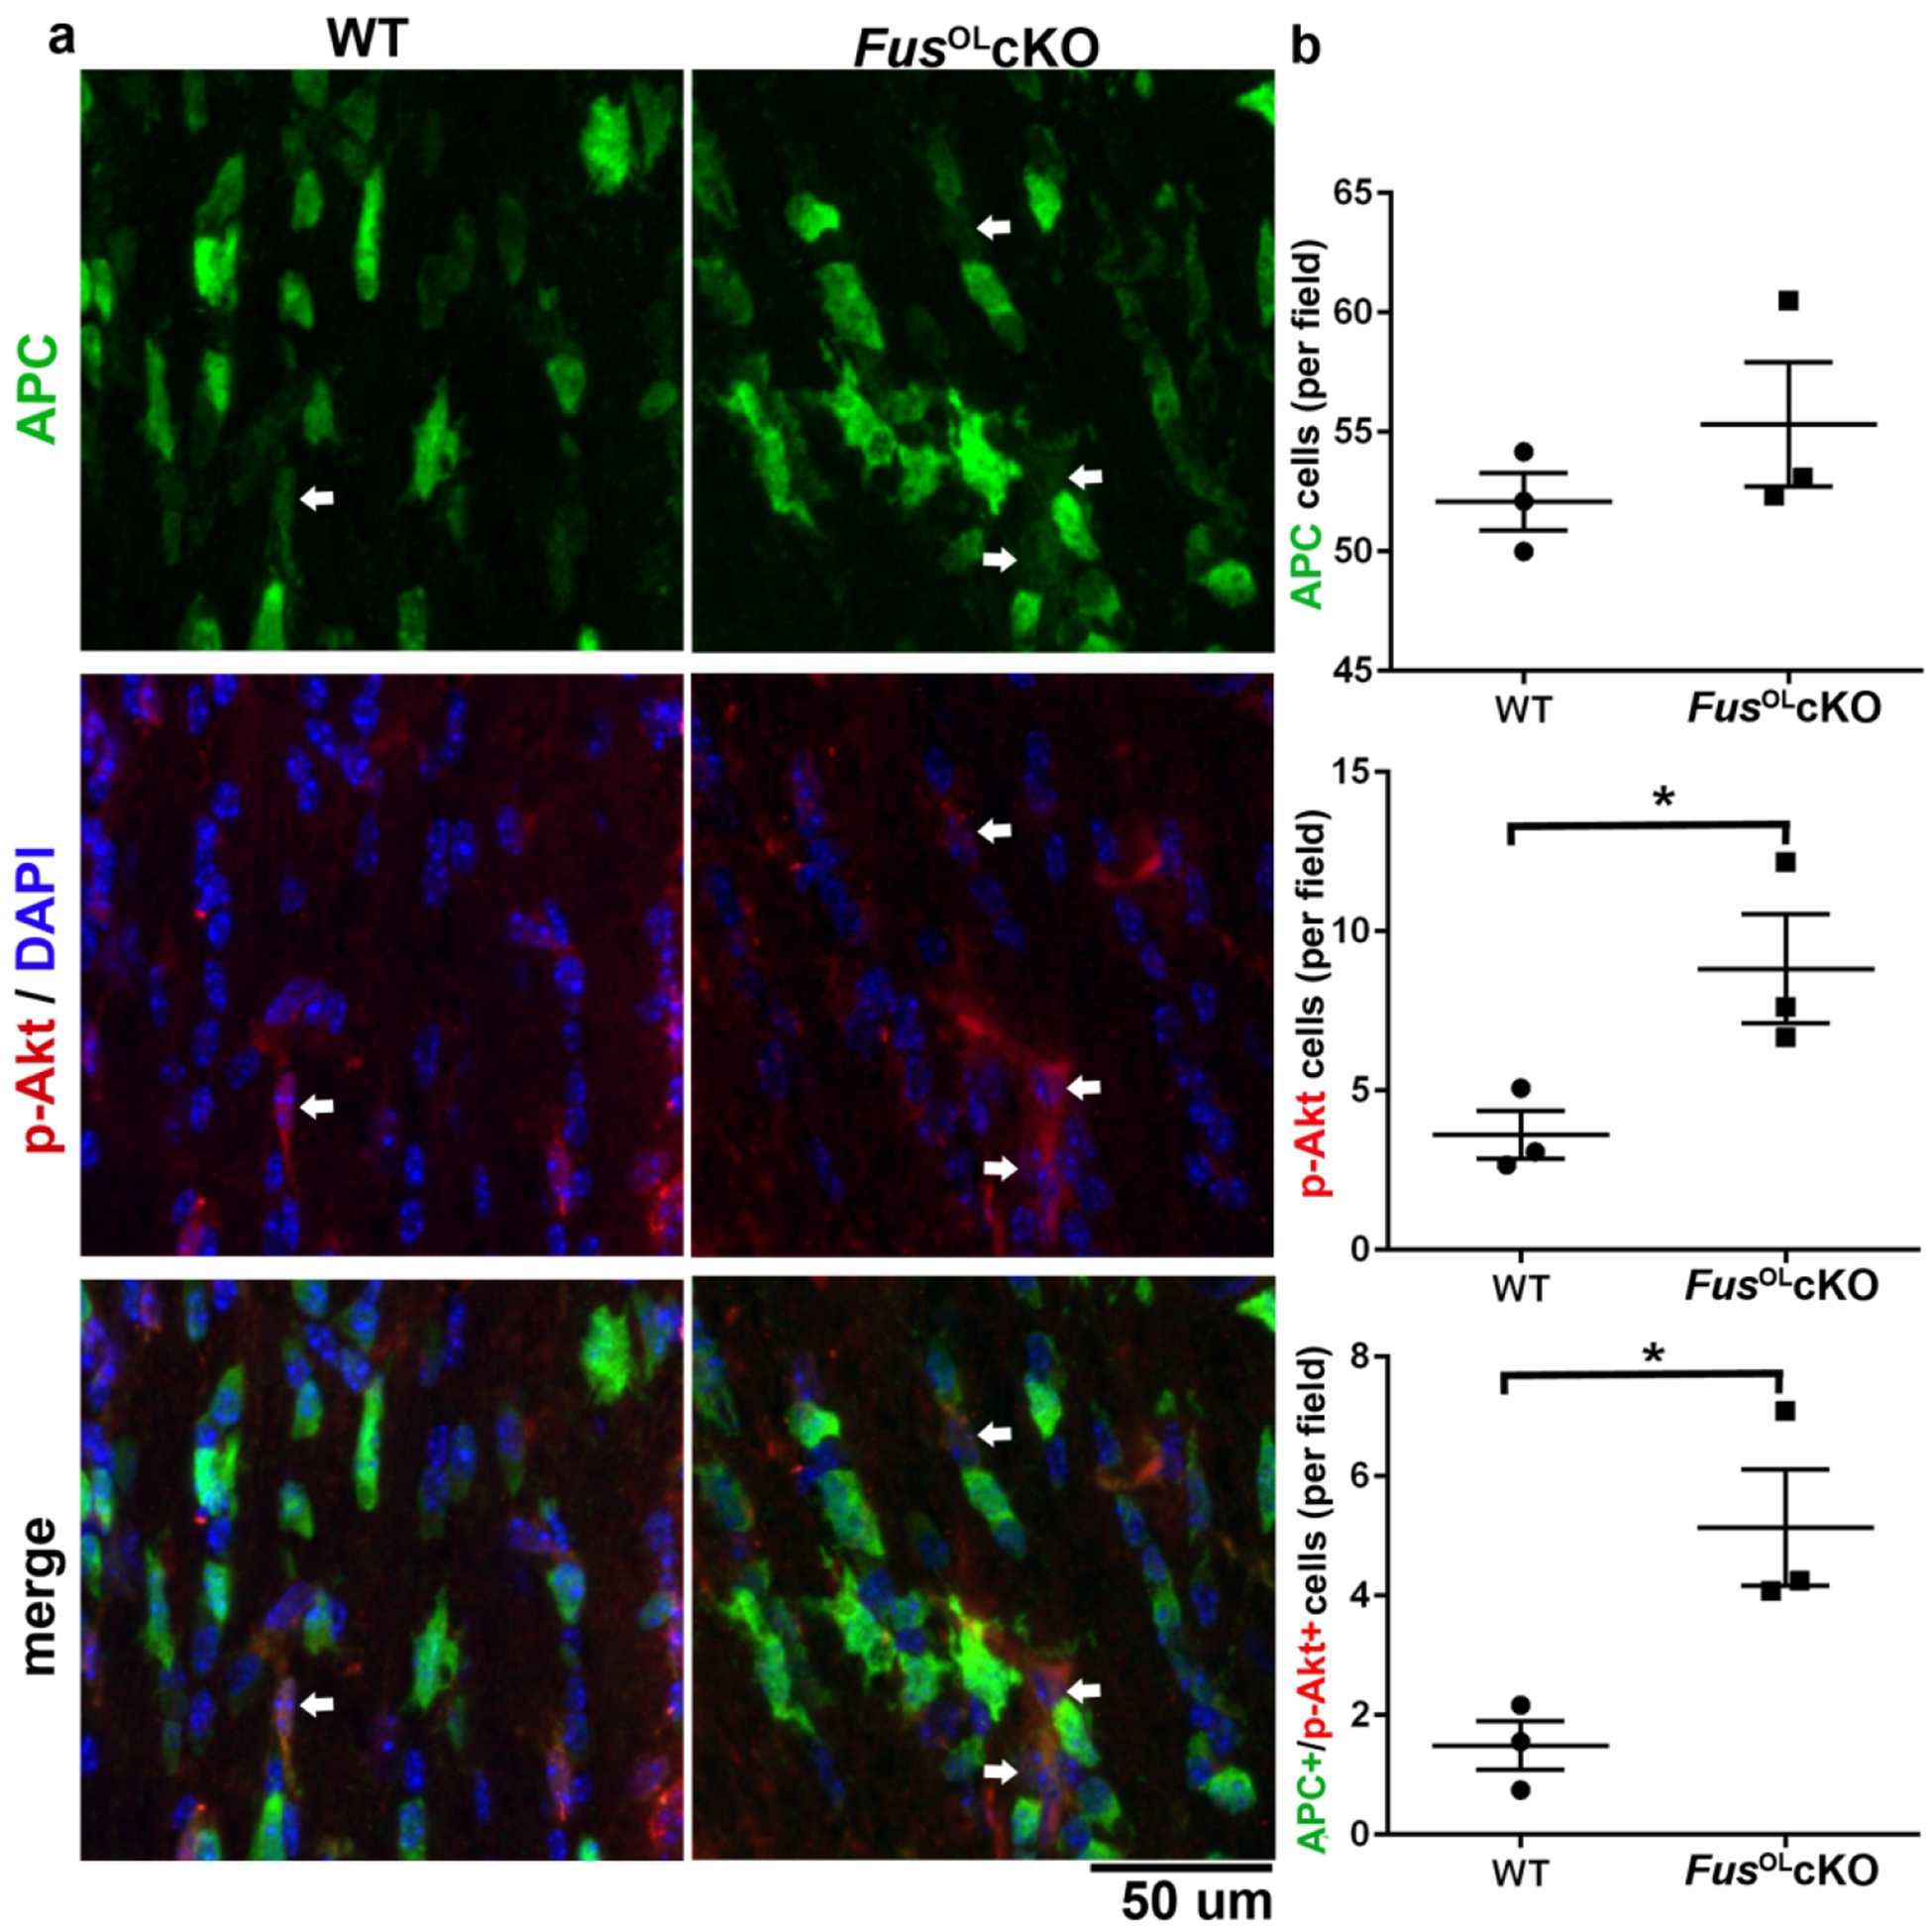
a. Representative 60× confocal images showing APC, p-Akt and merged stained sections of 6 weeks old FusOLcKO and WT callosa. Arrows point to p-Akt+/APC+ cells, arrowheads point to p-Akt+/APC− cells. b. Graphs represent the corresponding quantification of cell counts: APC+ (ns), p-Akt+ (*p<0.05) and p-Akt+/APC+ (*p<0.05).
A statistically significant increase in HMGCR expression was present in WB of lysates prepared from callosum of FusOLcKO vs. WT at 6 weeks (Fig. 6e, p<0.05). Increased expression was also present at 28 weeks although it did not reach statistical significance. The increase in HMGCR is associated with higher cholesterol content quantified by Mass Spectrometry in 6 weeks old FusOLcKO vs. WT callosum (Fig. 8, FusOLcKO=0.29±0.05 vs. WT=0.16±0.009, **p=0.001), consistent with increased cholesterol biosynthesis.
Figure 8. Cholesterol biosynthesis is increased in the FusOLcKO callosum.
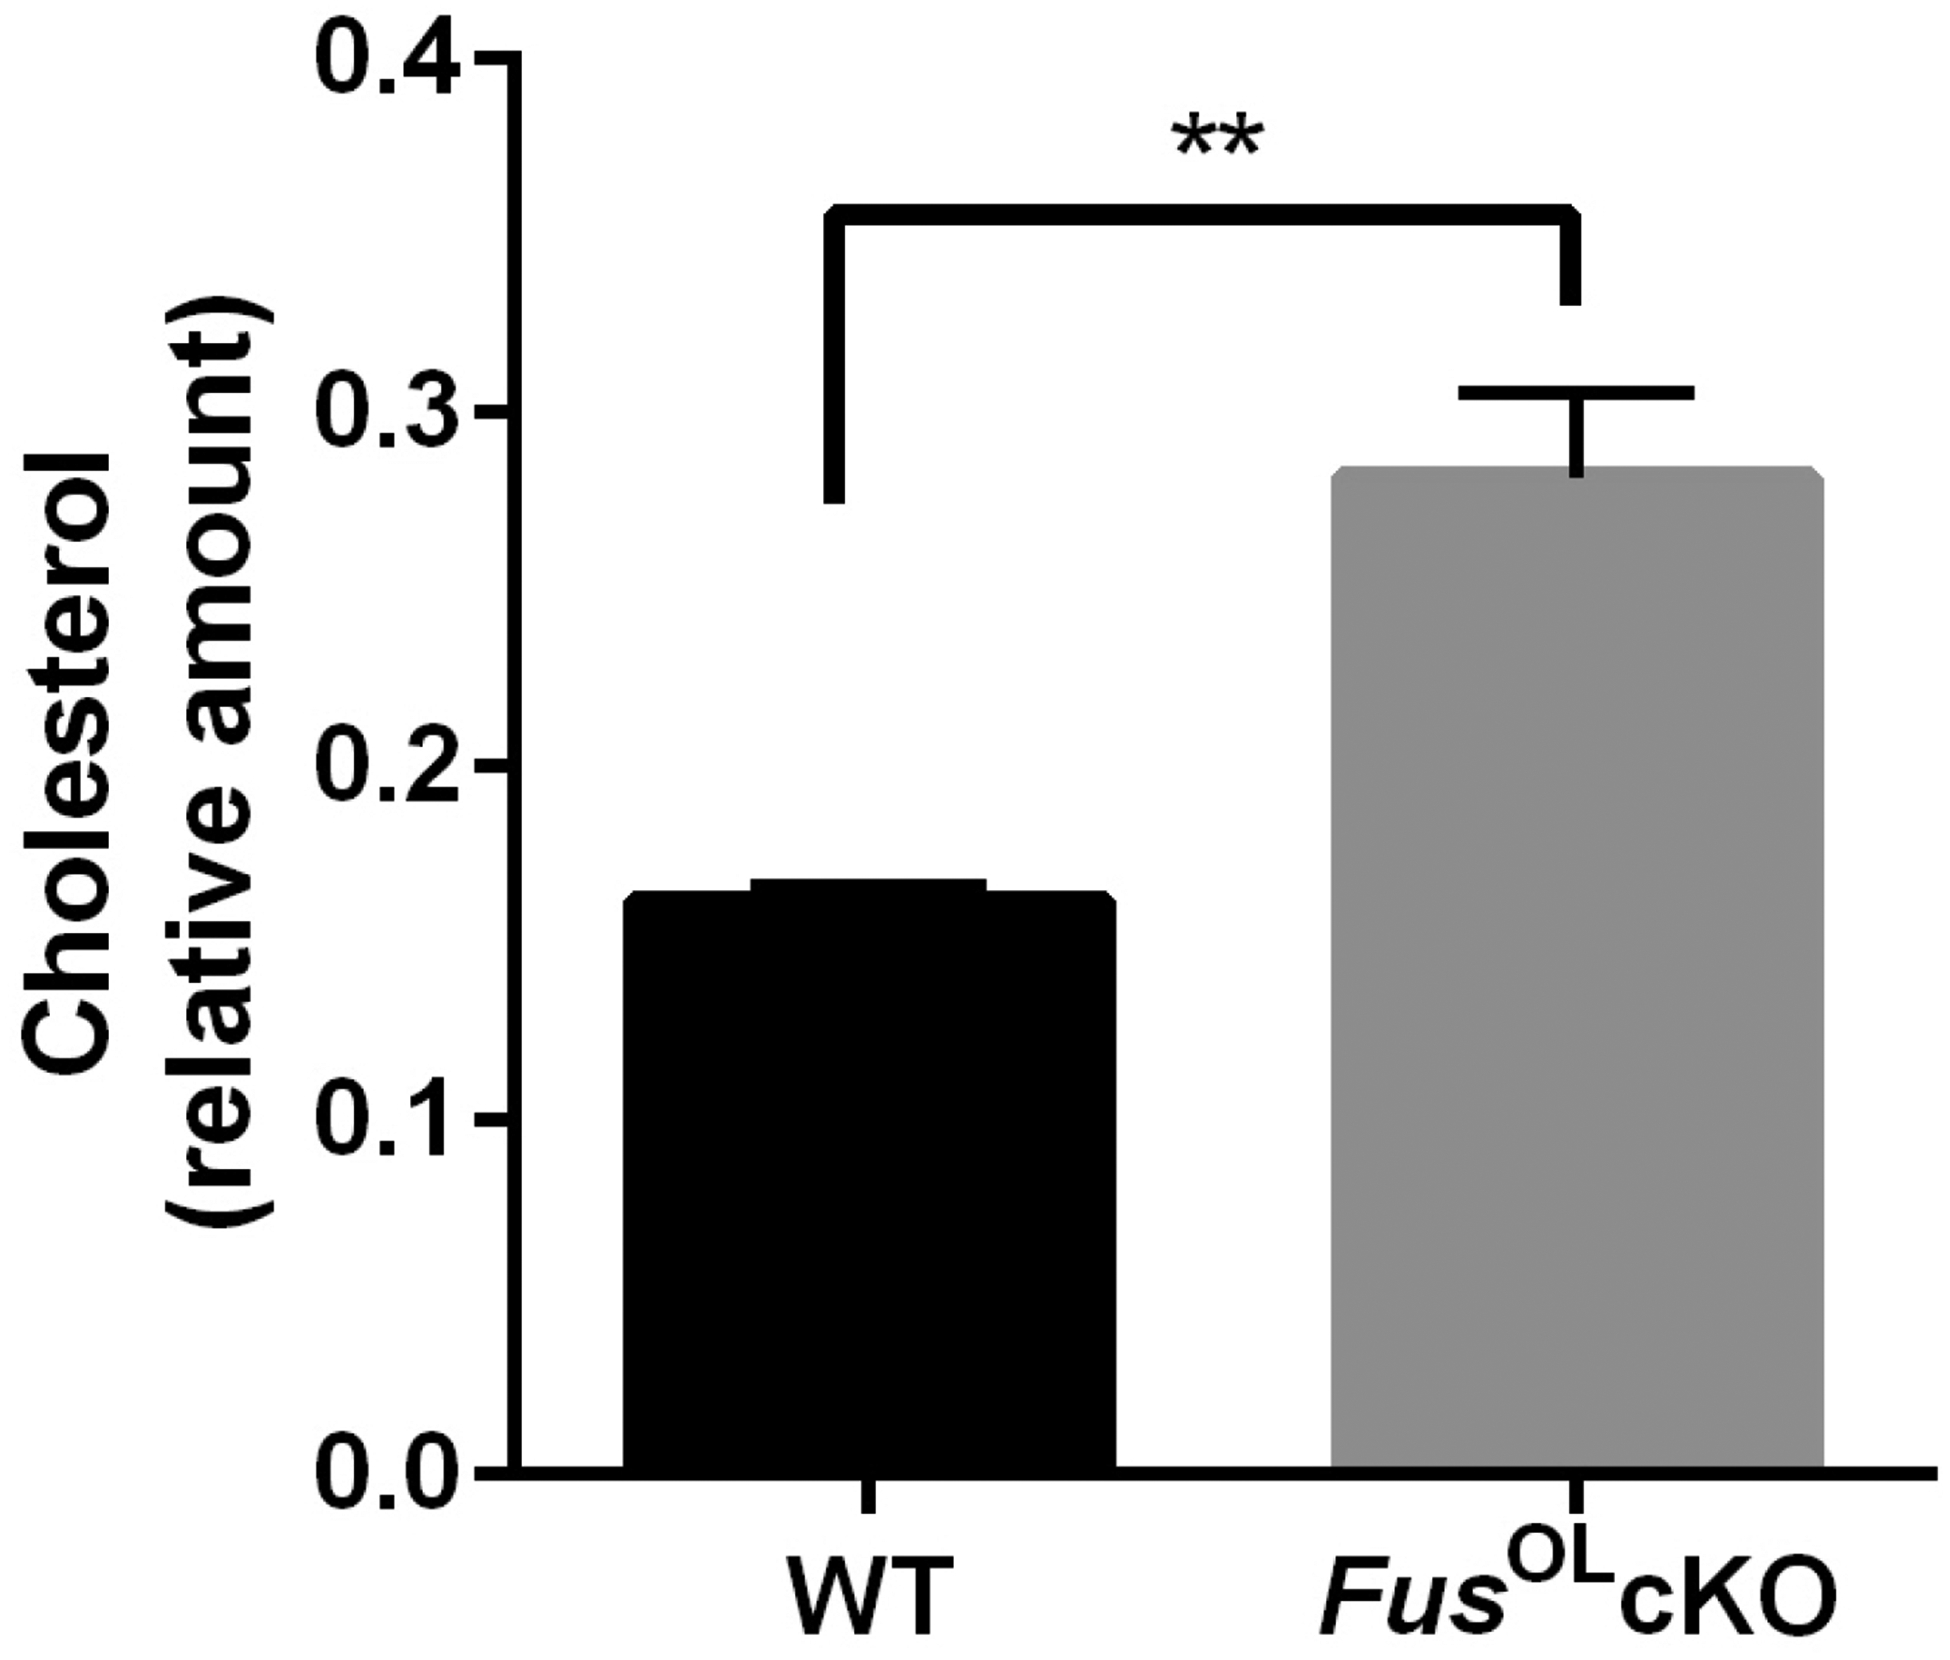
Cholesterol content was quantified by Mass Spectrometry in 6 weeks old FUSOLcKO and WT callosum (Metabolomics and Lipidomics Core, U Pittsburgh). Bar graphs show the mean±SE of the peak area of cholesterol normalized to the peak area of cholesterol-d7 and tissue weight (relative amount) (**p<0.01).
Collectively, the data show activation of PI3K/Akt pathway in OL and increased cholesterol biosynthesis resulting from activation of HMGCR in white matter tracts leading to hypermyelination.
Fus dependent regulation of rate limiting enzyme of cholesterol biosynthesis and myelin genes
Because FUS regulates transcription and RNA stability, we examined whether depletion of FUS leads to transcriptional activation of HMGCR and myelin genes. Transcript levels of HMGCR, quantified by RT-qPCR of RNA prepared from callosum were significantly higher in FusOLcKO vs. WT at 6 and 28 weeks (Fig. 9a,b, *p<0.05) in keeping with the protein expression. In contrast, transcripts of major myelin proteins, MBP, MAG and PLP were similar in FusOLcKO vs. WT callosa (Fig. 9a, b). To determine whether translation of myelin protein transcripts7,8 is affected by Fus depletion, we measured MBP, MAG and PLP protein expression. MBP, MAG and PLP protein levels were similar in WB of lysates of callosa and cervical cord FusOLcKO callosa vs. WT (Fig. 10). These data suggest that depletion of Fus regulates HMGCR gene expression, while it has no effect on myelin protein gene transcript expression and translation.
Figure 9. Fus knockout increases HMGCR transcript levels, but not myelin gene transcripts.
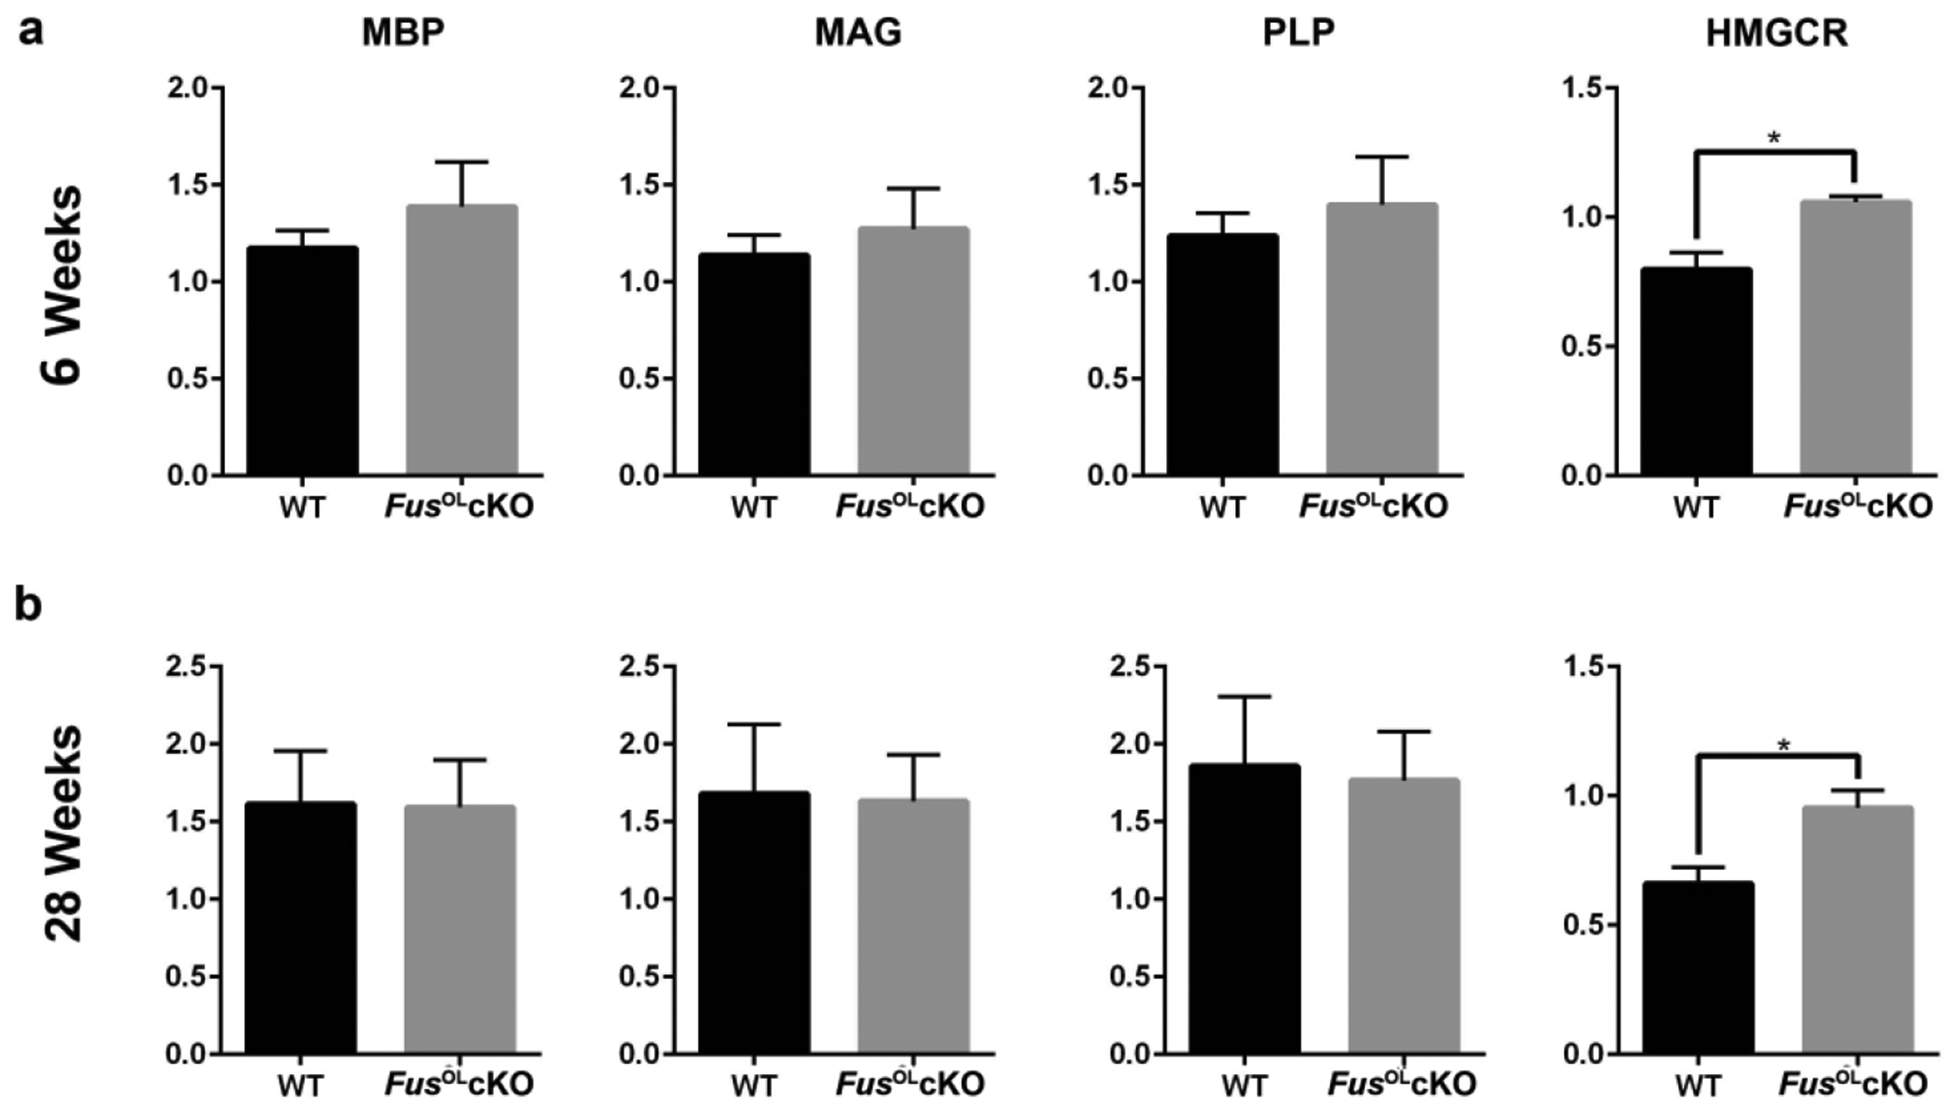
RT-qPCR for MBP, MAG and PLP, HMGCR and β-actin was performed using RNA extracted from: a. 6 weeks and b. 28 weeks old FusOLcKO and WT callosa (n=3). Bar graphs represent quantifications of transcripts normalized to β-actin internal control. HMGCR transcripts were higher in 6 and 28 weeks old FusOLcKO vs. WT (*p<0.05). No statistically significant differences were present in myelin gene transcripts between the two genotypes.
Figure 10. Myelin protein expression is not affected by Fus knockout.
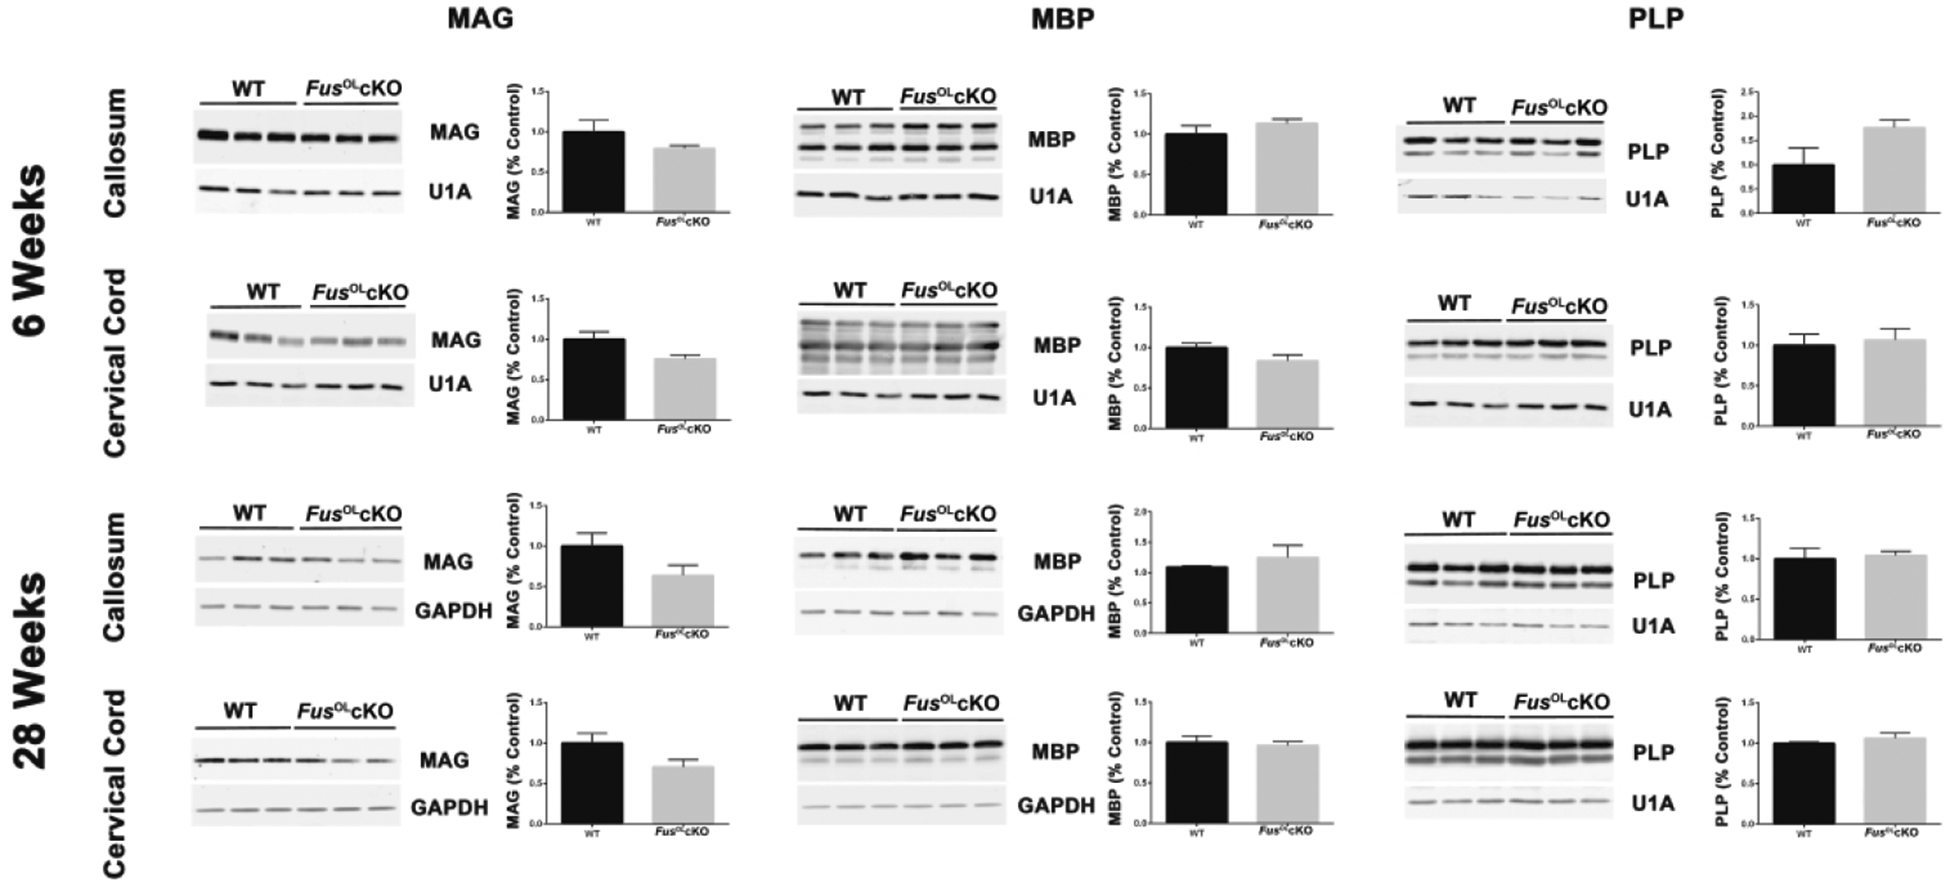
Representative Western blots of lysates of myelin proteins MAG, MBP, PLP and loading controls GAPDH or U1A prepared from dissected 6 and 28 weeks old FusOLcKO and WT callosa and cervical cords (n=3). Proteins from 6 weeks mice were separated in 13% ADS-acrylamide gels and probed with rabbit MBP Ab (Table S1). Proteins from 28 weeks mice were separated in 10% SDS-acrylamide gels and probed with mouse MBP MAb (Table S1). Bar graphs represent quantification of myelin protein levels normalized to the internal control and expressed as percent of WT, set at 1. No statistically significant differences were present.
Next, we have examined whether HMGCR and genes involved in cholesterol synthesis and metabolism contain Fus binding motifs by bioinformatics analysis using FIMO (Find Individual Motif Occurrences in MEME)41. We found that 36 of 38 cholesterol metabolism genes contain Fus binding motifs (Supplementary Dataset). Three matches for the Fus binding motif42 were identified in introns 6, 9 and 12 of the HMGCR gene (Supplementary Dataset). In addition, 12 of the cholesterol metabolism genes including HMGCR were reported to contain Cross-linked Clusters48, further supporting that these transcripts are Fus targets. Collectively, the data suggest a direct role of Fus in regulating cholesterol metabolism genes.
DISCUSSION
The main goals of this study were to establish the role of FUS in oligodendrocyte cell function by selectively depleting Fus in OL and to examine whether Fus deficient OL contribute to neurological manifestations associated with FTLD. We have discovered a novel role of Fus in controlling myelin deposition, which is associated with activation of Akt and greater expression of the rate-limiting enzyme for cholesterol biosynthesis. Phenotypically, the FusOLcKO mice exhibit enhanced exploration and novelty-induced motor activity without deficits in working memory or heightened anxiety that in part are reminiscent of some of the FTLD clinical manifestations.
Fus and myelin deposition.
Depletion of oligodendrocytic Fus leads to greater myelin deposition across all myelinated axons and to a selective increase in myelination of small caliber axons (Figure 5). These findings suggest that both myelin ensheathment and axon wrapping are increased in the absence of oligodendrocytic Fus. This phenotype is not associated with changes in oligodendrocyte lineage progression, as shown by the presence of similar cell counts for OPC and OL (Figure 1). Furthermore, depletion of Fus is specific for oligodendrocyte lineage and is mostly detected in OL and in some NG2 cells. CNP promoter activation in late/adult NG2 cells was previously reported49 and explains the depletion in NG2 cells. A small percent of neurons labeled by NeuN were Fus depleted (SFig. 2) in cortex, hippocampus and motor neurons, likely due to leakiness of the CNP promoter. Since the number of Fus depleted neurons is small and there are no differences in the number of total neurons, we would not expect this small population of Fus depleted neurons to have a functional impact (see also discussion below).
Since the number of mature OL is not increased, intrinsic mechanisms that regulate myelin wrapping/ensheathment deposition are engaged by Fus depletion at the OL cell level. We have examined both PI3K/Akt/mTOR and MEK/Erk1/2 pathways known to regulate myelin deposition25,44–46,50,51 and show an increase of Akt phosphorylation in Fus deficient mature OL, suggesting activation of the PI3K/Akt pathway. The increase in p-AKT/APC+ cells accounts for most of the increase in total p-Akt+ cells, however, there is a small increase in p-Akt+/APC− cells. The relevance of this finding remains to be explored. Phosphorylation of the downstream targets of p-Akt, mTOR and S6 RP, which regulate myelin protein translation44,47,50, was not increased (Fig. 6c, d). In keeping with the absence of mTOR activation, myelin protein expression was not increased in the FusOLcKO mice (Figure 9). In contrast, the rate-limiting enzyme of cholesterol biosynthesis HMGCR was expressed at higher levels in the FusOLcKO callosum and was associated with higher cholesterol content. The expression of HMGCR is increased through transcriptional activation and/or message stability mediated by Fus direct binding to HMGCR transcript (Supplementary Dataset). Interestingly, myelin gene transcripts and myelin protein translation and synthesis were not affected by Fus depletion (Figures 9 and 10).
Bioinformatics analysis of HMGCR and of genes involved in cholesterol metabolism identified the presence of Fus binding motifs in these genes, some of which are part of the squalene biosynthetic pathway that leads to cholesterol. Furthermore, HMGCR and several of the cholesterol metabolism related genes were shown to have Cross Linked Clusters48 supporting further that these transcripts are bona fide targets of Fus. Future studies will investigate the Fus mediated regulation of cholesterol metabolism pathways.
Cholesterol is highly enriched in myelin and plays a critical role in myelin formation and myelin protein synthesis52,53, but is also important for assembly of signaling molecules in lipid platforms54–56. We postulate that the increase in cholesterol resulting from activation of HMGCR leads to cholesterol-mediated assembly of signaling molecules such as PI3K/Akt47. Future studies using gene expression profiling will help in assessing the functional impact of this activation and that of other genes.
A striking feature of the hypermyelination phenotype is greater myelination of small diameter axons. An age-dependent increase in myelinated small diameter axons occurs in WT and FusOLcKO, however, the percent of myelinated small diameter axons is consistently higher (approximately twofold) in the FusOLcKO vs. the WT (Fig. 4d). The greater myelination of small diameter axons could result from myelination of small diameter axons that are not myelinated in normal circumstances. In the corpus callosum, approximately 60–70% of axons are unmyelinated and these axons do not exceed 0–0.6 μm in diameter57,58, suggesting that the increase in myelinated axons seen in the FusOLcKO may reflect a reduction of unmyelinated fibers.
Whether a similar increase in myelinated small caliber axons occurs in other brain areas such as intracortical layers and other connection tracts remains to be investigated. Overall, such an increase might lead to greater connectivity and neural transmission speed. Interestingly, the percent of myelinated axons was lower in one class of axons with diameter >1μ in the FusOLcKO vs. WT (Figure 4). The significance of this finding is unclear, it is only present at 6 and 20 weeks old mice and it is not affecting the same diameter bracket. The Akt overexpressor mice, AktDD25 and CNP-Akt50also showed more hypermyelinated axons in the small axon diameter range50, supporting the hypothesis that Akt-mediated myelin deposition is responsible for the hypermyelination of the FusOLcKO mice. However, unlike the Akt over-expressor mice, myelin proteins are not increased in the FusOLcKO (Figure 10), suggesting that different mechanisms of myelin deposition are playing a role, possibly driven by lipid biosynthesis.
On the basis of the critical role that cholesterol has on myelin synthesis and growth, we propose that the increase in cholesterol biosynthesis mediated by HMGCR would enhance myelin synthesis and activation of Akt through lipid platform activation of signaling pathways47,56 (Figure 10). Two questions arise from our results and remain to be investigated in future studies. Firstly, whether loss of Fus function affects expression of genes involved in regulating the PI3K/Akt pathway needs to be investigated by gene profiling studies. Secondly, since the known downstream targets mTOR and S6RP are not activated, how phosphorylation of Akt leads to hypermyelination remains to be fully elucidated.
Overall, depletion of Fus in OL is not associated with changes in other glia, except that a drop in GFAP+ cells in 20 vs. 6 weeks WT mice is not detected in the FusOLcKO (Fig. 5e,f). In previous studies, we showed that GFAP+ cells remain constant in callosum of 16 and 8 weeks old WT mice59, hence, further analysis is needed to clarify the significance of the decrease in the Fusfl/fl.
Fus and motor hyperactivity.
The FusOLcKO mice manifest novelty-induced hyperactivity and enhanced exploration by vertical behavior in the open filed that is not accounted for by changes in anxiety. This behavior is most prominent in younger mice but is also present in aged mice. We have used the running wheel test for short periods 12 hrs during the dark period when rodents are more active to further assess motor performance in the regular and complex wheel. FusOLcKO and WT mice both ran faster in the early hours after dark (data not shown), covered similar distances and with similar speed in both regular and complex wheel (Fig. 3a, b). These data suggest that the FusOLcKO motor performance is not better than that of WT despite their greater novelty-induced activity in the open field. It is possible, however, that testing the mice over longer periods of time could allow to show differences in other motor measures such as stamina, adaptive motor learning that were not captured in the short testing period used in these studies. In the Y maze test, the FusOLcKO mice manifested a small increase in activity/exploration that, however, did not reach significance, except for vertical behavior at an early age (Fig. 3c–f). In light of these results, we propose the interpretation that the novelty-driven hyperactivity in the open field is the result of greater impulsivity, a feature associated with FTLD. Additional behavior testing will be needed to assess impulsivity.
The FusOLcKO mice show hyperactivity similarly to mice carrying constitutive and conditional depletion of Fus in hippocampal neurons13–15,60. Since we observed only ~2% Fus depleted neurons in hippocampus and in cortex, it is unlikely that the very small number of Fus depleted neurons (SFigure 2) accounts for or contributes to the observed motor phenotype. The slightly higher number of FUS depleted MN in the FusOLcKO is not likely to be functionally relevant, especially in consideration that selective depletion of Fus in cortical and MN cholinergic neurons did not result in a motor phenotype12. We propose that the phenotypic similarities rather suggest a role of Fus depleted OL to the hyperactivity and potential impulsivity associated with loss of Fus function. Two possibilities can be conceived regarding how might FUS deficient OL lead to the behavior phenotype. One possibility is that the hypermyelination of small diameter axons results in enhanced neural connectivity leading to greater cortical circuitry performance. Another possibility is an effect on synaptic connectivity and activity/strength. In keeping with this possibility, myelination plays a critical role in excitatory synapse formation and strength during development, which would lead to greater neuronal activity61. Future studies using electrophysiology and synapse analysis will assess this potential mechanism. Finally, an intriguing relationship exists between glia-derived cholesterol and synaptogenesis. Cholesterol secreted by astrocytes was reported to be exogenously supplied to neurons and be essential for synaptic formation62,63. Although the published data report astrocyte derived cholesterol, it is tempting to speculate that there could be a role for OL derived cholesterol in synaptic connectivity in the FusOLcKO.
In summary, these studies show a novel role of oligodendrocytic FUS in controlling myelin deposition through activation of Akt and enhanced cholesterol biosynthesis. Harnessing the FUS effect on myelin deposition by developing compounds that modulate FUS activity may improve re-myelination after injury such as stroke, TBI or demyelination. Finally, the behavioral phenotype of the FusOLcKO is reminiscent of manifestations associated with FTLD, suggesting that extrinsic mechanism(s) mediated by FUS loss of function in OL may play a role in this disorder.
Supplementary Material
Figure S1. Generation of the Fus floxed mouse line. I. Schematic of the Fus targeted allele with selectable markers flanked by flippase sites (FRT) and exons 4–6 flanked by LoxP sites before (A), after flippase mediated recombination that deletes all selectable markers (B), after Cre recombination that removes ex4–6 (C). II. Representative agarose gel shows the PCR products amplified from 6 tail DNA samples from Fusfl/+xFusfl/+ litter. The WT PCR product is 513 bp and the targeted flippase recombined allele product is 573 bp. 2, 3 are homozygous (fl/fl) for the Fus floxed allele. 5,6 are heterozygous (fl/+) and 1, 4 are WT (+/+). The identity of the bands was confirmed by DNA sequencing.
Figure S2. Neuronal expression of Fus in cortex, hippocampus and the cervical cord of 6 weeks old FusOLcKO. Representative 20× epifluorescent images of NeuN and Fus labeled neurons in WT and FusOLcKO motor cortex (layers IV-VI) (a), CA3 dentate gyrus of the hippocampus (b), and anterior horns of the cervical cord (c). a. and b. The bar graphs show the mean±SE of NeuN+, NeuN+/Fus+ cell counts and the percent of NeuN+/Fus+ cells. c. The bar graphs show the mean±SE of NeuN+, NeuN+/Fus+ α motor neurons and the percent of NeuN+/Fus+ α motor neurons, identified by nuclear area (see Methods).
Figure S3. Uncropped Western blots of signal proteins at 6 and 28 weeks.
Table S1. List of antibodies used for Western Blots
Supplementary Dataset FIMO analysis.
Figure 11. Model of how Fus depletion leads to hypermyelination.
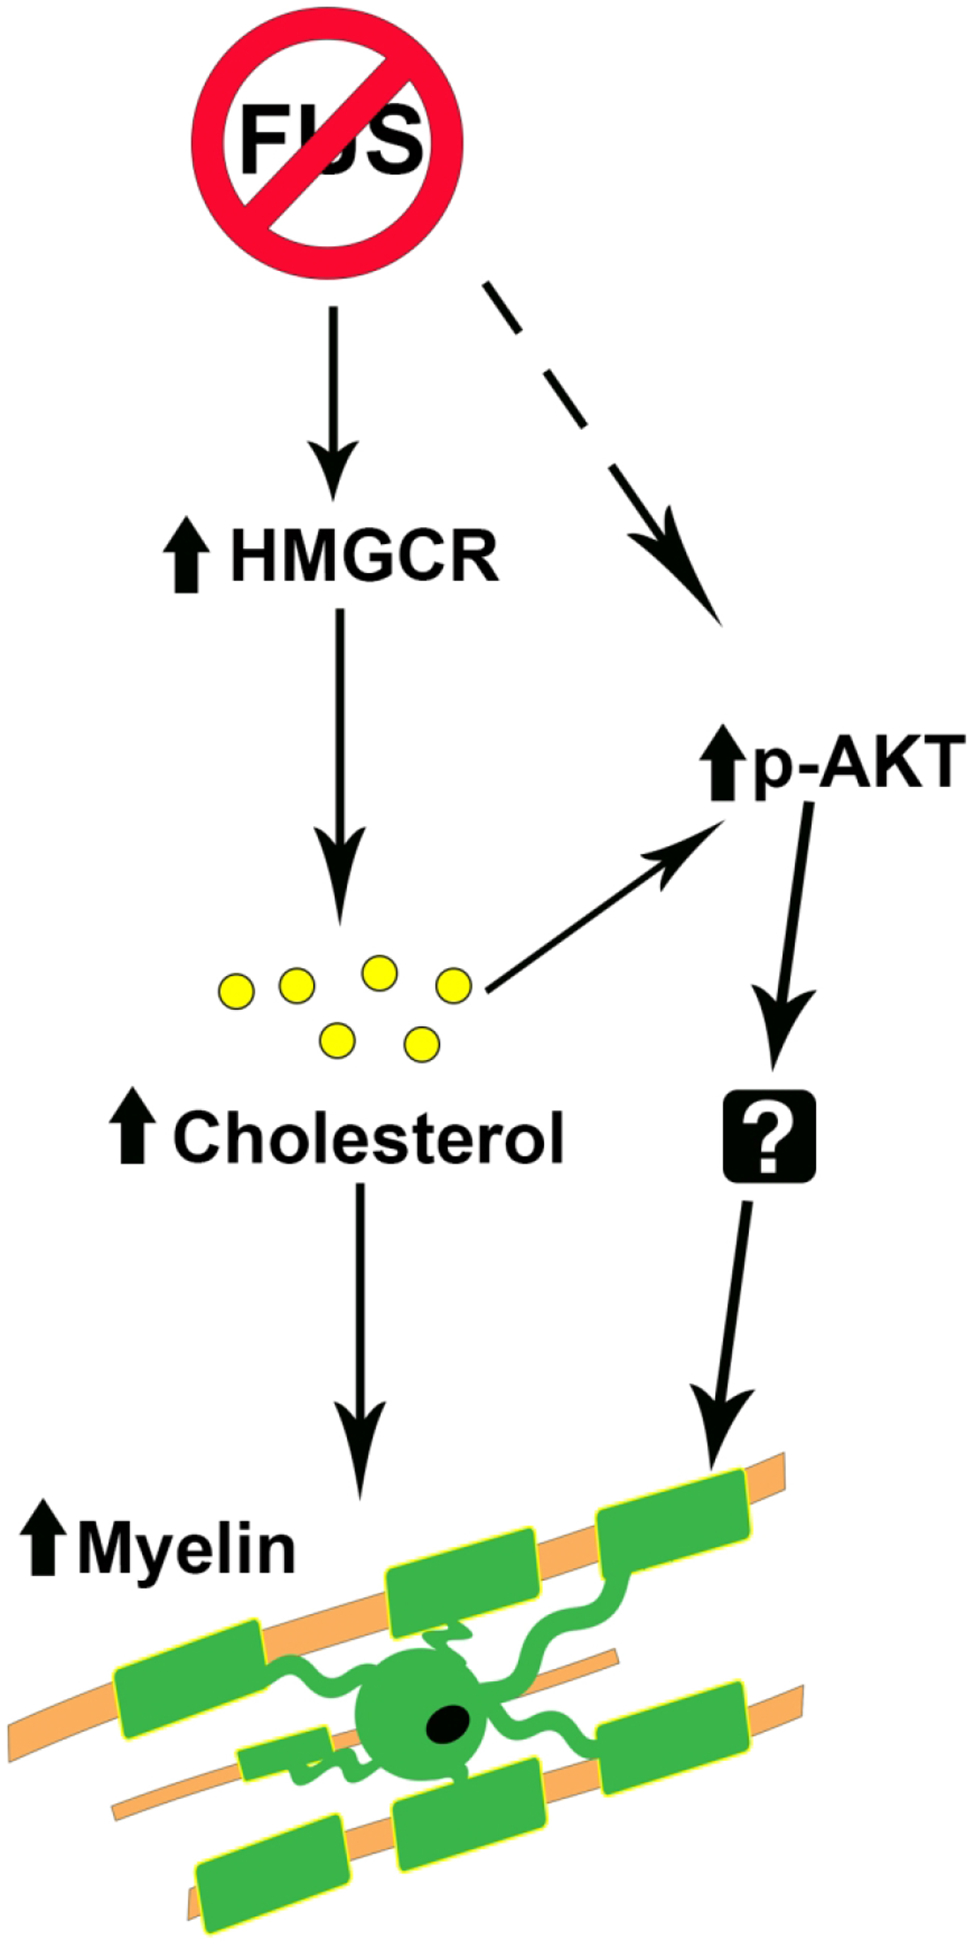
We propose that HMGCR gene expression is increased by FUS loss of function resulting in higher cholesterol, which leads to increased myelin synthesis and activation of p-Akt through lipid platform assembly. Additional genes differentially regulated by Fus depletion upstream of p-Akt activation and the downstream targets of p-Akt remain to be investigated.
Main Points:
Myelin thickness and myelinated small axons are increased in FusOLcKO mice
Activation of HMGCR expression leads to higher cholesterol in FusOLcKO mice
Akt is activated in FusOLcKO mice
FusOLcKO mice exhibit enhanced exploration and motor activity
Acknowledgments:
We thank Drs. T. Kozai and D. Sun, University of Pittsburgh for critical reading of the manuscript and Dr. C.B. Rogers, Nikon Instruments Inc. for assistance with Denoise.ai application. The Authors have no conflict of interest.
Funding: Pilot grant from University of Kentucky (FC and HZ), I21 BX003237-01 (FC and HZ) and Supplements (FC), start-up funds from VA Pittsburgh (FC), R01S077284, I01BX002149 (HZ), R21 NS104384-01A1, R33NS106087, R01NS095884 (QP), Dr. S. Watkins, Center for Biologic Imaging, University of Pittsburgh (1S10OD019973-01, 1S10RR019003-01, 1S10RR016236-01), Behavioral Testing was performed at the Rodent Behavioral Analysis Core (RBAC), University of Pittsburgh supported in part by internal funding from the Department of Neurobiology, Cholesterol quantifications were performed by the Health Sciences Metabolomics and Lipidomics Core, University of Pittsburgh (S100D023402).
Bibliography
- 1.Luo Y, et al. EWS and FUS bind a subset of transcribed genes encoding proteins enriched in RNA regulatory functions. BMC genomics 16, 929 (2015). [DOI] [PMC free article] [PubMed] [Google Scholar]
- 2.Yang L, Gal J, Chen J & Zhu H Self-assembled FUS binds active chromatin and regulates gene transcription. Proceedings of the National Academy of Sciences of the United States of America 111, 17809–17814 (2014). [DOI] [PMC free article] [PubMed] [Google Scholar]
- 3.Schwartz JC, et al. FUS binds the CTD of RNA polymerase II and regulates its phosphorylation at Ser2. Genes & development 26, 2690–2695 (2012). [DOI] [PMC free article] [PubMed] [Google Scholar]
- 4.Zhou Y, Liu S, Liu G, Ozturk A & Hicks GG ALS-associated FUS mutations result in compromised FUS alternative splicing and autoregulation. PLoS genetics 9, e1003895 (2013). [DOI] [PMC free article] [PubMed] [Google Scholar]
- 5.Ishigaki S, et al. Position-dependent FUS-RNA interactions regulate alternative splicing events and transcriptions. Scientific reports 2, 529 (2012). [DOI] [PMC free article] [PubMed] [Google Scholar]
- 6.Rogelj B, et al. Widespread binding of FUS along nascent RNA regulates alternative splicing in the brain. Scientific reports 2, 603 (2012). [DOI] [PMC free article] [PubMed] [Google Scholar]
- 7.Kamelgarn M, et al. ALS mutations of FUS suppress protein translation and disrupt the regulation of nonsense-mediated decay. Proceedings of the National Academy of Sciences of the United States of America 115, E11904–E11913 (2018). [DOI] [PMC free article] [PubMed] [Google Scholar]
- 8.Ratti A & Buratti E Physiological functions and pathobiology of TDP-43 and FUS/TLS proteins. Journal of neurochemistry 138 Suppl 1, 95–111 (2016). [DOI] [PubMed] [Google Scholar]
- 9.Vance C, et al. Mutations in FUS, an RNA processing protein, cause familial amyotrophic lateral sclerosis type 6. Science 323, 1208–1211 (2009). [DOI] [PMC free article] [PubMed] [Google Scholar]
- 10.Fiesel FC & Kahle PJ TDP-43 and FUS/TLS: cellular functions and implications for neurodegeneration. The FEBS journal 278, 3550–3568 (2011). [DOI] [PubMed] [Google Scholar]
- 11.Vance C, et al. ALS mutant FUS disrupts nuclear localization and sequesters wild-type FUS within cytoplasmic stress granules. Human molecular genetics 22, 2676–2688 (2013). [DOI] [PMC free article] [PubMed] [Google Scholar]
- 12.Sharma A, et al. ALS-associated mutant FUS induces selective motor neuron degeneration through toxic gain of function. Nat Commun 7, 10465 (2016). [DOI] [PMC free article] [PubMed] [Google Scholar]
- 13.Kino Y, et al. FUS/TLS deficiency causes behavioral and pathological abnormalities distinct from amyotrophic lateral sclerosis. Acta Neuropathol Commun 3, 24 (2015). [DOI] [PMC free article] [PubMed] [Google Scholar]
- 14.Udagawa T, et al. FUS regulates AMPA receptor function and FTLD/ALS-associated behaviour via GluA1 mRNA stabilization. Nature communications 6, 7098 (2015). [DOI] [PMC free article] [PubMed] [Google Scholar]
- 15.Yokoi S, et al. 3’UTR Length-Dependent Control of SynGAP Isoform alpha2 mRNA by FUS and ELAV-like Proteins Promotes Dendritic Spine Maturation and Cognitive Function. Cell reports 20, 3071–3084 (2017). [DOI] [PubMed] [Google Scholar]
- 16.Edgar JM, et al. Oligodendroglial modulation of fast axonal transport in a mouse model of hereditary spastic paraplegia. The Journal of cell biology 166, 121–131 (2004). [DOI] [PMC free article] [PubMed] [Google Scholar]
- 17.Lappe-Siefke C, et al. Disruption of Cnp1 uncouples oligodendroglial functions in axonal support and myelination. Nat Genet 33, 366–374 (2003). [DOI] [PubMed] [Google Scholar]
- 18.Nave KA Myelination and support of axonal integrity by glia. Nature 468, 244–252 (2010). [DOI] [PubMed] [Google Scholar]
- 19.Funfschilling U, et al. Glycolytic oligodendrocytes maintain myelin and long-term axonal integrity. Nature 485, 517–521 (2012). [DOI] [PMC free article] [PubMed] [Google Scholar]
- 20.Rowley CD, et al. Assessing intracortical myelin in the living human brain using myelinated cortical thickness. Frontiers in Neuroscience 9, 396 (2015). [DOI] [PMC free article] [PubMed] [Google Scholar]
- 21.Ferraiuolo L, et al. Oligodendrocytes contribute to motor neuron death in ALS via SOD1-dependent mechanism. Proceedings of the National Academy of Sciences of the United States of America 113, E6496–E6505 (2016). [DOI] [PMC free article] [PubMed] [Google Scholar]
- 22.Kang SH, et al. Degeneration and impaired regeneration of gray matter oligodendrocytes in amyotrophic lateral sclerosis. Nature neuroscience 16, 571–579 (2013). [DOI] [PMC free article] [PubMed] [Google Scholar]
- 23.Scekic-Zahirovic J, et al. Motor neuron intrinsic and extrinsic mechanisms contribute to the pathogenesis of FUS-associated amyotrophic lateral sclerosis. Acta neuropathologica 133, 887–906 (2017). [DOI] [PMC free article] [PubMed] [Google Scholar]
- 24.Hughes EG, Kang SH, Fukaya M & Bergles DE Oligodendrocyte progenitors balance growth with self-repulsion to achieve homeostasis in the adult brain. Nature neuroscience 16, 668–676 (2013). [DOI] [PMC free article] [PubMed] [Google Scholar]
- 25.Flores AI, et al. Constitutively active Akt induces enhanced myelination in the CNS. The Journal of neuroscience : the official journal of the Society for Neuroscience 28, 7174–7183 (2008). [DOI] [PMC free article] [PubMed] [Google Scholar]
- 26.Kranz A, et al. An improved Flp deleter mouse in C57Bl/6 based on Flpo recombinase. Genesis 48, 512–520 (2010). [DOI] [PubMed] [Google Scholar]
- 27.Moy SS, et al. Mouse behavioral tasks relevant to autism: phenotypes of 10 inbred strains. Behavioural brain research 176, 4–20 (2007). [DOI] [PMC free article] [PubMed] [Google Scholar]
- 28.Elliott BM & Grunberg NE Effects of social and physical enrichment on open field activity differ in male and female Sprague-Dawley rats. Behavioural brain research 165, 187–196 (2005). [DOI] [PubMed] [Google Scholar]
- 29.Pellow S, Chopin P, File SE & Briley M Validation of open:closed arm entries in an elevated plus-maze as a measure of anxiety in the rat. Journal of neuroscience methods 14, 149–167 (1985). [DOI] [PubMed] [Google Scholar]
- 30.Crawley J & Goodwin FK Preliminary report of a simple animal behavior model for the anxiolytic effects of benzodiazepines. Pharmacology, biochemistry, and behavior 13, 167–170 (1980). [DOI] [PubMed] [Google Scholar]
- 31.Novak CM, Burghardt PR & Levine JA The use of a running wheel to measure activity in rodents: relationship to energy balance, general activity, and reward. Neuroscience and biobehavioral reviews 36, 1001–1014 (2012). [DOI] [PMC free article] [PubMed] [Google Scholar]
- 32.McKenzie IA, et al. Motor skill learning requires active central myelination. Science 346, 318–322 (2014). [DOI] [PMC free article] [PubMed] [Google Scholar]
- 33.Tucker LB, Fu AH & McCabe JT Performance of Male and Female C57BL/6J Mice on Motor and Cognitive Tasks Commonly Used in Pre-Clinical Traumatic Brain Injury Research. Journal of neurotrauma 33, 880–894 (2016). [DOI] [PMC free article] [PubMed] [Google Scholar]
- 34.Bailey KR & Crawley JN Anxiety-Related Behaviors in Mice in Methods of Behavior Analysis in Neuroscience (eds. nd & Buccafusco JJ) (Boca Raton (FL), 2009). [Google Scholar]
- 35.Franklin KB PG The mouse brain stereotaxis coordinates, (Elsevier, San Diego, 2008). [Google Scholar]
- 36.Xing B, et al. Conditional depletion of GSK3b protects oligodendrocytes from apoptosis and lessens demyelination in the acute cuprizone model. Glia (2018). [DOI] [PubMed] [Google Scholar]
- 37.Friese A, et al. Gamma and alpha motor neurons distinguished by expression of transcription factor Err3. Proceedings of the National Academy of Sciences of the United States of America 106, 13588–13593 (2009). [DOI] [PMC free article] [PubMed] [Google Scholar]
- 38.Mullen RJ, Buck CR & Smith AM NeuN, a neuronal specific nuclear protein in vertebrates. Development 116, 201–211 (1992). [DOI] [PubMed] [Google Scholar]
- 39.Livak KJ & Schmittgen TD Analysis of relative gene expression data using real-time quantitative PCR and the 2(-Delta Delta C(T)) Method. Methods 25, 402–408 (2001). [DOI] [PubMed] [Google Scholar]
- 40.Curiel J, et al. TUBB4A mutations result in specific neuronal and oligodendrocytic defects that closely match clinically distinct phenotypes. Human molecular genetics 26, 4506–4518 (2017). [DOI] [PMC free article] [PubMed] [Google Scholar]
- 41.Grant CE, Bailey TL & Noble WS FIMO: scanning for occurrences of a given motif. Bioinformatics 27, 1017–1018 (2011). [DOI] [PMC free article] [PubMed] [Google Scholar]
- 42.Colombrita C, et al. TDP-43 and FUS RNA-binding proteins bind distinct sets of cytoplasmic messenger RNAs and differently regulate their post-transcriptional fate in motoneuron-like cells. The Journal of biological chemistry 287, 15635–15647 (2012). [DOI] [PMC free article] [PubMed] [Google Scholar]
- 43.Mandillo S, et al. Early motor deficits in mouse disease models are reliably uncovered using an automated home-cage wheel-running system: a cross-laboratory validation. Disease models & mechanisms 7, 397–407 (2014). [DOI] [PMC free article] [PubMed] [Google Scholar]
- 44.Narayanan SP, Flores AI, Wang F & Macklin WB Akt signals through the mammalian target of rapamycin pathway to regulate CNS myelination. The Journal of neuroscience : the official journal of the Society for Neuroscience 29, 6860–6870 (2009). [DOI] [PMC free article] [PubMed] [Google Scholar]
- 45.Fyffe-Maricich SL, Schott A, Karl M, Krasno J & Miller RH Signaling through ERK1/2 controls myelin thickness during myelin repair in the adult central nervous system. The Journal of neuroscience : the official journal of the Society for Neuroscience 33, 18402–18408 (2013). [DOI] [PMC free article] [PubMed] [Google Scholar]
- 46.Jeffries MA, et al. ERK1/2 Activation in Preexisting Oligodendrocytes of Adult Mice Drives New Myelin Synthesis and Enhanced CNS Function. The Journal of neuroscience : the official journal of the Society for Neuroscience 36, 9186–9200 (2016). [DOI] [PMC free article] [PubMed] [Google Scholar]
- 47.Mathews ES & Appel B Cholesterol Biosynthesis Supports Myelin Gene Expression and Axon Ensheathment through Modulation of P13K/Akt/mTor Signaling. The Journal of neuroscience : the official journal of the Society for Neuroscience 36, 7628–7639 (2016). [DOI] [PMC free article] [PubMed] [Google Scholar]
- 48.Hoell JI, et al. RNA targets of wild-type and mutant FET family proteins. Nature structural & molecular biology 18, 1428–1431 (2011). [DOI] [PMC free article] [PubMed] [Google Scholar]
- 49.Belachew S, et al. Postnatal NG2 proteoglycan-expressing progenitor cells are intrinsically multipotent and generate functional neurons. The Journal of cell biology 161, 169–186 (2003). [DOI] [PMC free article] [PubMed] [Google Scholar]
- 50.Domenech-Estevez E, et al. Akt Regulates Axon Wrapping and Myelin Sheath Thickness in the PNS. The Journal of neuroscience : the official journal of the Society for Neuroscience 36, 4506–4521 (2016). [DOI] [PMC free article] [PubMed] [Google Scholar]
- 51.Bercury KK, et al. Conditional ablation of raptor or rictor has differential impact on oligodendrocyte differentiation and CNS myelination. The Journal of neuroscience : the official journal of the Society for Neuroscience 34, 4466–4480 (2014). [DOI] [PMC free article] [PubMed] [Google Scholar]
- 52.Saher G, et al. High cholesterol level is essential for myelin membrane growth. Nature neuroscience 8, 468–475 (2005). [DOI] [PubMed] [Google Scholar]
- 53.Saher G, et al. Cholesterol regulates the endoplasmic reticulum exit of the major membrane protein P0 required for peripheral myelin compaction. The Journal of neuroscience : the official journal of the Society for Neuroscience 29, 6094–6104 (2009). [DOI] [PMC free article] [PubMed] [Google Scholar]
- 54.Hoessli DC, et al. Signaling through sphingolipid microdomains of the plasma membrane: the concept of signaling platform. Glycoconjugate journal 17, 191–197 (2000). [DOI] [PubMed] [Google Scholar]
- 55.Simons K & Toomre D Lipid rafts and signal transduction. Nature reviews. Molecular cell biology 1, 31–39 (2000). [DOI] [PubMed] [Google Scholar]
- 56.Helms JB & Zurzolo C Lipids as targeting signals: lipid rafts and intracellular trafficking. Traffic 5, 247–254 (2004). [DOI] [PubMed] [Google Scholar]
- 57.Sturrock RR Myelination of the mouse corpus callosum. Neuropathology and applied neurobiology 6, 415–420 (1980). [DOI] [PubMed] [Google Scholar]
- 58.Mack CM, Boehm GW, Berrebi AS & Denenberg VH Sex differences in the distribution of axon types within the genu of the rat corpus callosum. Brain research 697, 152–160 (1995). [DOI] [PubMed] [Google Scholar]
- 59.Bachstetter AD, Webster SJ, Van Eldik LJ & Cambi F Clinically relevant intronic splicing enhancer mutation in myelin proteolipid protein leads to progressive microglia and astrocyte activation in white and gray matter regions of the brain. Journal of neuroinflammation 10, 146 (2013). [DOI] [PMC free article] [PubMed] [Google Scholar]
- 60.Ishigaki S, et al. Altered Tau Isoform Ratio Caused by Loss of FUS and SFPQ Function Leads to FTLD-like Phenotypes. Cell reports 18, 1118–1131 (2017). [DOI] [PubMed] [Google Scholar]
- 61.Wang F, et al. Enhancing Oligodendrocyte Myelination Rescues Synaptic Loss and Improves Functional Recovery after Chronic Hypoxia. Neuron 99, 689–701 e685 (2018). [DOI] [PMC free article] [PubMed] [Google Scholar]
- 62.Mauch DH, et al. CNS synaptogenesis promoted by glia-derived cholesterol. Science 294, 1354–1357 (2001). [DOI] [PubMed] [Google Scholar]
- 63.Barres BA & Smith SJ Neurobiology. Cholesterol--making or breaking the synapse. Science 294, 1296–1297 (2001). [DOI] [PubMed] [Google Scholar]
Associated Data
This section collects any data citations, data availability statements, or supplementary materials included in this article.
Supplementary Materials
Figure S1. Generation of the Fus floxed mouse line. I. Schematic of the Fus targeted allele with selectable markers flanked by flippase sites (FRT) and exons 4–6 flanked by LoxP sites before (A), after flippase mediated recombination that deletes all selectable markers (B), after Cre recombination that removes ex4–6 (C). II. Representative agarose gel shows the PCR products amplified from 6 tail DNA samples from Fusfl/+xFusfl/+ litter. The WT PCR product is 513 bp and the targeted flippase recombined allele product is 573 bp. 2, 3 are homozygous (fl/fl) for the Fus floxed allele. 5,6 are heterozygous (fl/+) and 1, 4 are WT (+/+). The identity of the bands was confirmed by DNA sequencing.
Figure S2. Neuronal expression of Fus in cortex, hippocampus and the cervical cord of 6 weeks old FusOLcKO. Representative 20× epifluorescent images of NeuN and Fus labeled neurons in WT and FusOLcKO motor cortex (layers IV-VI) (a), CA3 dentate gyrus of the hippocampus (b), and anterior horns of the cervical cord (c). a. and b. The bar graphs show the mean±SE of NeuN+, NeuN+/Fus+ cell counts and the percent of NeuN+/Fus+ cells. c. The bar graphs show the mean±SE of NeuN+, NeuN+/Fus+ α motor neurons and the percent of NeuN+/Fus+ α motor neurons, identified by nuclear area (see Methods).
Figure S3. Uncropped Western blots of signal proteins at 6 and 28 weeks.
Table S1. List of antibodies used for Western Blots
Supplementary Dataset FIMO analysis.


