Objectives:
To assess the effect of ambient temperature, humidity and wind speed on disease occurrence in Delhi, India.
Data and Methods:
Data regarding daily corona cases, temperature, humidity, wind speed, doubling time and basic reproduction number (R0) was retrieved from online sources. Pearson's coefficient was used to assess the correlation between daily as well as weekly corona cases and various environmental factors.
Results:
During the study period of 97 days, there was a steady rise in number of corona cases with median (interquartile range) cases per day being 224 (58 to 635). The doubling time demonstrated a strong positive correlation with temperature while R0 had strong negative correlation with temperature (correlation coefficients 0.814 and −0.78, respectively). No significant correlation with humidity or wind speed was observed.
Conclusion:
Increasing temperature decreases COVID-19 infectivity; however, actual role of environmental factors in expansion of pandemic needs further evaluation globally.
Keywords: COVID-19, humidity, SARS CoV-2, temperature, wind speed
In the first season of 2020, an outbreak of atypical pneumonia caused by a novel coronavirus (severe acute respiratory syndrome coronavirus 2, SARS-CoV-2) has spread all over the world, and it has a significant impact on public health and worldwide economy. This new virus has some relation to the initial SARS-CoV but is more aggressive than SARS, Middle East respiratory syndrome (MERS) virus, and seasonal influenza.1 It has exhibited relatively high human-to-human transmissibility compared to other coronavirus infections. As of June 18, 2020, the reported confirmed case count of coronavirus disease 19 (COVID-19) has reached 381,092 in India. The count in Delhi has reached up to 49,979 with a reported mortality of 1969.
Many infectious diseases present an environmental pattern in their occurrence. Environmental factors, such as climate and weather condition, could drive the space and time correlations of infectious diseases, including influenza. SARS-CoV-2 is transmitted through large droplets or direct contact with secretions (or fomites). Several factors affect the transmission of disease, which include host factors, virus factors, and environmental factors. The stability of the virus is affected by meteorological conditions such as humidity, wind speed and temperature.2 There is emerging literature regarding the environmental pattern in COVID-19 incidence. This study aims to analyze the correlation between weather conditions and covid-19 pandemic in New Delhi, India.
DATA AND METHODS
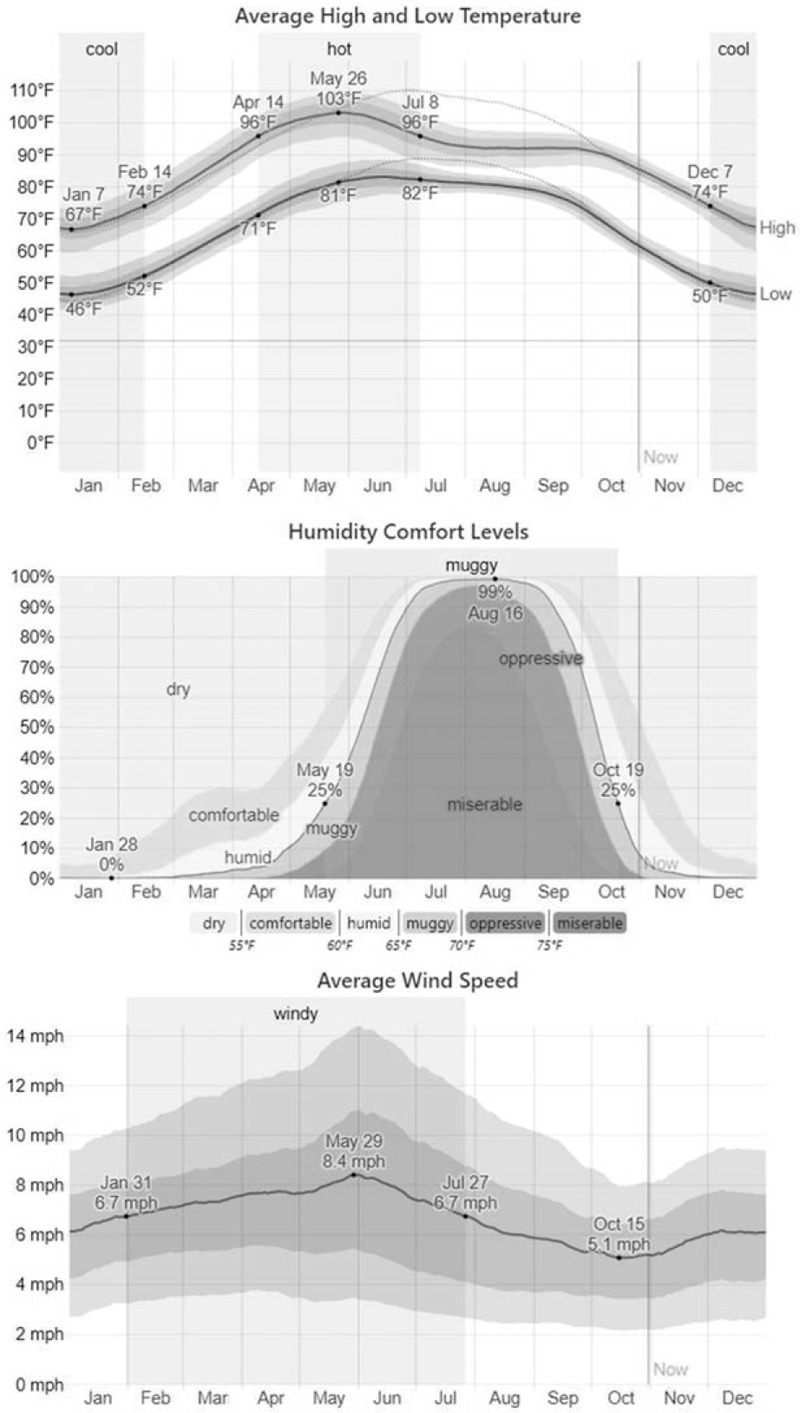
We studied environmental variables in New Delhi, which is the capital of India with a population of 16,787,941 as per 2011 census. The surface area of Delhi is 1484 km2 with a population density of 11,312/km2. The city is located with the global positioning system (GPS) coordinates of 28°38′41.2800′′N and 77°13′0.1956′′E. The climate variables in Delhi are shown in Fig. 1. Daily data regarding the number of confirmed COVID-19 cases were collected starting March 14, 2020 till June 18, 2020 from available online platforms.3 Data regarding the temperature (minimum, maximum and average), humidity and wind speeds daily was collected from timeanddate.com.4 We also studied daily R0 and weekly doubling time. R0 or basic reproduction number is a marker of infectivity and reflects the number of people one person infects assuming the whole population is susceptible to it. R0 was taken from an online platform where data from March 22, 2020 to June 10 2020 was available (www.covidtoday.in).5 Weekly doubling time was calculated using the following equation: Td = (t2–t1)log 2/log(q2/q1), where q1 and q2 are the number of cases on time point 1 and 2, respectively and Td is doubling time.6 Doubling time was evaluated against mean weekly temperature, wind speed and humidity. Pearson's correlation coefficient was used to examine the relationship between weather variables and daily COVID-19 cases. In the present study, a rolling correlation was used to investigate the correlation between two-time series component for a specified rolling window. Rolling correlations help us visualize the change in correlation over time.
FIGURE 1.

The climatological figure depicting weather variables (temperature, humidity and wind speed) in Delhi around the year.
Distributed lag models (DLM) considering lag of 10 days were used, to study the relations of incidence of cases on a particular day with variation in weather variables. The response variable at time t is affected by the explanatory variables at time t, t–1, t–2,…, t–q, where t is the time in days and q is the finite lag length. In the presented study, the finite lag length is considered to be 10. The DLM was obtained for a different set of lags for each predictor and the judgement on retaining the specific lags for temperature, wind speed and humidity was taken based on the AIC (Akaike Information Criterion). The package used was “dLagM”, and the R console was used to analyze the data. A P < 0.05 was considered statistically significant throughout.
RESULTS
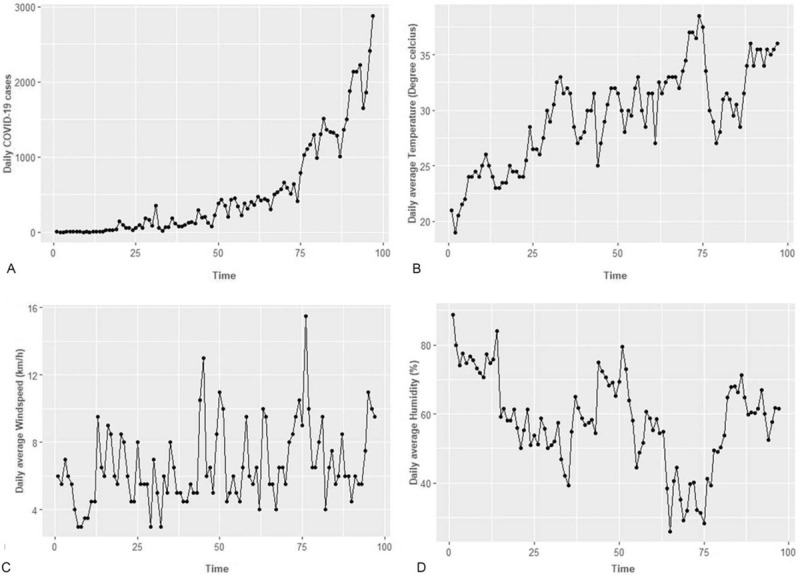
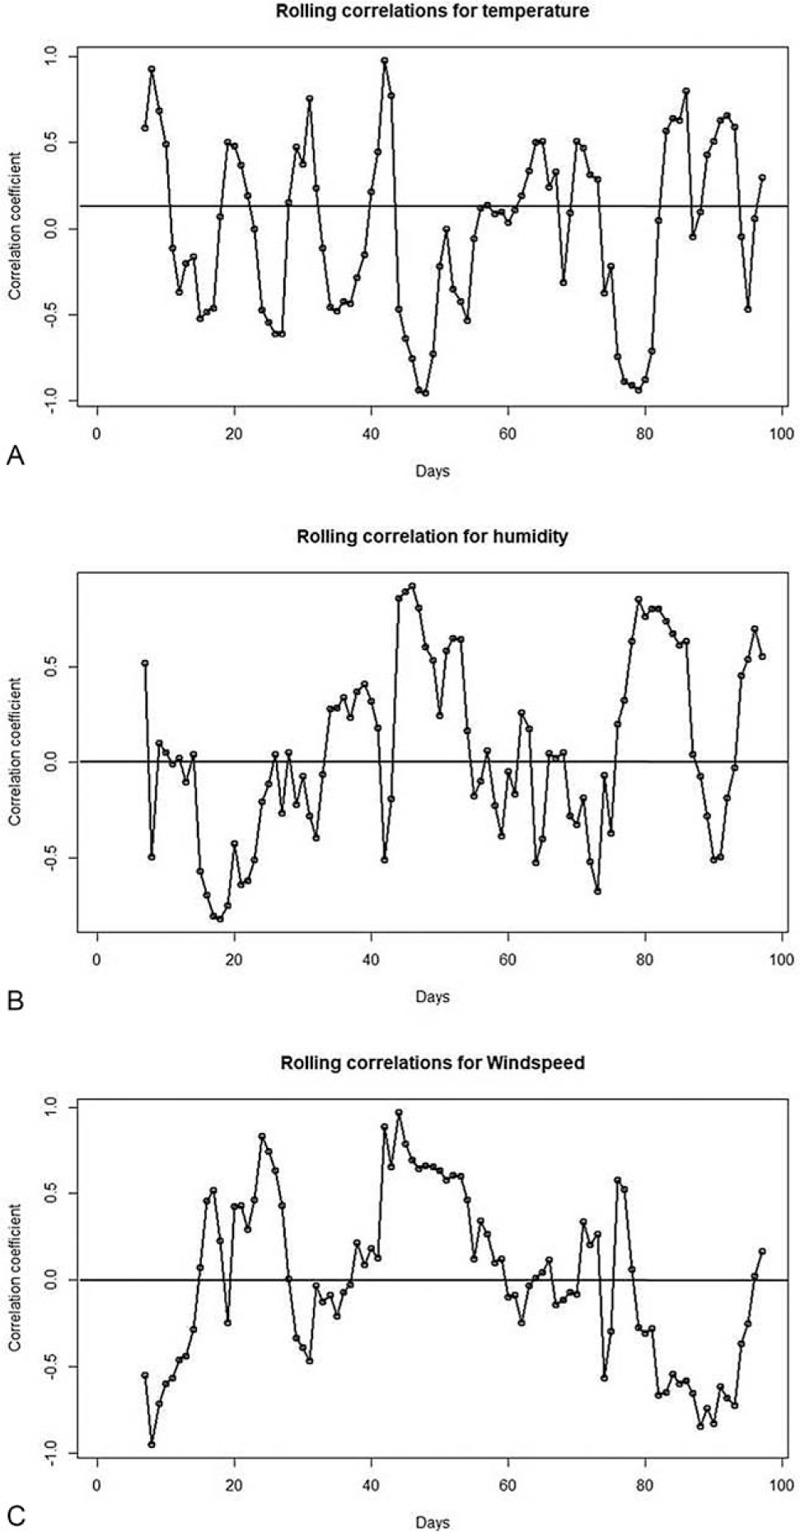
The daily number of cases of COVID-19 in New Delhi from March 14, 2020, until June 18, 2020 were recorded. The lowest number of cases on a single day was zero, whereas the highest was 2877. The median (interquartile range, IQR) number of COVID-19 cases per day was 224 (IQR 58–635). The weather data demonstrated minimum temperature ranging between 12°C and 29°C (average 21.7°C), the maximum temperature from 26°C to 48°C (average 37.25°C) and the average temperature ranged from 19°C to 38.5°C(average 29.5°C). The lowest humidity observed on any day was 26% while the highest value was 88.75% (average 58.03%). The wind speed ranged from 3 km/h (lowest) to 15.5 km/h (highest) with an average of 6.58 km/h. The weather data and corona cases against time are presented in Fig. 2. The partial correlation coefficient between temperature and daily corona cases while controlling for humidity and wind speed, was 0.647, indicating a moderate positive linear relationship. Similarly, a mild positive linear relationship (r = 0.193) was observed between wind speed and daily corona cases controlling for temperature and humidity. A moderate relationship (r = 0.396) was observed between humidity and daily number of corona cases after adjusting for wind speed and temperature. Rolling correlations with a 7-day averaging window are presented in Fig. 3 to visualize the change in correlation over time. The rolling correlation reflects that the average correlation is misleading because all three correlations (corona cases in Delhi correlated with the temperature, humidity and wind speed) vary widely over time. Even the sign of the correlation flips, and the plots emphasize periods when the correlation sign switches from positive to negative. Over a long period, an average correlation can be considered true to present the expected scenario when thinking about diversification; however, in a short duration, the average correlation seems to be misleading.
FIGURE 2.

Line chart depicting daily number of corona cases (A) and average daily temperature (B), wind speed (C) and humidity (D) in New Delhi from day 1 (March 14, 2020) to day 97 (June 18, 2020).
FIGURE 3.

Rolling Correlations plot of number of corona cases per day with average temperature (A), humidity (B) and wind speed (C) of New Delhi.
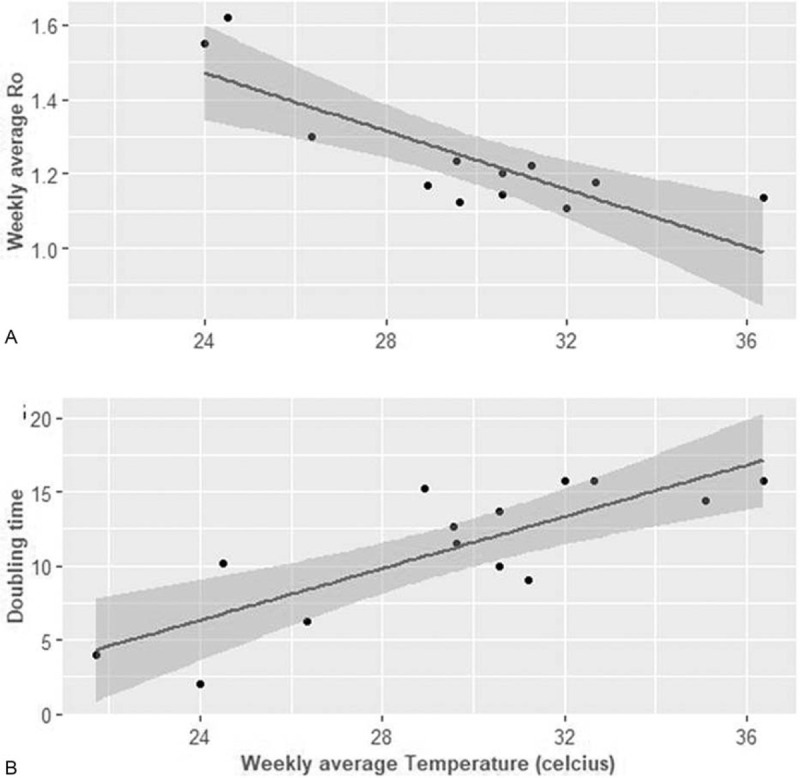
We also did a weekly as well as lag model analysis, to counter the bias owing to delay of incubation period and delay in testing. The weekly doubling time during first week was 3.9 days and it had increased to 14.4 days during the last week. Weekly doubling time when compared with mean weekly temperature, wind-speed and humidity, demonstrated a positive correlation with temperature with a Pearson's coefficient value of 0.814, suggesting strong correlation. On the other hand, humidity and wind speed demonstrated no significant correlation, having Pearson's co-efficient of 0.29 and −0.28, respectively. Similar results were seen for R0 and a negative co-relation was seen with temperature with the Pearson coefficient of −0.78, while no correlation was seen with wind-speed or humidity with Pearson's coefficient value of 0.28 and −0.09, respectively (Fig. 4). A correlational analysis of Daily R0 with weather parameters was also performed and the temperature had a significant negative correlation (partial correlation coefficient −0.63) while humidity and wind speed did not have significant correlation (coefficients being −0.008 and 0.007, respectively) (Fig. 5).
FIGURE 4.

The correlation plots of weekly average temperature with weekly basic reproduction number R0 (A) and doubling time (B).
FIGURE 5.

The correlation plots of daily R0 against average temperature (A), wind speed (B) and humidity (C).
In the weekly analysis of the data, comparing weekly number of cases and average temperature, wind-speed and humidity over the week, we found positive association of the weather parameters with weekly total COVID-19 cases, with temperature having strong co-relation having coefficient value of 0.820, while humidity and wind speed had mild co-relation with coefficient of 0.337 and 0.452, respectively.
In DLM, the covid-19 cases in Delhi, are assumed to be affected by the values of temperature, wind speed, and humidity for 10 days in the past (a finite lag length, q = 10). None of the lags of temperature, humidity as well as wind-speed was observed to be significant in the model considering the lag length of 10 days. Hence, only the temperature at lag t–9 and t–10 along with humidity and wind-speed at t–10 were kept in the model. This led to a decrease in AIC by nine units. The DLM is found to be a good fit to the data (F4,82 = 10.61, P < 0.001). Findings presented in Table 1, reveal a significant effect of wind-speed at t–10 on the corona cases in Delhi (AIC = 1351.86, Adjusted R squared = 0.31). The temperature at day t–9 and wind-speed at day t–10 is related to the number of cases in Delhi with an estimated lag weight of 66.965 (P = 0.047) and 53.61 (P = 0.044), respectively.
TABLE 1.
Distributed Lag Model Findings Relating the Number of Corona Cases With the Weather Characteristics
| Weather Characteristics | Estimate | Standard Error | P value | |
| Temperature | Day t–9 | 66.97 | 33.17 | 0.047 |
| Day t–10 | 34.29 | 34.48 | 0.322 | |
| Wind speed | Day t–10 | 53.61 | 26.26 | 0.044 |
| Humidity | Day t–10 | 7.08 | 6.07 | 0.246 |
DISCUSSION
The weather has been postulated to play a role in the differential distribution and impact of COVID-19 on the world. This study assessed the effect of climate variables on the occurrence of COVID-19 in the city of New Delhi, India. Doubling time increased while R0 decreased with increasing temperature, while both did not show any association of wind speed or humidity. This suggests that increasing temperature is associated with reduction in infectivity. It is well studied that with increasing temperature, infectivity decreases, which is synchronization with our R0 and doubling time results. On the other hand, the absolute number of corona cases continues to rise as the pandemic has been expanding owing to the community transmission and improved testing facilities.
While analyzing average temperature, humidity and wind speed for correlation with daily and weekly COVID-19 cases, it was found that all had a positive co-relation. During the SARS virus outbreak in 2003, a significant association between disease occurrence and the temperature and its variations was seen.7 A recent study published by Sehra et al demonstrated that COVID-19 transmission declines with increasing temperature, although the transmissibility remained significant even on higher temperatures.8 On the other hand, our study demonstrated a steady rise in absolute number of COVID-19 cases with a rise in the temperature. Similar findings were reported by Tosepu et al in their study of COVID pandemic and weather variables in Indonesia.2 This increasing number of new cases with increasing temperature is attributable to expanding nature of the pandemic in our country rather than effect of temperature. Even though there was increasing number of new cases, the infectivity parameters demonstrated a reduction. Previous data suggest that an increase in humidity decreases the suspension time of Corona virus negatively correlating with disease transmission (R0). We did not find any such association on weekly data analysis. After considering a lag model for the incubation period as well as testing delay which may account upto 7 to 10 days delay between infection and patient getting himself tested, we did find a statistically significant association between temperature and the daily number of cases. Wind speed also demonstrated a positive correlation, thereby suggesting that more windy places may have more transmissibility owing to the distant spread of droplets. Similar results using lag model were seen by a study by Sahin et al9 regarding wind speed, which found positive co-relation of wind speed of past 14 days with number of cases. However, this analysis has a limitation that analyzing absolute numbers in a graph of exponential growth might lead to erroneous results, as onset of summer season and COVID pandemic coincided, absolute numbers were bound to increase with increasing temperature. Thus, explaining the role of R0 and doubling time in overcoming such bias.
Correlation between wind speed and infectivity has been studied previously and has shown varied results. A study by Sahin et al showed a positive association while a study by Altamimi et al10 showed that MERS-CoV had higher infectivity with low wind-speed. In our analysis, doubling time as well as R0 were used as markers of infectivity and disease transmission and had no significant correlation with wind-speed. The results suggest a temperature more than 28°C, a humidity of less than 50% and wind speed of more than 6 km/h are optimal weather conditions to minimize R0.
Despite the significant finding of the weather on COVID-19, this study has several limitations. Firstly, we have not assessed viral factors as well as host factors such as population susceptibility which will affect the disease transmission.11 However, since we considered the lockdown period, as well as, initial unlock in our country, for evaluation, the effect of changing population mobility would also have been nullified. Individual factors, including (but not limited to) personal hygiene and the use of personal protective gears such as masks by the public, maybe some of the other aspects that need to be explored. However, this is a preliminary analysis and needs to be studied on a large timescale and dataset for definite conclusions. Lastly, such an association may be attributed to the natural curve of the epidemic in Delhi, strengthening of the testing facility and active screening of contacts during that period irrespective of symptoms, leading to more cases being detected in the latter part which coincided with the onset of summers. The administrative strategies, such as the implementation of lockdown, have played a significant role in disease transmission and affect the results of any study of the effect of environmental variables.
CONCLUSION
We conclude that increasing ambient temperature is associated with decreased infectivity in terms of reduction in basic reproduction number and increase in doubling time. Humidity and wind speed did not affect infectivity of COVID-19 significantly.
Footnotes
The authors have no funding and conflicts of interest to disclose.
Clinical significance: The increasing ambient temperature is associated with reduced COVID-19 cases as well as increased doubling time. The increase in environmental humidity may be associated with increased disease transmission. These findings suggest that a reduction in temperature in winters may lead to increase in cases and we need to remain prepared for the same even if we start seeing a relatively low number of cases during the high-temperature season.
Authors contribution: Conceptualization and final manuscript preparation: SM.
Data collection and initial manuscript preparation: SP; MM.
Manuscript revision: AM; VH; PT; RG.
Statistical analysis and manuscript revision: RMP; N; KM.
REFERENCES
- 1.Hussain A, Yadav S, Hadda V, et al. Covid-19: a comprehensive review of a formidable foe and the road ahead. Expert Rev Respir Med 2020; 14:869–879. [DOI] [PubMed] [Google Scholar]
- 2.Tosepu R, Gunawan J, Effendy DS, et al. Correlation between weather and Covid-19 pandemic in Jakarta, Indonesia. Sci Total Environ 2020; 725:138436. [DOI] [PMC free article] [PubMed] [Google Scholar]
- 3. Coronavirus in India: Latest Map and Case Count [Internet]. Covid19india.org; 2020 [cited 27 June 2020]. Available at: https://www.covid19india.org/. Accessed July 10, 2020. [Google Scholar]
- 4. Timeanddate.com [Internet]. Timeanddate.com; 2020 [cited 27 June 2020]. Available at: https://www.timeanddate.com/. Accessed July 10, 2020. [Google Scholar]
- 5. COVID TODAY [Internet]. Covidtoday.in; 2020 [cited 26 June 2020]. Available at: https://www.covidtoday.in/?fbclid=IwAR2-9mUNmev7KkvTTg9WercXDsl7oL2x5qSV3JF14J6bcxTqeEUgak4zTGE. Accessed July 10, 2020. [Google Scholar]
- 6.Mazumder A, Arora M, Sra MS, et al. Geographical variation in case fatality rate and doubling time during the COVID-19 pandemic. Epidemiol Infect 2020; 148:e163. [DOI] [PMC free article] [PubMed] [Google Scholar]
- 7.Tan J, Mu L, Huang J, Yu S, Chen B, Yin J. An initial investigation of the association between the SARS outbreak and weather: with the view of the environmental temperature and its variation. J Epidemiol Community Health 2005; 59:186–192. [DOI] [PMC free article] [PubMed] [Google Scholar]
- 8.Sehra ST, Salciccioli JD, Wiebe DJ, Fundin S, Baker JF. Maximum daily temperature, precipitation, ultra-violet light and rates of transmission of SARS-Cov-2 in the United States. Clin Infect Dis 2020; ciaa681. [DOI] [PMC free article] [PubMed] [Google Scholar]
- 9.Şahin M. Impact of weather on COVID-19 pandemic in Turkey. Sci Total Environ 2020; 728:138810. [DOI] [PMC free article] [PubMed] [Google Scholar]
- 10.Altamimi A, Ahmed AE. Climate factors and incidence of Middle East respiratory syndrome coronavirus. J Infect Public Health 2020; 13:704–708. [DOI] [PMC free article] [PubMed] [Google Scholar]
- 11.Madan M, Pahuja S, Mohan A, et al. TB infection and BCG vaccination: are we protected from COVID-19? Public Health 2020; 185:91–92. [DOI] [PMC free article] [PubMed] [Google Scholar]


