Abstract
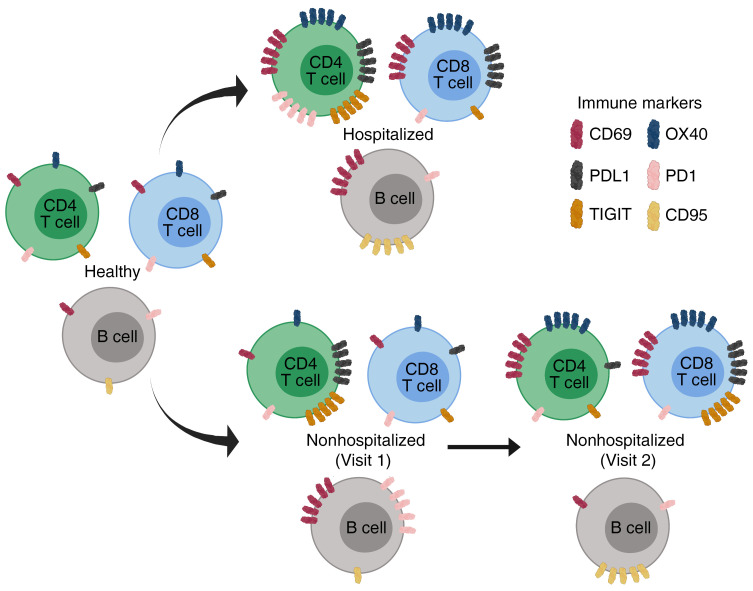
SARS-CoV-2 causes a wide spectrum of clinical manifestations and significant mortality. Studies investigating underlying immune characteristics are needed to understand disease pathogenesis and inform vaccine design. In this study, we examined immune cell subsets in hospitalized and nonhospitalized individuals. In hospitalized patients, many adaptive and innate immune cells were decreased in frequency compared with those of healthy and convalescent individuals, with the exception of an increase in B lymphocytes. Our findings show increased frequencies of T cell activation markers (CD69, OX40, HLA-DR, and CD154) in hospitalized patients, with other T cell activation/exhaustion markers (PD-L1 and TIGIT) remaining elevated in hospitalized and nonhospitalized individuals. B cells had a similar pattern of activation/exhaustion, with increased frequency of CD69 and CD95 during hospitalization followed by an increase in PD1 frequencies in nonhospitalized individuals. Interestingly, many of these changes were found to increase over time in nonhospitalized longitudinal samples, suggesting a prolonged period of immune dysregulation after SARS-CoV-2 infection. Changes in T cell activation/exhaustion in nonhospitalized patients were found to positively correlate with age. Severely infected individuals had increased expression of activation and exhaustion markers. These data suggest a prolonged period of immune dysregulation after SARS-CoV-2 infection, highlighting the need for additional studies investigating immune dysregulation in convalescent individuals.
Keywords: COVID-19, Immunology
Keywords: Cellular immune response
Introduction
Since the first reports in December 2019, coronavirus disease 2019 (COVID-19), caused by the novel virus SARS-CoV-2, has spread worldwide and caused enormous public health and economic impacts (1, 2). Many patients remain asymptomatic or have mild symptoms (3), although others, particularly those with comorbidities, develop severe clinical diseases with atypical pneumonia and multiple system organ failure (4–6). To date, there have been over 26 million reported cases and 870,000 COVID-19–related deaths (7), and with no imminent vaccine, understanding of the immune pathology associated with patients of various clinical outcomes is urgently needed.
Several early studies have shown that acutely infected individuals develop lymphopenia (5, 8–11) and exhibit elevated expression of T cell activation markers (12–14). Additionally, several groups have shown differential expression of T cell exhaustion markers between severe and mild clinical cases (12, 13, 15). Studies have reported increased NKG2A levels in CD8+ T cells and NK cells that return to baseline in convalescence (13), and increased monocyte frequencies in comparison to lymphocytes when using single-cell RNA sequencing analysis (16); however, these studies were limited in scope. Recent reports have described the presence of SARS-CoV-2–specific T cells in convalescent patients (17, 18), emphasizing the value of studying immune subsets in convalescent individuals who have recently overcome infection in order to better inform vaccine and therapeutic efforts.
Previous studies on SARS and Middle East respiratory syndrome (MERS) demonstrated increased immune system dysregulation with lymphopenia and inflammatory cytokine storm (19, 20). In patients infected by SARS-CoV, various studies investigated the T cell and B cell subsets (21–23). Early investigations in SARS-CoV-2 (24, 25) and more recent large cohort studies have described immune perturbations in acutely infected hospitalized individuals with severe infection (26, 27). In acute viral infections such as influenza, several groups have shown evidence of prolonged immune activation during the convalescent phase that correlated with worse clinical outcomes (28–30). Antibody responses in MERS were found to be undetectable in patients who had mild illness after infection (31). These findings highlight the need for studies investigating the immune systems of hospitalized and nonhospitalized individuals with SARS-CoV-2. Here, we evaluated immune cell subsets of SARS-CoV-2–infected individuals and identified dysregulated immune cells in hospitalized and nonhospitalized individuals over time.
Results
Differential immune cell subset frequencies in hospitalized and nonhospitalized individuals.
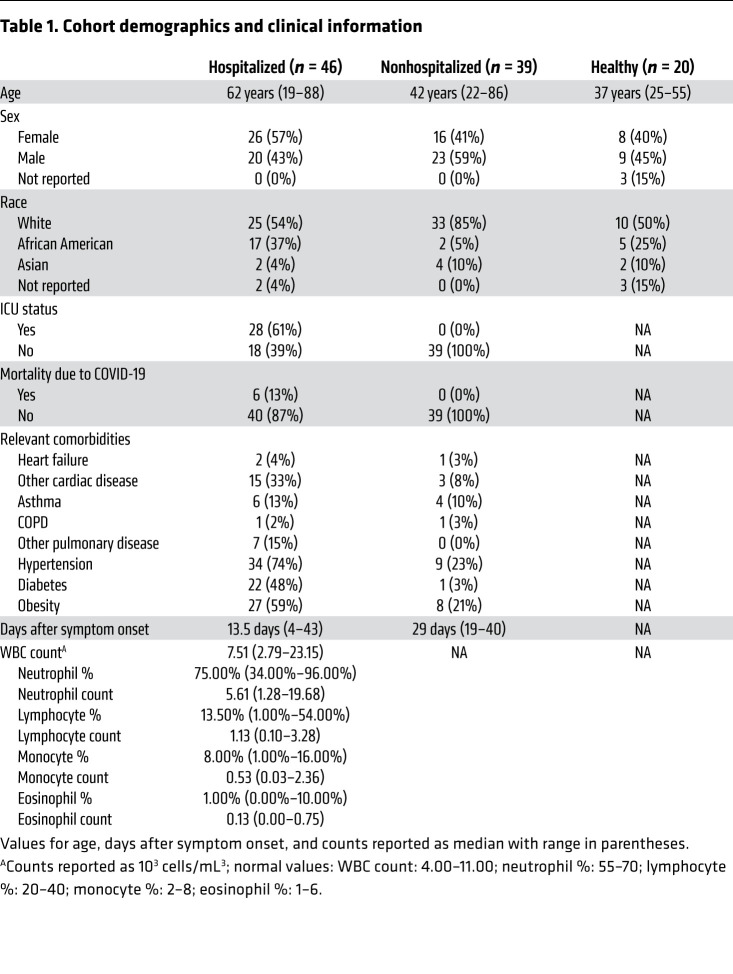
Others previously found that SARS-CoV-2–infected individuals, especially those with severe infection, have pronounced lymphopenia compared with healthy and convalescent individuals (5, 8, 9). However, most of these studies were done in hospitalized patients and only evaluated a few cell types. Here, we obtained samples and clinical data from a cohort of hospitalized COVID-19 patients (“hospitalized,” n = 46) and a cohort of nonhospitalized individuals who had recovered from confirmed COVID-19 infection (“nonhospitalized,” n = 39). These groups were compared with healthy, COVID-19–negative controls (“healthy,” n = 20). An overview of the cohort demographics is shown in Table 1. Importantly, most individuals in the hospitalized group (n = 36) were viremic and hospitalized at the time of sample collection; however, a minority (10 of 46) were asymptomatic for at least 3 consecutive days and were at least 7 days past initial diagnosis at the time of initial sample collection and therefore could be classified as convalescent, but were still included in the hospitalized group because of disease severity. All individuals in the nonhospitalized group were convalescent at the time of sample collection. As shown in Table 1, there were differences between age, race, and comorbidities. Many of these differences reflect the nature of the COVID-19 pandemic, with more severe infection being associated with older age, African American race, and preexisting comorbidities.
Table 1. Cohort demographics and clinical information.
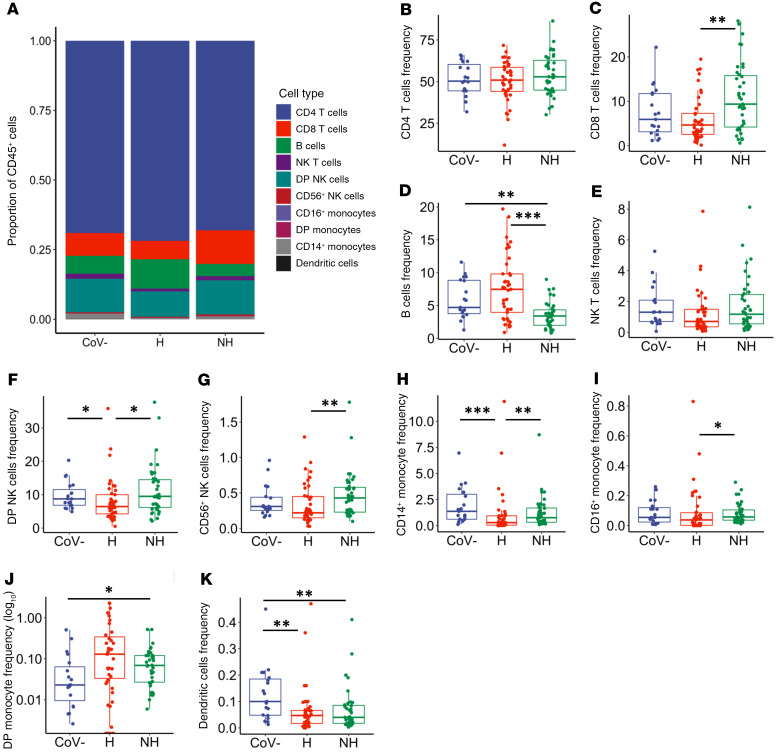
As previously described (32), we found that hospitalized individuals in our study displayed normal WBC counts but distinctly lower numbers of lymphocytes (Table 1). To further assess immune cells that remain during SARS-CoV-2 infection, we utilized a general immunophenotyping flow cytometry panel to evaluate the proportion of specific immune cell subsets within the total CD45+ cell population in each individual (overview shown in Figure 1A). Although there was a decrease in the lymphocyte counts, we observed no significant decrease in proportion of CD4+ T cells in the total CD45+ population (Figure 1B). There was an increase in CD8+ T cell frequencies in the nonhospitalized group compared with the hospitalized group (Figure 1C, P = 0.003). In contrast, B cell frequencies were decreased in nonhospitalized individuals in comparison to the healthy and hospitalized groups (Figure 1D, P = 0.002 and P < 0.001, respectively).
Figure 1. Differential frequencies of immune cell subsets in hospitalized and nonhospitalized individuals.
Staining of isolated PBMCs from healthy (CoV–, n = 19), hospitalized (H, n = 41), and nonhospitalized (NH, n = 39) samples, showing immune cell subsets as a frequency of the total CD45+ population. (A) Overview of all immune cell subsets, with a more in-depth look at (B) CD4+ and (C) CD8+ T cells; (D) B cells; (E) NK T cells; (F) CD56+CD16+ and (G) CD56+CD16– NK cells; (H) CD14+, (I) CD16+, and (J) CD14+CD16+ monocytes; and (K) DCs. Boxplots indicate median, IQR, and 95% confidence interval. P values determined by Wilcoxon’s rank-sum tests and are indicated as follows: *P ≤ 0.05, **P ≤ 0.01, ***P ≤ 0.001.
We investigated the innate immune cell subsets including NK T cells, NK cells, monocytes, and DCs, which have been shown to play a protective role during other acute viral infections, including influenza A (33). Interestingly, many of these subsets showed decreased frequencies in hospitalized patients and returned to baseline in nonhospitalized individuals. There was a trend toward decreased NK T cells in the hospitalized group compared with the healthy and nonhospitalized groups (Figure 1E, P = 0.057 and P = 0.057, respectively). Similarly, hospitalized individuals had decreased double-positive CD56+CD16+ NK cells (Figure 1F, compared with healthy: P = 0.023 and compared with nonhospitalized: P = 0.011) and CD56+CD16– NK cells (Figure 1G, compared with nonhospitalized: P = 0.009). There were decreased frequencies of CD14+ monocytes in hospitalized individuals compared with healthy and nonhospitalized individuals (Figure 1H, P < 0.001 and P = 0.004, respectively), with decreased frequencies in the CD16+ monocyte population of hospitalized over nonhospitalized individuals as well (Figure 1I, P = 0.013). In contrast, the amount of double-positive CD16+CD14+ monocytes increased in frequency in the nonhospitalized group above healthy controls (Figure 1J, P = 0.033). DC frequency decreased in the hospitalized and nonhospitalized samples compared with the healthy sample (Figure 1K, P = 0.003 and P = 0.007, respectively). These data showed altered immune cell frequencies in hospitalized individuals, and although some of these observed perturbances are missing in the nonhospitalized individuals, decreased frequencies of double-positive monocytes and DCs suggest a degree of sustained immune dysfunction in both groups of SARS-CoV-2–infected individuals.
Immune dysregulation in hospitalized and nonhospitalized samples.
Prior findings suggest that T cells upregulate activation and exhaustion markers during acute COVID-19 infection, especially in severe infection (12–15, 26, 27). Here, we examine T cell phenotypes in infection and convalescence, separating our cohort based on severity of infection into individuals who were hospitalized and nonhospitalized. We measured surface-level expression of the activation markers CD69, OX40, CD38, CD137, and CD154. We also analyzed the T cell exhaustion markers TIGIT, PD-L1, PD1, and TIM3. Notably, PD1 and TIM3, although often classified as exhaustion markers, have also been shown to be activated during other acute infections (34, 35). Finally, we stained for CD27 and CD28 because loss of these markers has been found to represent a loss of differentiated memory T cells, suggesting a more senescent phenotype (36).
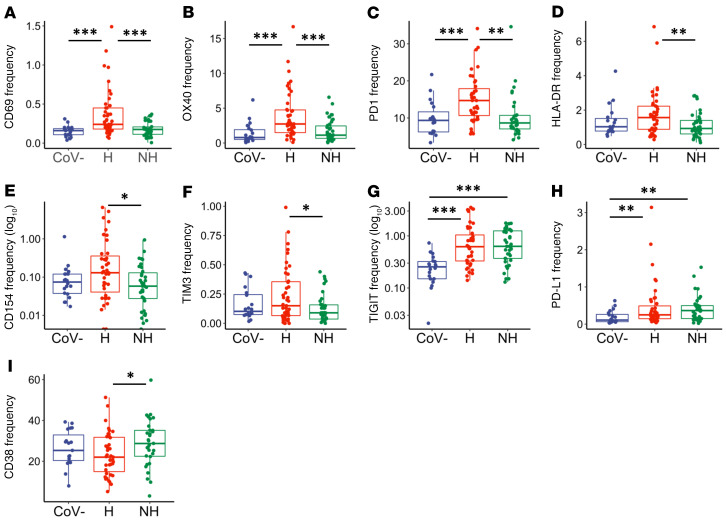
In hospitalized individuals, we observed elevated frequencies over healthy and nonhospitalized groups with respect to CD69 (Figure 2A, P < 0.001 and P < 0.001, respectively), OX40 (Figure 2B, P < 0.001 and P < 0.001, respectively), and PD1 (Figure 2C, P < 0.001 and P = 0.005, respectively). The markers HLA-DR, CD154, and TIM3 were elevated in hospitalized over nonhospitalized individuals (Figure 2, D–F, P = 0.009, P = 0.028, and P = 0.047, respectively). Collectively, these observations identified markers that were elevated during severe infection, but then returned to baseline with resolution of symptoms or remained normal in mild infection. Further, 2 exhaustion markers were elevated in the hospitalized and nonhospitalized samples when compared with the healthy samples: TIGIT (Figure 2G, P < 0.001 and P < 0.001, respectively) and PD-L1 (Figure 2H, P = 0.007 and P = 0.003, respectively). Meanwhile, the frequency of CD4+ T cells expressing CD38 was significantly lower in hospitalized patients in comparison to nonhospitalized patients (Figure 2I, P = 0.031). In summary, expression of some markers (CD69, OX40, PD1, HLA-DR, CD154, and TIM3) on CD4+ T cells appeared elevated in hospitalized SARS-CoV-2–infected individuals, whereas they appeared to be similar to baseline in nonhospitalized individuals. Other activation and exhaustion markers such as TIGIT and PD-L1 remained elevated during the convalescent stage after infection.
Figure 2. CD4+ T cell activation and exhaustion in hospitalized and nonhospitalized individuals.
Frequency of CD4+ T cells expressing a given activation or exhaustion marker. (A–F) Markers that were elevated in hospitalized patients and similar to baseline in nonhospitalized individuals. (G–I) Markers that remained elevated in hospitalized and nonhospitalized individuals. Boxplots indicate median, IQR, and 95% confidence interval. P values determined by Wilcoxon’s rank-sum test. *P ≤ 0.05, **P ≤ 0.01, ***P ≤ 0.001. Healthy: CoV– (nCoV-= 20), hospitalized: H (nH= 46), nonhospitalized: NH (nNH= 39).
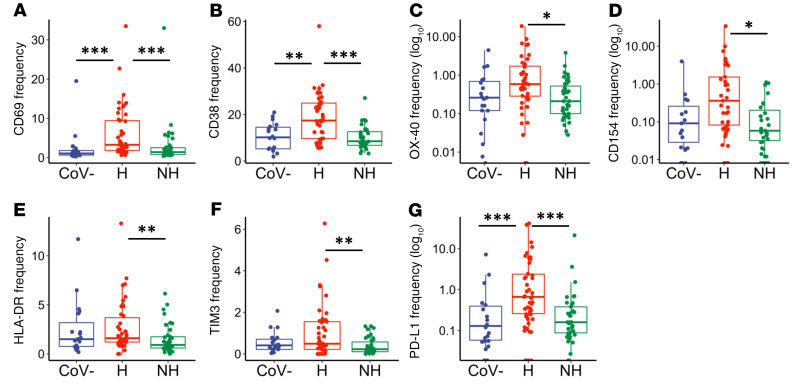
We next investigated the frequencies of T cell activation and exhaustion markers in CD8+ T cells (relative frequencies of all markers shown in Supplemental Figure 1B). We found that the activation markers CD69 and CD38 were significantly elevated in hospitalized individuals in comparison with the healthy group (Figure 3, A and B, P < 0.001 and P = 0.002, respectively) and nonhospitalized group (Figure 3, A and B, P < 0.001 and P < 0.001, respectively). In addition, frequencies of OX40, CD154, and HLA-DR were all higher in hospitalized individuals than nonhospitalized individuals (Figure 3, C–E, P = 0.033, P = 0.013, and P = 0.005, respectively). The exhaustion marker TIM3 was higher in the hospitalized than the nonhospitalized group (Figure 3F, P = 0.004), and PD-L1 was higher in the hospitalized group over the nonhospitalized and healthy groups (Figure 3G, P = 0.001 and P < 0.001, respectively). Overall, expression of these activation and exhaustion markers indicated more severe immune dysregulation of CD8+ T cells in the hospitalized group.
Figure 3. CD8+ T cell activation and exhaustion in hospitalized and nonhospitalized individuals.
Frequency of CD8+ T cells expressing a given activation or exhaustion marker. (A–G) Markers that were elevated in hospitalized over nonhospitalized individuals. Boxplots indicate median, IQR, and 95% confidence interval. P values determined by Wilcoxon’s rank-sum test. *P ≤ 0.05, **P ≤ 0.01, ***P ≤ 0.001. Healthy: CoV– (nCoV-= 20), hospitalized: H (nH= 46), nonhospitalized: NH (nNH= 39).
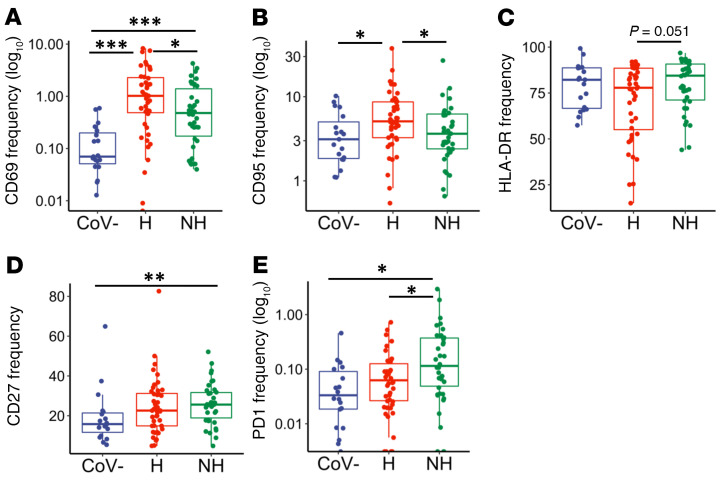
To help characterize the B lymphocyte population in this cohort, we looked at the activation markers CD69, CD95, and HLA-DR. Fc receptor-like 4 (FCRL4) was also measured because it is upregulated on B cells of lymphoid tissue, increased in the periphery during some chronic infections and autoimmune diseases, and is associated with an exhausted B cell phenotype (37–42). We also examined the frequencies of the exhaustion marker PD1 and the memory marker CD27. A summary of B cell marker expression is shown in Supplemental Figure 1C. Similar to observations in our CD4+ and CD8+ T cell subsets, we found an increased frequency of the activation markers CD69 and CD95 in hospitalized individuals over nonhospitalized individuals (Figure 4, A and B, P = 0.039 and P = 0.034, respectively), whereas CD69 was also elevated in the hospitalized and nonhospitalized groups compared with healthy controls (Figure 4A, P < 0.001 and P < 0.001, respectively). B cell expression of CD95 was also increased in hospitalized individuals over healthy controls (Figure 4B, P = 0.021). B cell expression of HLA-DR trended toward a decrease in hospitalized individuals, and CD27 was significantly increased in nonhospitalized individuals over healthy controls (Figure 4, C and D, P = 0.051 and P = 0.004, respectively). Finally, the exhaustion marker PD1 was elevated in nonhospitalized individuals over hospitalized patients and healthy controls (Figure 4E, P < 0.026 and P < 0.016, respectively). These data indicate that B cells were dysregulated in both hospitalized and nonhospitalized COVID-19 patients, similar to what we have described for T cells.
Figure 4. B cell activation and exhaustion in hospitalized and nonhospitalized individuals.
Frequency of B cells expressing a given activation or exhaustion marker. (A and B) CD95 and CD69 frequencies were elevated in hospitalized samples, while (C and D) HLA-DR and CD27 frequencies were elevated in nonhospitalized samples. (E) PD1 frequencies remained elevated in nonhospitalized group. Boxplots indicate median, IQR, and 95% confidence interval. P values determined by Wilcoxon’s rank-sum test. *P ≤ 0.05, **P ≤ 0.01, ***P ≤ 0.001. Healthy: CoV– (nCoV-= 20), hospitalized: H (nH= 46), nonhospitalized: NH (nNH= 39).
Longitudinal analysis shows sustained immune dysregulation in nonhospitalized convalescent individuals.
We next performed longitudinal analyses comparing the expression of activation and exhaustion markers over time. We did this in 2 ways: (a) observing changes in marker frequencies over time, defined as days after symptom onset (median = 29 days; range 19–40), utilizing all nonhospitalized samples with a recorded date after symptom onset (n = 23); and (b) directly comparing the frequencies of these markers between visit 1 and visit 2 for nonhospitalized patients with samples collected at 2 sequential time points (n = 25).
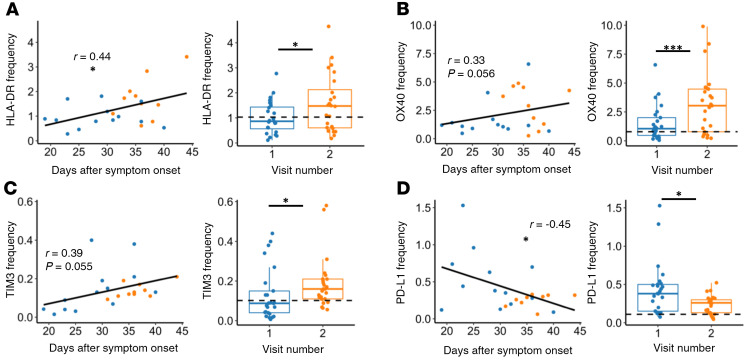
Interestingly, when investigating changes in activation and exhaustion markers, we observed that CD4+ T cell expression of HLA-DR increased over time in our nonhospitalized samples (Figure 5A, P = 0.022 based on days after symptom onset and P = 0.013 based on visit 1/visit 2). Similarly, OX40 and TIM3 frequencies increased over time (Figure 5, B and C), with trending relationships based on days-after-symptom-onset analyses (P = 0.056 and P = 0.055, respectively) and significant relationships based on visit 1/visit 2 analyses (P = 0.001 and P = 0.031, respectively). We also observed an increase in CD69 expression between visit 1 and visit 2 (Supplemental Figure 2A, P = 0.006), and an increase in CD137 based on days after symptom onset (Supplemental Figure 2B, P = 0.027), although these markers were not significantly upregulated over both methods of analysis. In contrast, frequencies of PD-L1 decreased based on days after symptom onset and between visit 1 and visit 2 (Figure 5D, P = 0.028 and P = 0.016, respectively). Taken together, these data showed evidence that CD4+ T cells in nonhospitalized patients continued to express, and even upregulate, T cell activation and exhaustion markers.
Figure 5. CD4+ T cell activation and exhaustion over time in nonhospitalized individuals.
(A–C) HLA-DR, OX40, and TIM3 frequencies increased over time, while (D) PD-L1 frequency decreased over time in nonhospitalized patients. Plots on left show days after symptom onset versus frequency (n = 23, P values determined by mixed-effects model and relationship represented by linear regression; blue: visit 1, orange: visit 2). Plots on right show paired analysis of first versus second visits (n = 25, P values determined by paired Wilcoxon’s signed-rank test). Dotted line shows median values of healthy samples as baseline. Boxplots indicate median, IQR, and 95% confidence interval. *P ≤ 0.05, ***P ≤ 0.001.
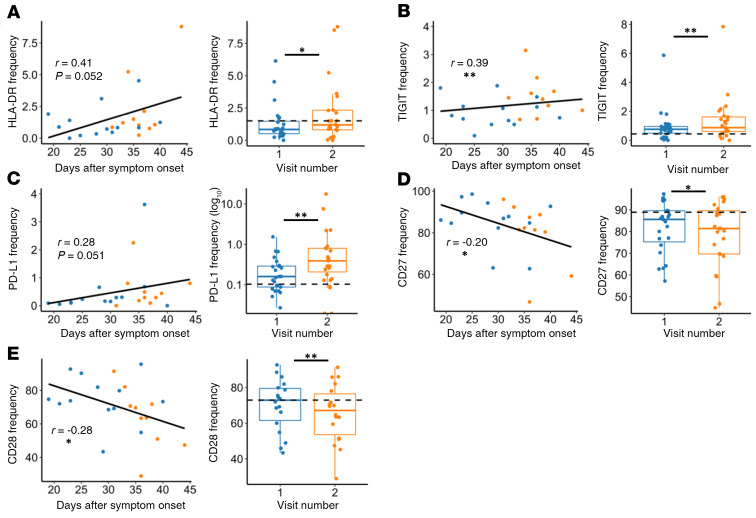
When investigating CD8+ T cell marker frequencies in nonhospitalized individuals longitudinally, we observed a trend toward increased expression of the activation marker HLA-DR based on days-after-symptom-onset analysis and a significant increase based upon visit 1/visit 2 analysis (Figure 6A; P = 0.052 and P = 0.031, respectively). Other activation markers also had an increased frequency at the later time point, including CD69 and CD154 (Supplemental Figure 2, C and D, P < 0.001 and P = 0.007 respectively). Additionally, we found that CD8 T cell expression of exhaustion markers increased in nonhospitalized individuals over time when looking at visit 1/visit 2 analyses for TIGIT and PD-L1 (Figure 6, B and C, P = 0.003 and P = 0.009, respectively), as well as TIM3 (Supplemental Figure 2E, P = 0.036). Meanwhile, days-after-symptom-onset analyses showed a significant increase with TIGIT and a trending increase with PD-L1 (Figure 6, B and C, P = 0.006 and P = 0.051, respectively). We also observed significantly decreased frequencies of CD27 and CD28 based on days-after-symptom-onset and visit 1/visit 2 analyses, albeit with low correlation coefficients (Figure 6, D and E, P = 0.039, P = 0.014, P = 0.035, and P = 0.009, respectively). In summary, we showed that the frequency of several activation and exhaustion markers in CD8+ T cells may initially be lower in nonhospitalized individuals in comparison to the hospitalized group; surprisingly, many of these markers appeared to increase over time in the convalescent phase in these individuals.
Figure 6. CD8+ T cell activation and exhaustion over time in nonhospitalized individuals.
(A–C) Expression of HLA-DR, TIGIT, and PD-L1 increased over time in nonhospitalized individuals, while (D–E) CD27 and CD28 frequencies decreased over time. Plots on left show days after symptom onset versus frequency (n = 23, P values determined by mixed-effects model, relationship represented by linear regression; blue: visit 1, orange: visit 2). Plots on right show paired analysis of first versus second convalescent visits (n = 25, P values determined by paired Wilcoxon’s signed-rank test). Dotted line shows median values of healthy samples as baseline. Boxplots indicate median, IQR, and 95% confidence interval. *P ≤ 0.05, **P ≤ 0.01.
Longitudinal investigation of nonhospitalized patients did not identify B cell markers that significantly differed by both methods of analysis (days after symptom onset and visit 1 versus visit 2 comparison). However, B cells did express higher frequencies of FCRL4 and CD95 based on days after symptom onset, and HLA-DR frequencies increased at the visit 2 time point (Supplemental Figure 3, A–C, P = 0.010, P = 0.023, P = 0.045, respectively). Meanwhile, CD27 frequency decreased over days after symptom onset, with decreased PD1 frequencies in the visit 2 group (Supplemental Figure 3, D and E, P < 0.001 and P = 0.005, respectively). Overall, these data begin to suggest that the B cell population remained activated in nonhospitalized patients well into the convalescent period.
Age affects T cell activation and exhaustion markers in hospitalized and nonhospitalized individuals.
Since older patients with SARS-CoV-2 have higher morbidity and mortality rates (10), we investigated differences related to age in each of our groups. By analyzing samples at the visit 1 time point in the hospitalized group, we found a positive correlation between age and CD8+ T cell expression of CD69 (Supplemental Figure 4A, P = 0.009), as well as a negative correlation between age and CD8 expression of CD27 and CD28 (Supplemental Figure 4, B and C, P = 0.010 and P = 0.003, respectively). We observed a positive correlation between age and frequencies of CD69, CD95, and FCRL4 within the B cell population of our hospitalized individuals (Supplemental Figure 4, D–F; P = 0.024, P = 0.024, and P = 0.014, respectively). Analysis of CD4+ T cells and age in hospitalized individuals had no significant findings. We observed no differences between age and marker frequencies in healthy controls across all subsets.
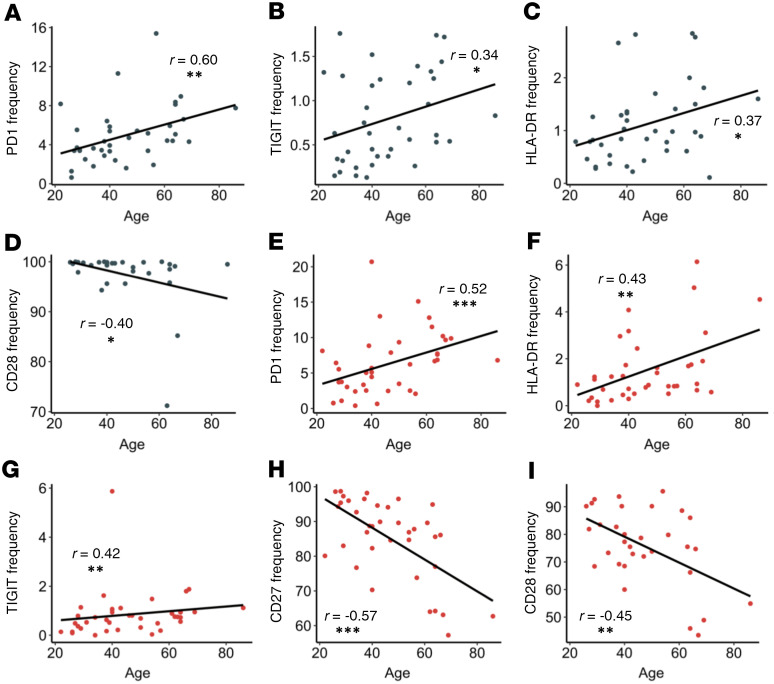
We next investigated any correlations of age and frequency of activation and exhaustion markers in the nonhospitalized group. Our group and others have reported that elderly individuals form suboptimal immune responses after vaccination and infection (43). In this study, within the CD4+ T cell compartment, we observed increased frequencies of PD1, TIGIT, and HLA-DR that correlated positively with age (Figure 7, A–C, P = 0.002, P = 0.032, and P = 0.022, respectively). We also observed a loss of CD28 expression in elderly individuals (Figure 7D, P = 0.027). Similarly, in our CD8+ T cells, there were increased PD1, HLA-DR, and TIGIT frequencies that correlated positively with age (Figure 7, E–G, P < 0.001, P = 0.007, and P = 0.008, respectively), whereas expression of CD27 and CD28 had a negative correlation with age (Figure 7, H and I, P < 0.001 and P = 0.010, respectively). Finally, there was a decrease in CD27+ B cells with age (data not shown, P = 0.007). Of note, T cell and B cell expression of CD27 and CD28 have been shown to decline in the elderly by several groups (44). Although more in-depth studies investigating T cell function with age in SARS-CoV-2–infected individuals are necessary, these data showed that T cell immune dysregulation after SARS-CoV-2 infection was more pronounced in older nonhospitalized patients, suggesting that older individuals may have an impaired ability to form SARS-CoV-2–specific memory responses.
Figure 7. Correlations between T cell marker frequencies and age in nonhospitalized individuals.
(A–C) PD1, TIGIT, and HLA-DR frequencies on CD4+ T cells (gray dots) increased with age. (D) CD28 frequencies on CD4+ T cells decreased with age. (E–G) PD1, HLA-DR, and TIGIT frequencies on CD8+ T (red dots) cells increased with age. (H–I) CD27 and CD28 on CD8+ T cells decreased with age. P and r values determined by Spearman’s rank correlation test. *P ≤ 0.05, **P ≤ 0.01, ***P ≤ 0.001; n = 39.
Hospitalized ICU patients have increased T cell and B cell dysregulation.
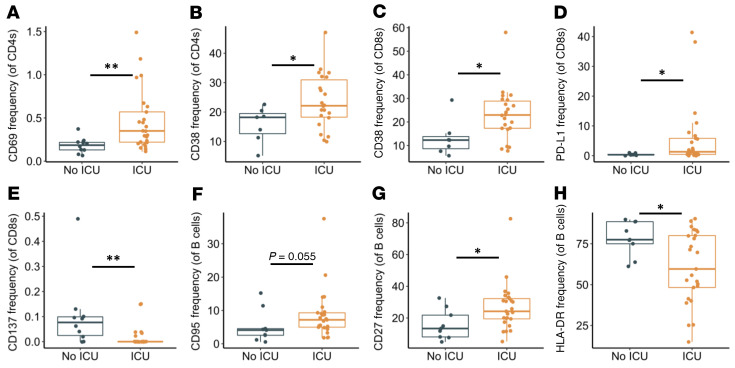
Finally, we evaluated whether severity of illness affected expression of activation and exhaustion markers within our hospitalized group because several other reports have found increased expression of activation/exhaustion markers in severe infection (12–15, 26, 27). We stratified samples from our hospitalized group into 2 groups: ICU (n = 26) and non-ICU patients (n = 10). (Note: 10 samples from the hospitalized group were collected in the convalescent period and thus were excluded in this analysis.) Our analysis found that ICU patients had increased CD69 expression on CD4+ T cells (Figure 8A, P = 0.004), and CD38 frequencies were elevated in CD4+ and CD8+ T cells (Figure 8B And 8C, P = 0.049 and P = 0.025, respectively), similar to recent results (12–15, 26, 27). In addition, the exhaustion marker PD-L1 was found to be elevated in ICU patients (Figure 8D, P = 0.018). Interestingly, the marker CD137 was found to be decreased in frequency in ICU patients (Figure 8E, P = 0.002). Of note, CD137 has been found to play an important role in acute infection within mice (45). B cells from ICU patients had a trending increase in CD95 frequencies and a significant increase in CD27 frequencies, while having decreased expression of HLA-DR (Figure 8, F–H, P = 0.055, P = 0.029, and P = 0.045, respectively). In summary, these findings better define the dysfunctional immune response observed in severe SARS-CoV-2 infection.
Figure 8. Activation and exhaustion markers in viremic hospitalized ICU patients.
Frequencies of CD4+ T cells, CD8+ T cells, and B cells expressing given activation or exhaustion markers in ICU patients. (A and B) Expression of CD69 and CD38 was elevated in CD4+ T cells. (C and D) Expression of CD38 and PDL1 was elevated in CD8+ T cells, while (E) expression of CD137 was decreased. (F and G) CD95 and CD27 expression was increased in B cells, while (H) HLA-DR expression was decreased. Boxplots indicate median, IQR, and 95% confidence interval. P values determined by Wilcoxon’s rank-sum test. *P ≤ 0.05, **P ≤ 0.01. nNo ICU = 10, nICU = 26.
Discussion
Here we provide a comprehensive look at immune cell subsets during and after COVID-19 infection of hospitalized and nonhospitalized individuals. We found dysregulation of several immune cell types in hospitalized patients, whereas most had returned to baseline in nonhospitalized individuals. We also provide an in-depth characterization of the activation and exhaustion phenotype of CD4+ T cells, CD8+ T cells, and B cells. While we observed activation marker upregulation in hospitalized patients, we also found that several activation and exhaustion markers were expressed at higher frequencies in nonhospitalized convalescent samples. When investigating these markers, we observed several positive relationships over time, indicating that immune dysregulation in these individuals did not resolve quickly. We also found that the dysregulation of T cell activation and exhaustion markers in nonhospitalized individuals appeared more pronounced in the elderly. To our knowledge, this is the first description of sustained immune dysregulation due to COVID-19 in a large group of nonhospitalized convalescent patients.
A recent study classified immune subsets in SARS-CoV-2 infection and reported increased frequencies of the classical CD14+ monocyte population in a small cohort of COVID-19–recovered patients (16), and a new report found increased frequencies of “non-T/non-B” cells in patients with COVID-19 (26). Our results found decreased frequencies within monocytes, NK cells, and DCs in hospitalized patients with COVID-19, that then returned to baseline in our nonhospitalized individuals. Taken together, these findings may suggest an influx of immature nonclassical immune cells during infection that needs to be investigated further. Increased percentages of intermediate CD14+CD16+ monocytes in severe SARS-CoV-2 infections have been previously described (46). We found a trend (P = 0.104) toward increased double-positive monocytes in our hospitalized group, and also demonstrated that this monocyte population was elevated in nonhospitalized individuals. The intermediate monocyte population was recently shown to be functionally heterogenous (47), emphasizing the need for more investigation into this subset. Finally, we showed that the frequency of DCs was decreased in hospitalized and nonhospitalized patients. Taken together, these data suggest a prolonged impact of SARS-CoV-2 on the innate immune system in hospitalized and nonhospitalized individuals.
Our investigation into the CD4+ and CD8+ T cell compartments clearly showed sustained activation (based on HLA-DR, CD69, and OX40 expression) and exhaustion (based on PD-L1 and TIGIT expression) in both T cell subsets. Given that PD1 and TIM3 can be upregulated on both activated and exhausted T cells (34, 35), their role after COVID-19 infection remains unclear. Regulatory T cells have previously been shown to upregulate OX40 and HLA-DR (48, 49). The sustained increase in OX40 and HLA-DR in hospitalized and nonhospitalized individuals could represent a regulatory T cell population, further emphasizing the need for further classification and functional assessment of these subsets. The loss of CD27 and CD28 may suggest increased T cell senescence, which is of particular relevance to understanding formation of memory responses.
CD4+ and CD8+ memory T cells are typically generated after the initial activation and expansion stage that occurs in acute infection (50). As previously demonstrated, establishment of airway memory CD4+ T cells mediated protective immunity against respiratory coronaviruses, including SARS and MERS, in a mouse model (51). Here, we observed the sustained expression of T cell activation and exhaustion markers in nonhospitalized, convalescent individuals with SARS-CoV-2, as well as decreased frequencies of CD27- and CD28-expressing CD8+ T cells. These findings may represent an impaired ability to form memory T cells. This is supported by prior observations concerning IL-10 production in SARS and SARS-CoV-2. A prior study found that IL-10 production by regulatory CD4+ T cells was necessary for memory CD8+ T cell development in mice (52). In patients with SARS, there was an increase in IL-10 production during the convalescent phase of infection (53); however, a recent report on SARS-CoV-2–infected individuals found that serum levels of IL-10 were highest during acute infection and decreased in convalescence (15). Overall, these findings provide a possible etiology for how the sustained immune dysfunction observed during convalescence could impair the formation of long-term memory T cells, emphasizing the need to explore memory and regulatory T cell development and function in SARS-CoV-2–infected individuals.
There was substantial B cell activation demonstrated by increased frequencies of CD95+, CD69+, and PD1+ B cells in our hospitalized group. This may reflect both the presence of SARS-CoV-2–specific B cells responding to antigen and/or bystander B cell activation. B cell markers were found to generally return to levels similar to healthy controls, although the sustained presence of FCRL4+ and PD1+ B cells suggests persistence of some degree of B cell dysregulation. How this dysregulation relates to SARS-CoV-2 antibody responses is unknown.
The finding of more pronounced T cell activation/exhaustion in elderly nonhospitalized individuals with SARS-CoV-2 has many potential implications. In acute disease, these findings suggest this group may be at heightened risk for inflammation-mediated pathology. This immune dysfunction may also lead to suboptimal SARS-CoV-2–specific memory responses and increased susceptibility to reinfection. Additional longitudinal studies are needed to better understand the impact of T cell activation on long-term immunity.
We extended our analysis to separate hospitalized patients who did or did not require intensive care. This revealed several differences in surface markers on T and B cell populations. Not surprisingly, activation markers were more frequently observed in severely infected individuals, in support of recent observations on the expression of HLA-DR and CD38 (26, 27). Interestingly, we observed that non-ICU patients had increased expression of CD137. Prior studies observed that CD137 can augment immune responses in acute viral infections, and that blocking CD137 with anti-CD137 antibodies led to increased lymphocytic choriomeningitis virus infection in a mouse model (45). Our findings suggest that CD137 expression may be associated with COVID-19 outcomes. Finally, we found that severely infected COVID-19 patients had increased B cell expression of CD95 and CD27 and decreased expression of HLA-DR. These findings need to be investigated further to explore possible therapeutic interventions.
The prolonged activation we observed, particularly of T cells and monocytes, may be due to the persistence of antigen, either viral RNA and/or protein, despite resolution of symptoms. Support for this observation can be found in studies that identified the persistence of viral RNA in patients with SARS-CoV-2 during the convalescent period (54, 55). Antigen-presenting cells that present viral RNA can cross-prime and activate CD8+ T cells through a TLR3 mechanism (56), which could be similar to what is occurring in SARS-CoV-2–infected individuals. These data open the door to many interesting mechanistic studies to determine what factors are causing and prolonging immune cell activation.
Our current study has a few limitations. For one, our immunophenotyping panel prioritized the identification of some subsets such as lymphocytes and monocytes over others, primarily DCs. Although a marker for CD11c would have increased our ability to identify this population, we believe our gating strategy (CD3–CD19–CD14–CD56–CD16–HLADRhi) still identified a relatively pure population of DCs. Additionally, we acknowledge that there were substantial differences in age, race, and sex among our hospitalized, nonhospitalized, and healthy groups, as summarized in Table 1. These differences reflect the nature of the COVID-19 pandemic, with numerous sources reporting increased hospitalizations and more severe clinical symptoms in elderly and African American populations. We have controlled for this by performing general linear models comparing hospitalized, nonhospitalized, and healthy groups in pairwise models that have each been adjusted for participant age, race, and sex. Results are summarized in Supplemental Tables 1–3. This analysis showed that a majority of the significant relationships as determined by Wilcoxon’s analysis remained significant after adjusting for age, race, and sex. In the remaining relationships that were not significant by hospitalization status, there were also no significant findings to support that these relationships were driven by age, race, or sex. One exception to this was the finding that the decrease in CD16+ monocytes in our hospitalized group appeared to be driven by sex (Supplemental Table 1). In addition, our hospitalized group had an increased frequency of existing comorbidities (shown in Table 1). This was expected since many of these risk factors have been found to correlate with worsening clinical outcomes in COVID-19 infection. Our study provides important insights into acute and subacute COVID-19 immune responses, but leaves questions unanswered in relation to comorbidities and their impact on immunophenotyping. Future studies using larger cohorts should directly examine the potential impact of these comorbidities on immune cell dysregulation in COVID-19 infection.
In conclusion, this study provides broad insight into the regulation of several immune cell subsets and identified immune cell dysregulation in both hospitalized and nonhospitalized SARS-CoV-2–infected individuals. How long T cell and B cell dysregulation persists after COVID-19 infection and whether this may alter immune responsiveness to subsequent infectious insults are not yet clear. Similarly, sustained B cell and T cell activation may have consequences for the development or exacerbation of other inflammatory diseases. These results highlight the need for additional studies in patients with COVID-19 to further define the immune landscape in these individuals.
Methods
Sample collection.
Peripheral blood samples were collected from hospitalized (n = 46) and nonhospitalized (n = 39) patients at the University of Alabama at Birmingham. Samples were also collected from 25 nonhospitalized samples at a second time point. Convalescent status was defined based on patients being asymptomatic for at least 3 consecutive days and being at least 7 days past initial diagnosis. Patient clinical data for hospitalized patients was collected from the electronic medical record; self-reported clinical data was collected for convalescent samples by questionnaire at the time of sample collection and uploaded to REDCap (57). All data and samples were collected in accordance with the University of Alabama at Birmingham’s IRB. All patients had a confirmed positive test for SARS-CoV-2 unless otherwise stated. A summary of patient demographic and clinical status data is shown in Table 1. PBMCs from patient blood samples were harvested using density gradient centrifugation. Additionally, our cohort of healthy (CoV–) individuals was composed of 20 total samples. Of these, frozen PBMCs (n = 17) from before 2019 were used primarily to ensure the absence of asymptomatic SARS-CoV-2 infections; additionally, fresh samples were collected from 3 asymptomatic seronegative individuals, and analysis from each of these samples showed no significant differences between fresh and frozen samples within that individual.
Flow cytometric analyses.
Isolated PBMCs were stained using 1 of 4 phenotyping panels (Supplemental Table 4). Immune cell subsets were identified with the following immunophenotyping panel: CD16-FITC, CD14-A700, CD45-Pecy7, CD19-Percpcy5.5, CD27-PEAlexa610, CD56-BV421, CD3-A780, CD8-V500, CD4-BV785, and HLADR-PE. T cells were further characterized using 2 additional panels: (a) CD8-V500, CD3-BV711, CD4-BV786, CD38-BUV737, CD28-APC; and (b) TIGIT-PerCpCy5.5, PDL1-PE, CD4-PEAlexa610, OX40-Pecy7, TIM3-BV421, CD8-V500, CD137-BV650, PD1-BV785, CD14-BUV563, CD19-BUV563, CD154-APC, CD3-A780. B cell phenotype was assessed using the following panel: CD4-BB790, CD19-AF700, FCRL4-BV480, CD27-BV650, CD69-BUV395, CD8-BUV496, PD1-BUV563, HLA-DR-BUV661, CD95-BUV737. All panels utilized LIVE/DEAD Blue Stain (Life Technologies, Thermo Fisher Scientific) to identify dead cells. After staining, samples were fixed using a 1% formalin solution. Events were collected using a FACS Symphony A3 (BD Biosciences) flow cytometer and analyzed using FlowJo (version 10, Tree Star Inc.) software. Representative gating strategies can be seen in Supplemental Figures 5–8.
Statistics.
All statistical analysis and figure generation was performed using R. Significance between groups was performed using Wilcoxon’s rank-sum test (unpaired) or Wilcoxon’s signed-rank test (paired). Significance between 2 continuous variables was calculated by using a Spearman’s correlation test or a mixed-effects model in order to account for convalescent individuals with multiple time points. Additionally, linear modeling was used to verify that significant relationships between different hospitalization groups were not driven by differences in age, race, or sex. P values of less than 0.05 were considered significant.
Study approval.
This study was approved by the Institutional Review Board at the University of Alabama at Birmingham. Written informed consent was received from all participants prior to inclusion in the study.
Author contributions
Both JKF and MDP performed staining assays for all fresh samples. JKF performed initial flow cytometric immunophenotyping data collection and analysis. JKF, MDP, and KEL performed initial flow cytometric T cell data collection and analysis. S Sarkar performed initial flow cytometric B cell data collection and analysis. SB and JKF performed finalized data analyses and statistical tests, accessed most clinical information, and generated all figures. JKF primarily wrote the paper, receiving assistance from KQ, MDP, KEL, and S Sarkar for the introduction; assistance from SB for the results; and assistance from SB, MDP, KEL, and JK for the discussion. All authors provided edits and feedback. S Sterrett helped provide initial clinical data. JKF, SB, KQ, S Sterrett, EC, and JK all assisted with PBMC processing. AB and S Sabbaj provided critical scientific expertise and comments. OK, JK, PAG, and NE all provided scientific knowledge, as well as supplies including the required flow cytometry antibodies. PAG and NE recruited patients and obtained all clinical samples.
Supplementary Material
Acknowledgments
We would like to thank the University of Alabama Department of Medicine for the funding of this project. We would like to thank all patients for giving consent for sample collection for this study. Additionally, we want to thank the clinical collection and University of Alabama at Birmingham (UAB) Center for AIDS Research (CFAR) biorepository teams for their assistance in sample collection, as well as the hospital staff for their dedication in fighting coronavirus. We would like to acknowledge Lynn Pritchard, Tim Fram, and David Moylan, who all processed several PBMC samples used in this project, as well as the UAB CFAR Basic Research Core (P30 AI027767-31) for use of the flow cytometer and BSL2+ facility. Finally, we would also like to acknowledge Anisha Jackson and Ainsley Greenstein for help in obtaining clinical data.
Version 1. 10/29/2020
In-Press Preview
Version 2. 01/04/2021
Print issue publication
Funding Statement
Funding was provided by the University of Alabama at Birmingham Department and School of Medicine.
Footnotes
Conflict of interest: The authors have declared that no conflict of interest exists.
Copyright: © 2021, American Society for Clinical Investigation.
Reference information: J Clin Invest. 2021;131(1):e140491.https://doi.org/10.1172/JCI140491.
See the related Commentary at Prolonged adaptive immune activation in COVID-19: implications for maintenance of long-term immunity?.
Contributor Information
Jacob K. Files, Email: jkfiles@uab.edu.
Sushma Boppana, Email: sboppana4@uab.edu.
Mildred D. Perez, Email: mperez14@uab.edu.
Sanghita Sarkar, Email: ssarkar@uabmc.edu.
Kelsey E. Lowman, Email: klowman@uabmc.edu.
Kai Qin, Email: qinkai@uab.edu.
Sarah Sterrett, Email: sarahsterrett@uabmc.edu.
Eric Carlin, Email: ecarlin@uab.edu.
Anju Bansal, Email: anjubansal@uabmc.edu.
Steffanie Sabbaj, Email: sabbaj@uab.edu.
Dustin M. Long, Email: dmlong@uab.edu.
Olaf Kutsch, Email: olafkutsch@uabmc.edu.
James Kobie, Email: jjkobie@uabmc.edu.
References
- 1.Zhu N, et al. A novel coronavirus from patients with pneumonia in China, 2019. N Engl J Med. 2020;382(8):727–733. doi: 10.1056/NEJMoa2001017. [DOI] [PMC free article] [PubMed] [Google Scholar]
- 2.Li Q, et al. Early transmission dynamics in Wuhan, China, of novel coronavirus-infected pneumonia. N Engl J Med. 2020;382(13):1199–1207. doi: 10.1056/NEJMoa2001316. [DOI] [PMC free article] [PubMed] [Google Scholar]
- 3.Wang W, et al. Detection of SARS-CoV-2 in different types of clinical specimens. JAMA. 2020;323(18):1843–1844. doi: 10.1001/jama.2020.3786. [DOI] [PMC free article] [PubMed] [Google Scholar]
- 4.Richardson S, et al. Presenting characteristics, comorbidities, and outcomes among 5700 patients hospitalized with COVID-19 in the New York City area. JAMA. 2020;323(20):2052–2059. doi: 10.1001/jama.2020.6775. [DOI] [PMC free article] [PubMed] [Google Scholar]
- 5.Huang C, et al. Clinical features of patients infected with 2019 novel coronavirus in Wuhan, China. Lancet. 2020;395(10223):497–506. doi: 10.1016/S0140-6736(20)30183-5. [DOI] [PMC free article] [PubMed] [Google Scholar]
- 6.Chen N, et al. Epidemiological and clinical characteristics of 99 cases of 2019 novel coronavirus pneumonia in Wuhan, China: a descriptive study. Lancet. 2020;395(10223):507–513. doi: 10.1016/S0140-6736(20)30211-7. [DOI] [PMC free article] [PubMed] [Google Scholar]
- 7. Johns Hopkins Coronavirus Resource Center. Johns Hopkins website. https://coronavirus.jhu.edu/ Updated September 21, 2020. Accessed September 21, 2020.
- 8.Wang F, et al. Characteristics of peripheral lymphocyte subset alteration in COVID-19 pneumonia. J Infect Dis. 2020;221(11):1762–1769. doi: 10.1093/infdis/jiaa150. [DOI] [PMC free article] [PubMed] [Google Scholar]
- 9.Guan WJ, et al. Clinical characteristics of coronavirus disease 2019 in China. N Engl J Med. 2020;382(18):1708–1720. doi: 10.1056/NEJMoa2002032. [DOI] [PMC free article] [PubMed] [Google Scholar]
- 10.Wang D, et al. Clinical characteristics of 138 hospitalized patients with 2019 novel coronavirus-infected pneumonia in Wuhan, China. JAMA. 2020;323(11):1061–1069. doi: 10.1001/jama.2020.1585. [DOI] [PMC free article] [PubMed] [Google Scholar]
- 11.Chen G, et al. Clinical and immunological features of severe and moderate coronavirus disease 2019. J Clin Invest. 2020;130(5):2620–2629. doi: 10.1172/JCI137244. [DOI] [PMC free article] [PubMed] [Google Scholar]
- 12.Zheng HY, et al. Elevated exhaustion levels and reduced functional diversity of T cells in peripheral blood may predict severe progression in COVID-19 patients. Cell Mol Immunol. 2020;17(5):541–543. doi: 10.1038/s41423-020-0401-3. [DOI] [PMC free article] [PubMed] [Google Scholar]
- 13.Zheng M, et al. Functional exhaustion of antiviral lymphocytes in COVID-19 patients. Cell Mol Immunol. 2020;17(5):533–535. doi: 10.1038/s41423-020-0402-2. [DOI] [PMC free article] [PubMed] [Google Scholar]
- 14.Ong EZ, et al. A dynamic immune response shapes COVID-19 progression. Cell Host Microbe. 2020;27(6):879–882.e2. doi: 10.1016/j.chom.2020.03.021. [DOI] [PMC free article] [PubMed] [Google Scholar]
- 15.Diao B, et al. Reduction and functional exhaustion of T cells in patients with coronavirus disease 2019 (COVID-19) Front Immunol. 2020;11:827. doi: 10.3389/fimmu.2020.00827. [DOI] [PMC free article] [PubMed] [Google Scholar]
- 16.Wen W, et al. Immune cell profiling of COVID-19 patients in the recovery stage by single-cell sequencing. Cell Discov. 2020;6:Article31. doi: 10.1038/s41421-020-0168-9. [DOI] [PMC free article] [PubMed] [Google Scholar]
- 17.Grifoni A, et al. Targets of T cell responses to SARS-CoV-2 coronavirus in humans with COVID-19 disease and unexposed individuals. Cell. 2020;181(7):1489–1501.e15. doi: 10.1016/j.cell.2020.05.015. [DOI] [PMC free article] [PubMed] [Google Scholar]
- 18.Ni L, et al. Detection of SARS-CoV-2-specific humoral and cellular immunity in COVID-19 convalescent individuals. Immunity. 2020;52(6):971–977.e3. doi: 10.1016/j.immuni.2020.04.023. [DOI] [PMC free article] [PubMed] [Google Scholar]
- 19.Yin Y, Wunderink RG. MERS, SARS and other coronaviruses as causes of pneumonia. Respirology. 2018;23(2):130–137. doi: 10.1111/resp.13196. [DOI] [PMC free article] [PubMed] [Google Scholar]
- 20.Assiri A, et al. Epidemiological, demographic, and clinical characteristics of 47 cases of Middle East respiratory syndrome coronavirus disease from Saudi Arabia: a descriptive study. Lancet Infect Dis. 2013;13(9):752–761. doi: 10.1016/S1473-3099(13)70204-4. [DOI] [PMC free article] [PubMed] [Google Scholar]
- 21.Chen H, et al. Response of memory CD8+ T cells to severe acute respiratory syndrome (SARS) coronavirus in recovered SARS patients and healthy individuals. J Immunol. 2005;175(1):591–598. doi: 10.4049/jimmunol.175.1.591. [DOI] [PubMed] [Google Scholar]
- 22.Chen J, Subbarao K. The immunobiology of SARS*. Annu Rev Immunol. 2007;25:443–472. doi: 10.1146/annurev.immunol.25.022106.141706. [DOI] [PubMed] [Google Scholar]
- 23.Zhao J, Zhao J, Perlman S. T cell responses are required for protection from clinical disease and for virus clearance in severe acute respiratory syndrome coronavirus-infected mice. J Virol. 2010;84(18):9318–9325. doi: 10.1128/JVI.01049-10. [DOI] [PMC free article] [PubMed] [Google Scholar]
- 24.Wang F, et al. The laboratory tests and host immunity of COVID-19 patients with different severity of illness. JCI Insight. 2020;5(10):137799. doi: 10.1172/jci.insight.137799. [DOI] [PMC free article] [PubMed] [Google Scholar]
- 25.Thevarajan I, et al. Breadth of concomitant immune responses prior to patient recovery: a case report of non-severe COVID-19. Nat Med. 2020;26(4):453–455. doi: 10.1038/s41591-020-0819-2. [DOI] [PMC free article] [PubMed] [Google Scholar]
- 26.Mathew D, et al. Deep immune profiling of COVID-19 patients reveals distinct immunotypes with therapeutic implications. Science. 2020;369(6508):eabc8511. doi: 10.1126/science.abc8511. [DOI] [PMC free article] [PubMed] [Google Scholar]
- 27.Kuri-Cervantes L, et al. Comprehensive mapping of immune perturbations associated with severe COVID-19. Sci Immunol. 2020;5(49):eabd7114. doi: 10.1126/sciimmunol.abd7114. [DOI] [PMC free article] [PubMed] [Google Scholar]
- 28.Wang Z, et al. Clonally diverse CD38+HLA-DR+CD8+ T cells persist during fatal H7N9 disease. Nat Commun. 2018;9(1):824. doi: 10.1038/s41467-018-03243-7. [DOI] [PMC free article] [PubMed] [Google Scholar]
- 29.Isa A, et al. Prolonged activation of virus-specific CD8+ T cells after acute B19 infection. PLoS Med. 2005;2(12):e343. doi: 10.1371/journal.pmed.0020343. [DOI] [PMC free article] [PubMed] [Google Scholar]
- 30.Wong SS, et al. Severe influenza is characterized by prolonged immune activation: results from the SHIVERS Cohort Study. J Infect Dis. 2018;217(2):245–256. doi: 10.1093/infdis/jix571. [DOI] [PMC free article] [PubMed] [Google Scholar]
- 31.Choe PG, et al. MERS-CoV antibody responses 1 year after symptom onset, South Korea, 2015. Emerging Infect Dis. 2017;23(7):1079–1084. doi: 10.3201/eid2307.170310. [DOI] [PMC free article] [PubMed] [Google Scholar]
- 32.Chen T, et al. Clinical characteristics of 113 deceased patients with coronavirus disease 2019: retrospective study. BMJ. 2020;368:m1091. doi: 10.1136/bmj.m1091. [DOI] [PMC free article] [PubMed] [Google Scholar]
- 33.Scharenberg M, et al. Influenza A virus infection induces hyperresponsiveness in human lung tissue-resident and peripheral blood NK cells. Front Immunol. 2019;10:1116. doi: 10.3389/fimmu.2019.01116. [DOI] [PMC free article] [PubMed] [Google Scholar]
- 34.Gorman JV, Colgan JD. Regulation of T cell responses by the receptor molecule Tim-3. Immunol Res. 2014;59(1-3):56–65. doi: 10.1007/s12026-014-8524-1. [DOI] [PMC free article] [PubMed] [Google Scholar]
- 35.Jubel JM, Barbati ZR, Burger C, Wirtz DC, Schildberg FA. The role of PD-1 in acute and chronic infection. Front Immunol. 2020;11:487. doi: 10.3389/fimmu.2020.00487. [DOI] [PMC free article] [PubMed] [Google Scholar]
- 36.Effros RB. Loss of CD28 expression on T lymphocytes: a marker of replicative senescence. Dev Comp Immunol. 1997;21(6):471–478. doi: 10.1016/S0145-305X(97)00027-X. [DOI] [PubMed] [Google Scholar]
- 37.Jourdan M, et al. Characterization of human FCRL4-positive B cells. PLoS One. 2017;12(6):e0179793. doi: 10.1371/journal.pone.0179793. [DOI] [PMC free article] [PubMed] [Google Scholar]
- 38.Weiss GE, et al. Atypical memory B cells are greatly expanded in individuals living in a malaria-endemic area. J Immunol. 2009;183(3):2176–2182. doi: 10.4049/jimmunol.0901297. [DOI] [PMC free article] [PubMed] [Google Scholar]
- 39.Poonia B, Ayithan N, Nandi M, Masur H, Kottilil S. HBV induces inhibitory FcRL receptor on B cells and dysregulates B cell-T follicular helper cell axis. Sci Rep. 2018;8(1):15296. doi: 10.1038/s41598-018-33719-x. [DOI] [PMC free article] [PubMed] [Google Scholar]
- 40.Moir S, et al. Evidence for HIV-associated B cell exhaustion in a dysfunctional memory B cell compartment in HIV-infected viremic individuals. J Exp Med. 2008;205(8):1797–1805. doi: 10.1084/jem.20072683. [DOI] [PMC free article] [PubMed] [Google Scholar]
- 41.Amara K, et al. B cells expressing the IgA receptor FcRL4 participate in the autoimmune response in patients with rheumatoid arthritis. J Autoimmun. 2017;81:34–43. doi: 10.1016/j.jaut.2017.03.004. [DOI] [PMC free article] [PubMed] [Google Scholar]
- 42.Ehrhardt GR, et al. Expression of the immunoregulatory molecule FcRH4 defines a distinctive tissue-based population of memory B cells. J Exp Med. 2005;202(6):783–791. doi: 10.1084/jem.20050879. [DOI] [PMC free article] [PubMed] [Google Scholar]
- 43.Sterrett S, et al. Peripheral CD4 T follicular cells induced by a conjugated pneumococcal vaccine correlate with enhanced opsonophagocytic antibody responses in younger individuals. Vaccine. 2020;38(7):1778–1786. doi: 10.1016/j.vaccine.2019.12.023. [DOI] [PMC free article] [PubMed] [Google Scholar]
- 44.Chong Y, et al. CD27(+) (memory) B cell decrease and apoptosis-resistant CD27(–) (naive) B cell increase in aged humans: implications for age-related peripheral B cell developmental disturbances. Int Immunol. 2005;17(4):383–390. doi: 10.1093/intimm/dxh218. [DOI] [PubMed] [Google Scholar]
- 45.Zhang B, et al. Immune suppression or enhancement by CD137 T cell costimulation during acute viral infection is time dependent. J Clin Invest. 2007;117(10):3029–3041. doi: 10.1172/JCI32426. [DOI] [PMC free article] [PubMed] [Google Scholar]
- 46.Zhou Y, et al. Pathogenic T cells and inflammatory monocytes incite inflammatory storm in severe COVID-19 patients. Natl Sci Rev. 2020:nwaa041. doi: 10.1093/nsr/nwaa041. [DOI] [PMC free article] [PubMed] [Google Scholar]
- 47.Villani AC, et al. Single-cell RNA-seq reveals new types of human blood dendritic cells, monocytes, and progenitors. Science. 2017;356(6335):eaah4573. doi: 10.1126/science.aah4573. [DOI] [PMC free article] [PubMed] [Google Scholar]
- 48.Reiss S, et al. Comparative analysis of activation induced marker (AIM) assays for sensitive identification of antigen-specific CD4 T cells. PLoS One. 2017;12(10):e0186998. doi: 10.1371/journal.pone.0186998. [DOI] [PMC free article] [PubMed] [Google Scholar]
- 49.Machicote A, Belén S, Baz P, Billordo LA, Fainboim L. Human CD8+HLA-DR+ regulatory T cells, similarly to classical CD4+Foxp3+ cells, suppress immune responses via PD-1/PD-L1 axis. Front Immunol. 2018;9:2788. doi: 10.3389/fimmu.2018.02788. [DOI] [PMC free article] [PubMed] [Google Scholar]
- 50.Wherry EJ, Ahmed R. Memory CD8 T-cell differentiation during viral infection. J Virol. 2004;78(11):5535–5545. doi: 10.1128/JVI.78.11.5535-5545.2004. [DOI] [PMC free article] [PubMed] [Google Scholar]
- 51.Zhao J, et al. Airway memory CD4(+) T cells mediate protective immunity against emerging respiratory coronaviruses. Immunity. 2016;44(6):1379–1391. doi: 10.1016/j.immuni.2016.05.006. [DOI] [PMC free article] [PubMed] [Google Scholar]
- 52.Laidlaw BJ, et al. Production of IL-10 by CD4(+) regulatory T cells during the resolution of infection promotes the maturation of memory CD8(+) T cells. Nat Immunol. 2015;16(8):871–879. doi: 10.1038/ni.3224. [DOI] [PMC free article] [PubMed] [Google Scholar]
- 53.Zhang Y, et al. Analysis of serum cytokines in patients with severe acute respiratory syndrome. Infect Immun. 2004;72(8):4410–4415. doi: 10.1128/IAI.72.8.4410-4415.2004. [DOI] [PMC free article] [PubMed] [Google Scholar]
- 54.Chen D, et al. Recurrence of positive SARS-CoV-2 RNA in COVID-19: a case report. Int J Infect Dis. 2020;93:297–299. doi: 10.1016/j.ijid.2020.03.003. [DOI] [PMC free article] [PubMed] [Google Scholar]
- 55.Wölfel R, et al. Virological assessment of hospitalized patients with COVID-2019. Nature. 2020;581(7809):465–469. doi: 10.1038/s41586-020-2196-x. [DOI] [PubMed] [Google Scholar]
- 56.Schulz O, et al. Toll-like receptor 3 promotes cross-priming to virus-infected cells. Nature. 2005;433(7028):887–892. doi: 10.1038/nature03326. [DOI] [PubMed] [Google Scholar]
- 57.Harris PA, et al. The REDCap consortium: building an international community of software platform partners. J Biomed Inform. 2019;95:103208. doi: 10.1016/j.jbi.2019.103208. [DOI] [PMC free article] [PubMed] [Google Scholar]
Associated Data
This section collects any data citations, data availability statements, or supplementary materials included in this article.


