Abstract
The RNA-binding protein Apobec1 complementation factor (A1CF) regulates posttranscriptional ApoB mRNA editing, but the range of RNA targets and the long-term effect of altered A1CF expression on liver function are unknown. Here we studied hepatocyte-specific A1cf-transgenic (A1cf+/Tg), A1cf+/Tg Apobec1–/–, and A1cf–/– mice fed chow or high-fat/high-fructose diets using RNA-Seq, RNA CLIP-Seq, and tissue microarrays from human hepatocellular cancer (HCC). A1cf+/Tg mice exhibited increased hepatic proliferation and steatosis, with increased lipogenic gene expression (Mogat1, Mogat2, Cidea, Cd36) associated with shifts in polysomal RNA distribution. Aged A1cf+/Tg mice developed spontaneous fibrosis, dysplasia, and HCC, and this development was accelerated on a high-fat/high-fructose diet and was independent of Apobec1. RNA-Seq revealed increased expression of mRNAs involved in oxidative stress (Gstm3, Gpx3, Cbr3), inflammatory response (Il19, Cxcl14, Tnfα, Ly6c), extracellular matrix organization (Mmp2, Col1a1, Col4a1), and proliferation (Kif20a, Mcm2, Mcm4, Mcm6), and a subset of mRNAs (including Sox4, Sox9, Cdh1) were identified in RNA CLIP-Seq. Increased A1CF expression in human HCC correlated with advanced fibrosis and with reduced survival in a subset with nonalcoholic fatty liver disease. In conclusion, we show that hepatic A1CF overexpression selectively alters polysomal distribution and mRNA expression, promoting lipogenic, proliferative, and inflammatory pathways leading to HCC.
Keywords: Hepatology, Metabolism
Keywords: Liver cancer, RNA processing
Introduction
The increasing worldwide prevalence of nonalcoholic fatty liver disease (NAFLD) is projected to result in a corresponding increase in major progressive outcomes, including nonalcoholic steatohepatitis, fibrosis, and hepatocellular cancer (HCC) (1). These comorbid complications of NAFLD represent a pressing concern, particularly with the emergence of HCC as an increasingly common worldwide cause of cancer-associated mortality (2). In addition, because NAFLD progression is associated with a range of other comorbidities, including cardiovascular disease (the leading cause of death among patients with NAFLD; ref. 3), there is also an increasing need to understand the role of both genetic and environmental modifiers in the etiology and progression of those important comorbidities. Among the genes identified in NAFLD susceptibility, several have been implicated in HCC development, including TM6SF2, PNPLA3, MBOAT7, and APOB, suggesting that alterations in genes that regulate critical pathways in hepatic lipid compartmentalization and/or VLDL secretion may play key roles in both NAFLD development and disease progression (4). In relation to NAFLD and cardiovascular disease risk, the E167K variant of TM6SF2 (rs 58542929 C/T) is an important modifier of both blood lipid levels and hepatic steatosis, with the rare T variant conferring protection against cardiovascular disease because of reduced hepatic VLDL secretion but with a consequence of increased steatosis and NAFLD development (5).
The association of cardiovascular disease and NAFLD has fueled interest in the mechanisms regulating hepatic apolipoprotein B (APOB) and VLDL production in humans, including the possibility that therapeutic targeting of VLDL secretion might offer clinical utility as a strategy for lowering plasma lipid levels. While some reports suggest that antisense targeting of APOB might be feasible without the adverse effects of hepatic steatosis (6), the predominant clinical experience suggests that reducing lipid levels by inhibiting VLDL secretion also promotes hepatic steatosis (7, 8), although the long-term consequences are still unknown. Other studies have demonstrated a role for epigenetic or posttranscriptional gene regulation of APOB expression, including a role for Apobec1 complementation factor (A1CF), an AU-rich RNA-binding protein, identified in earlier screens for genetic complementation of C-to-U RNA editing activity of the cytidine deaminase APOBEC1 (9, 10). A1CF is widely expressed in both human and mouse tissues, including at high levels in the liver, where it binds a range of RNAs, including ApoB and Il6 (11). A1cf-null mice revealed distinctive alterations in APOBEC1-dependent C-to-U RNA editing, yet these mice revealed no change in hepatic ApoB mRNA editing or expression (12, 13). However, neither of those studies examined the impact of A1cf deletion on the regulation of hepatic lipid metabolism or the longer-range impact for metabolic liver disease. Earlier studies showed that hepatic A1CF was upregulated in ob/ob mice and that siRNA knockdown in hepatocytes impaired VLDL secretion (14). These studies collectively raise the possibility that A1CF might exhibit both gain- and loss-of-function phenotypes in vivo, consistent with findings that an A1CF variant allele is a causal gene for regulating serum triglyceride (TG) levels in humans (15).
Here we report studies that address these unanswered questions. We generated liver-specific A1cf-transgenic mice, revealing a phenotype with spontaneous steatosis, fibrosis, and HCC, none of which were observed in A1cf-null mice. We identified a range of hepatic A1CF RNA targets and pathways, including oxidative stress, inflammation, and extracellular matrix organization. Finally, we demonstrate that A1CF was overexpressed in a subset of patients with HCC. The findings collectively point to a new role for the RNA-binding protein A1CF in liver pathobiology in both mice and humans.
Results
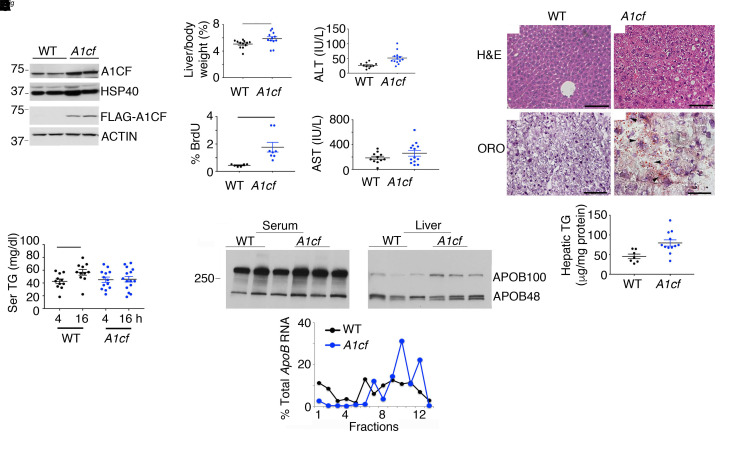
A1cf+/Tgmice exhibit increased hepatocyte proliferation and a subtle shift in VLDL secretion. We generated two A1cf+/Tg founder lines (Supplemental Figure 1) with similar expression of the transgene (about 2- to 3-fold above endogenous; Figure 1A), localized predominantly in hepatocyte nuclei (Supplemental Figure 1A). Young (8- to 14-week-old), chow-fed A1cf+/Tg mice revealed elevated liver/body weight ratios and injury reflected by 2-fold increased serum alanine aminotransferase (Figure 1B), with no change in aspartate aminotransferase. We observed increased BrdU-positive hepatocytes in A1cf+/Tg mice (Figure 1B and Supplemental Figure 1B) with increased α-fetoprotein (Afp) mRNA, consistent with increased proliferation (Supplemental Figure 1B). There were more lipid droplets in A1cf+/Tg mice with increased hepatic TG content (Figure 1C). Hepatic and serum total cholesterol and fatty acids (FAs) were unaltered in A1cf+/Tg mice (Supplemental Figure 1C). Fasting serum TGs were comparable in both genotypes after a 4-hour fast (Figure 1D), but A1cf+/Tg mice showed no increase following a 16-hour fast compared with controls (Figure 1D and Supplemental Figure 1C), suggesting subtle impairment of VLDL secretion (16). We also found relatively increased APOB100 in livers of A1cf+/Tg mice, along with a shift of ApoB mRNA into actively translating polysomal fractions (Figure 1E), further suggesting impaired VLDL assembly and secretion in these mice. Fractionation of serum indicated a shift into smaller TG- and cholesterol-containing VLDL fractions (Figure 2A), with smaller nascent VLDL particles visualized in A1cf+/Tg mice (Figure 2A). In addition, studies in isolated hepatocytes revealed decreased secretion of APOB from A1cf+/Tg mice (Figure 2B), even though in vivo VLDL-TG secretion rates were comparable in both genotypes after either 4- or 16-hour fast (Supplemental Figure 1D). These data collectively suggest that hepatic A1cf overexpression results in decreased APOB secretion associated with a shift in VLDL secretion toward smaller particles.
Figure 1. Young (8- to 14-week-old) A1cf+/Tg mice on chow diet exhibit increased proliferation and hepatic steatosis.
(A) Western blot of A1cf transgene expression in A1cf+/Tg liver using A1CF and FLAG antibodies. (B) Liver/body weight ratio of A1cf+/Tg mice, represented as mean ± SEM, *P < 0.05. Serum alanine aminotransferase (ALT) and aspartate aminotransferase (AST) in A1cf+/Tg mice (11–13 per genotype). Data are shown as mean ± SEM, **P < 0.01. Proliferative index expressed as percentage of BrdU-positive hepatocytes (mean ± SEM, n = 6–8), **P < 0.01. (C) H&E- and Oil Red O–stained liver sections from A1cf+/Tg mice. Scale bars: 50 μm. Hepatic triglyceride (TG) content (mean ± SEM, 7–12 mice), **P < 0.01. (D) Serum TG after 4- or 16-hour fast (n = 11–15 animals per group). Data are mean ± SEM, *P < 0.05. (E) Western blot of serum and hepatic APOB. Polysomal distribution of ApoB RNA upon fractionation of hepatic cytoplasmic extracts from A1cf+/Tg mice: monosome (fractions 1–6) and polysome (fractions 7–13). Data are representative of 4 separate isolations. Unpaired Student’s t test was used to determine significance between A1cf+/Tg and WT control groups for all experiments.
Figure 2. Young A1cf+/Tg mice show reduced APOB secretion and smaller VLDL particles.
(A) Serum lipoprotein profile (n = 4 per group) following a 4-hour fast and fractionation by fast protein liquid chromatography. TG and cholesterol levels were biochemically determined. Bottom panel: Electron microscopy of serum VLDL particles isolated from pooled serum, 4 hours after Pluronic F-127 injection. Scale bars: 500 nm. Unpaired Student’s t test was used to determine significance between groups. Size distribution of VLDL particles is representative of 3 separate evaluations, **P < 0.01. (B) Pulse chase analysis of [35S]-labeled APOB synthesis and secretion from primary hepatocytes isolated from A1cf+/Tg mice. Autoradiograph is a representative image of 3 independent experiments.
Prompted by findings showing that A1cf deletion in liver-like hepatoma cells decreased APOB secretion (15), we examined hepatic and serum lipid metabolism in A1cf–/– mice. However, we found no significant changes in serum or hepatic TG or cholesterol content and no change in VLDL secretion or in serum or hepatic APOB content or isoform distribution in A1cf–/– mice (Supplemental Figure 2, A–D). We generated 2 independent lines of HepG2 CRISPR-deleted A1CF-null cells (17), which revealed an approximately 30% decrease in both APOB synthesis and secretion (Supplemental Figure 2, E and F). Taken together, these findings suggest that loss of A1CF slightly decreases APOB production in HepG2 cells but does not alter APOB expression or VLDL secretion in mouse liver.
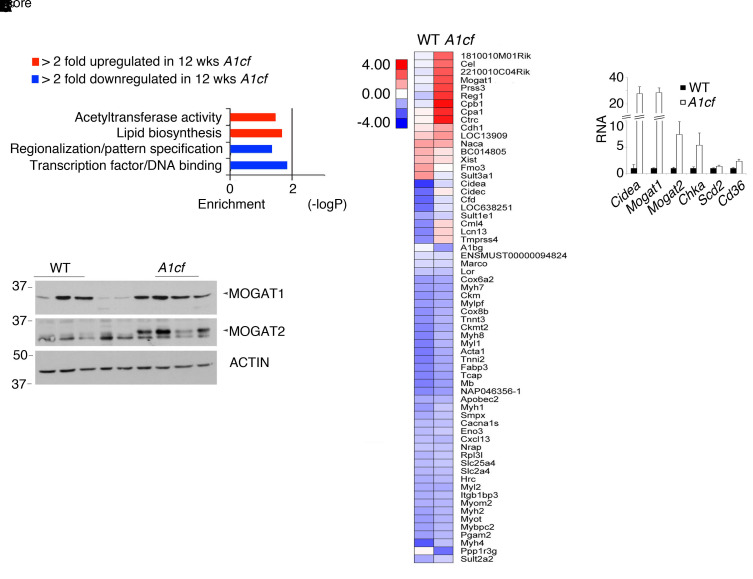
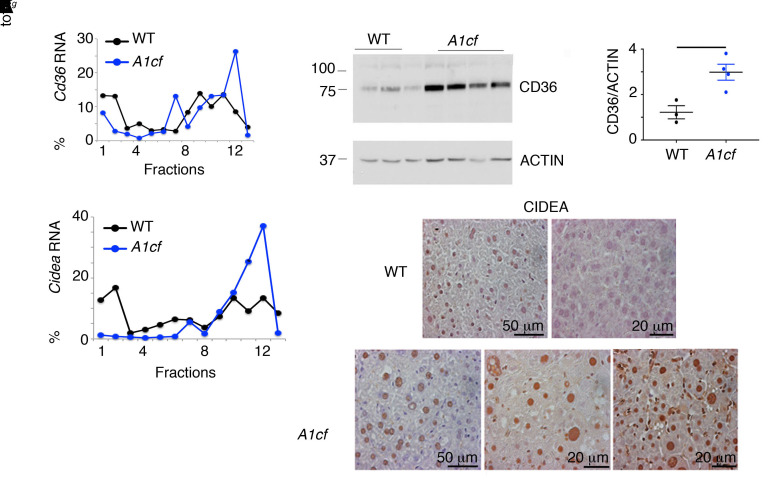
A1cf+/Tgmice exhibit altered expression of genes promoting FA uptake and lipogenesis. We undertook RNA pathway analysis to understand the changes associated with the spontaneous hepatic steatosis observed in young A1cf+/Tg mice. Gene ontology revealed enrichment in genes involved in lipid biosynthesis (Figure 3A), including Cidea, Mogat1, Mogat2, and Cd36 (18–20). Quantitative PCR (qPCR) revealed a 30-fold increase in Cidea and Mogat1 mRNAs, a 10-fold increase in Mogat2 mRNA, and a 2-fold increase in Cd36 mRNA (Figure 3B). We also observed increased MOGAT1 and MOGAT2 protein abundance in A1cf+/Tg liver (Figure 3C). Analysis of both Cidea and Cd36 RNAs revealed a shift into actively translating polysomal fractions (Figure 4A), associated with approximately 3-fold increased CD36 and (qualitative) CIDEA protein expression (Figure 4B). Collectively, these results suggest that hepatic A1CF modulates genes involved in hepatic lipogenesis and FA utilization as well as hepatic VLDL assembly and secretion, conceivably by altering polysomal mRNA distribution and translation.
Figure 3. Hepatic enrichment in genes involved in lipid biosynthesis in A1cf+/Tg mice.
Expression profile of liver-enriched genes in 8- to 14-week-old chow-fed A1cf+/Tg mice. (A) Enriched KEGG pathways in differentially expressed genes from A1cf+/Tg livers. Heatmap diagram of the more than 2-fold differentially expressed genes in A1cf+/Tg mice. (B) qPCR validation of differentially upregulated genes involved in lipid biosynthesis (n = 6–7 mice per genotype). Data are mean ± SEM. Unpaired Student’s t test was used to determine significance between genotypes, *P < 0.05, **P < 0.01. (C) Western blot analysis of MOGAT1 and MOGAT2 in livers from chow-fed A1cf+/Tg mice. Actin was used as loading control. (n = 4–5 mice per genotype.)
Figure 4. Altered expression of genes promoting fatty acid uptake and lipogenesis in A1cf+/Tg mice.
(A) Polysomal distribution of Cd36 and Cidea RNAs from cytoplasmic extracts from A1cf+/Tg liver. RNA abundance was quantitated by qPCR across monosome (fractions 1–6) and polysome (fractions 7–13). Data are representative of 3 separate fractionations. (B) Western blot analysis of CD36 in liver of A1cf+/Tg mice using actin as loading control. Data are mean ± SEM. Significance was determined using unpaired Student’s t test, *P < 0.05. Immunohistochemical analysis of CIDEA in liver of A1cf+/Tg mice and littermate controls.
A1cf+/Tg mice develop hepatic fibrosis and spontaneous tumorigenesis, independent of APOBEC1 expression.
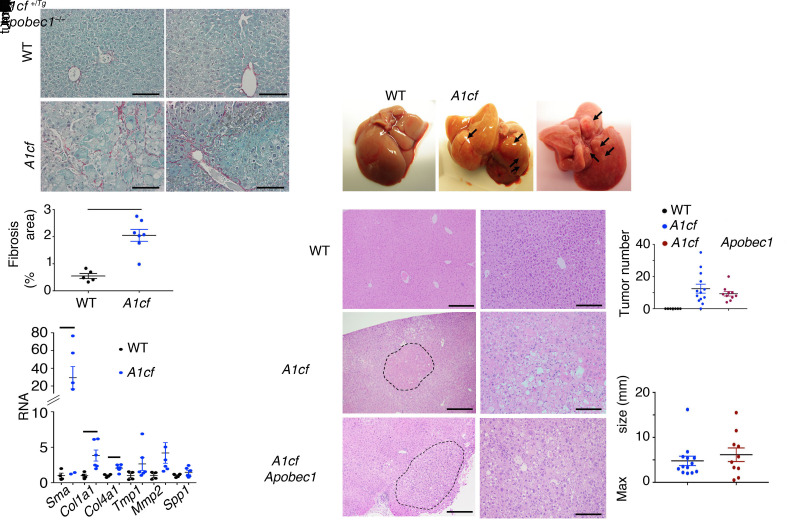
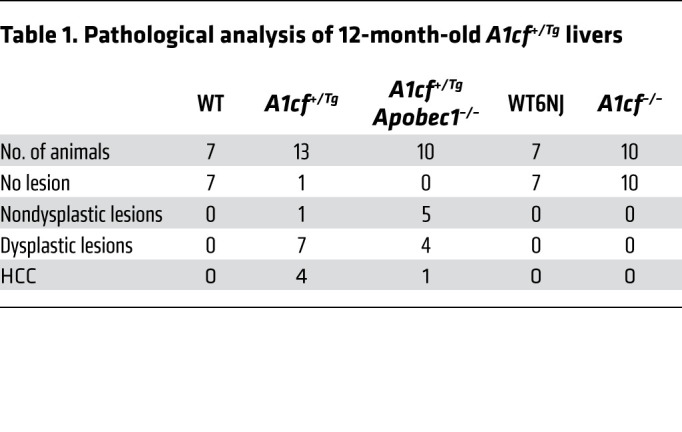
Aged (~12-month-old) A1cf+/Tg mice exhibited increased fibrosis (Figure 5A) and fibrogenic mRNA expression, including αSma, Col1a1, and Col4a1 (Figure 5A), with increased liver/body weight ratio (Supplemental Figure 3A) and increased serum alanine aminotransferase (Supplemental Figure 3A). In addition, there were visible tumors in livers of 12 of 13 aged male A1cf+/Tg mice (Figure 5B) but none in livers of 7 of 7 aged female A1cf+/Tg mice (data not shown). Because A1CF is a component of the C-to-U RNA editing machinery and since previous studies have demonstrated that APOBEC1 overexpression promotes promiscuous RNA editing and tumorigenesis (21, 22), we next asked whether there was a requirement for APOBEC1 in the tumorigenesis observed in A1cf+/Tg mice. We generated a compound line of A1cf+/Tg Apobec1–/– mice, which, at 12 months, exhibited increased liver/body weight ratio (Supplemental Figure 3A) and increased hepatic TG content, without changes in hepatic cholesterol or FA content (Supplemental Figure 3B), findings similar to those in 12-month-old A1cf+/Tg mice. As expected, these A1cf+/Tg Apobec1–/– mice expressed only APOB100 (Supplemental Figure 3A). These aged, male A1cf+/Tg Apobec1–/– mice also developed similar numbers of liver nodules when compared with A1cf+/Tg mice (Figure 5C) and again, similarly to A1cf+/Tg mice, exhibited increased hepatocyte proliferation (Supplemental Figure 3C). Histopathological analysis revealed that 5 of 10 aged A1cf+/Tg Apobec1–/– livers exhibited dysplastic nodules, with 1 of 5 exhibiting HCC (Table 1), suggesting that A1CF-induced tumorigenesis is likely independent of both APOBEC1 and RNA editing. In addition, because liver-specific A1cf-knockout mice exhibited aberrant alternative splicing of ketohexokinase-C RNA (23), a feature associated with HCC formation (24), we examined 1-year-old male A1cf–/– mice, but observed no spontaneous tumors (0 of 10 mice; Table 1 and Supplemental Figure 4A). We observed increased hepatic TG content in 12-month-old chow-fed A1cf–/– mice, without changes in cholesterol or FA content, and no change in transaminases but increased hepatic inflammatory marker mRNA expression for Ly6c and Ccr2 (Supplemental Figure 4, B and C). We will consider the significance of these findings in a later section, in the context of high-fat, high-fructose feeding.
Figure 5. Hepatic overexpression of A1CF promotes fibrosis and spontaneous tumorigenesis.
(A) Representative images of Sirius red–stained A1cf+/Tg and WT livers. Scale bars: 50 μm. Quantitation of Sirius red–stained area expressed as percentage total area (mean ± SEM). Significance was determined using unpaired Student’s t test, **P < 0.01 (n = 6). Bottom panel: qPCR evaluation of fibrogenic genes in livers of chow-fed 12-month-old A1cf+/Tg mice. Data are mean ± SEM (n = 6 per genotype). Unpaired t test was used to determine significance between 12-month-old groups, *P < 0.05. (B) Gross images of liver from A1cf+/Tg and A1cf+/Tg Apobec1–/– mice at 12 months of age fed a low-fat chow diet. (C) Representative images of H&E-stained liver sections from A1cf+/Tg and A1cf+/Tg Apobec1–/– mice. The dashed curved lines delineate tumor margin. Scale bars: 100 μm (left) and 50 μm (right). Macroscopic quantitation and size of nodules showing total number (top) and maximum size (bottom) of tumors.
Table 1. Pathological analysis of 12-month-old A1cf+/Tg livers.
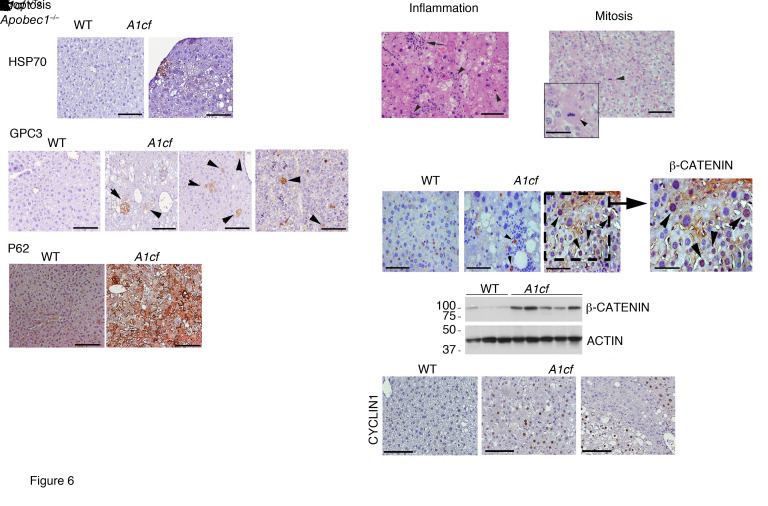
Immunohistochemical analysis revealed heat shock protein 70 (HSP70), glypican 3 (GPC3), and p62 staining of tumor cells in both A1cf+/Tg and A1cf+/Tg Apobec1–/– mice (Figure 6A), with scattered inflammatory infiltrates and apoptotic and mitotic figures (Figure 6B). Despite the presence of hepatic steatosis and scattered inflammatory cells, there was no evidence of increased hepatic inflammation, based on lack of change in mRNA abundance for inflammation-associated genes in either genotype at 12 months (Supplemental Figure 5A). We also observed increased expression of β-catenin (both overall and nuclear; Figure 6C) as well as its downstream target cyclin D1 in the livers of aged A1cf+/Tg mice (Figure 6C). These findings are relevant since activation of β-catenin is a key event in HCC (25).
Figure 6. Increased expression of HCC markers in 12-month-old A1cf+/Tg mice.
(A) Representative images of HSP70 and p62 expression in HCC from 12-month-old A1cf+/Tg mice. Representative images of hepatic GPC3 in 12-month-old A1cf+/Tg and A1cf+/Tg Apobec1–/– mice. Arrowheads indicate clusters of GPC3-positive cells. (B) Representative H&E images of pathological features identified in 12-month-old A1cf+/Tg liver. Left panel: Arrow indicates focal inflammation. Arrowheads indicate apoptotic cells. Right panel: Arrowhead indicates mitotic body. (C) Immunohistochemical staining of 12-month-old A1cf+/Tg livers with β-catenin antibody. Expression of β-catenin in liver tissue from A1cf+/Tg and littermate controls evaluated by Western blot and compared with actin. Representative images of cyclin D1 in liver from 12-month-old A1cf+/Tg mice. All panels, scale bars: 50 μm.
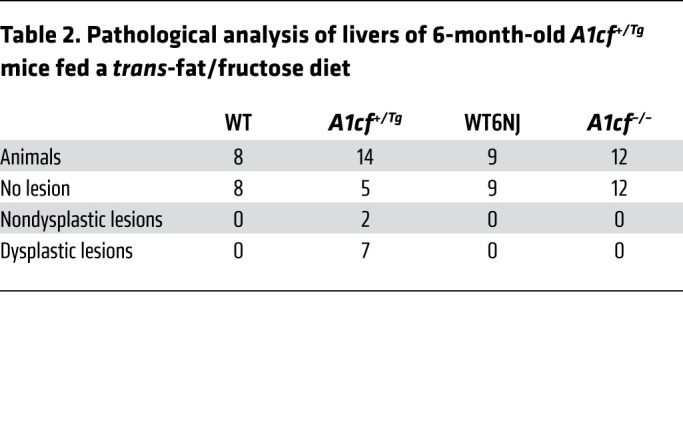
Because of the progressive nature of liver tumorigenesis, we examined 6-month-old chow-fed male A1cf+/Tg mice, which revealed small nodules in 4 of 7 mice. These nodules revealed areas of steatosis, inflammation, hepatocyte ballooning, and anisonucleosis but were not dysplastic (Supplemental Figure 5B). We also fed groups of male A1cf+/Tg and A1cf–/– mice a high-fat, high-fructose diet for 6 months in order to examine the impact of diet-induced steatosis on hepatic tumorigenesis. These findings revealed tumors in 9 of 14 A1cf+/Tg mice (Figure 7A and Table 2) and increased STAT3 activation with increased phospho-STAT3 expression (Figure 7B) along with increased expression of a known downstream target, Hif1α mRNA (ref. 26 and Figure 7C). We also observed immunohistochemical staining for GPC3 and HSP70 (Figure 7D) and increased expression of β-catenin (Figure 7E) in tumor nodules from A1cf+/Tg mice. By contrast and consistent with our observations in aged chow-fed mice, no tumors were observed in high fat–, high fructose–fed A1cf–/– mice (Figure 7A), and there was no change in hepatic expression of β-catenin in these mice (Figure 7F). A1cf–/– mice exhibited fibrotic injury comparable to that seen in WT6NJ controls, with increased hepatic mRNA expression of Col4a1 and Spp1, along with increased mRNA expression of several inflammatory genes (Supplemental Figure 6, A and B), a pattern similar to that described above in 12-month-old chow-fed A1cf–/– mice (Supplemental Figure 4C). These findings together imply that the hepatic steatosis and inflammatory signaling observed in both chow- and high fat–, high fructose–fed A1cf–/– mice are insufficient to drive tumor initiation.
Figure 7. Accelerated hepatic tumorigenesis in A1cf+/Tg mice fed a trans-fat/fructose diet.
(A) Top: Gross images of liver from A1cf+/Tg and A1cf–/– mice fed a trans-fat/fructose diet for 6 months. Bottom: H&E staining revealing fat accumulation in all genotypes but dysplastic nodules (dashed area) only in A1cf+/Tg liver. Scale bars: 100 μm. (B) Western blot analysis of STAT3 activation/phosphorylation at Tyr 705. p-STAT3 was normalized to total STAT3 (n = 7 A1cf+/Tg and 4 WT). Unpaired Student’s t test was used to determine significance between groups, *P < 0.05. (C) Expression of STAT3 downstream target, Hif1α RNA, by qPCR. Data are mean ± SEM (n = 7 A1cf+/Tg and 4 WT), **P < 0.01 determined by unpaired Student’s t test. (D) Representative images of GPC3- and HSP70-stained sections from A1cf+/Tg mice. Distinct nodules are delineated by dashed curved lines. GPC3 staining shows rare cells staining with cytoplasmic positivity within the nodule (arrowheads). Positive HSP70 staining in liver nodule, supporting neoplastic progression. Scale bars: 50 μm. (E and F) Expression of β-catenin in liver from 7 A1cf+/Tg and 4 WT mice (E) and 5 A1cf–/– mice and 5 aged-matched WT6NJ mice (F). Expression of β-catenin normalized to actin is shown as β-catenin/actin ratio. Significance was determined using unpaired Student’s t test, *P < 0.05.
Table 2. Pathological analysis of livers of 6-month-old A1cf+/Tg mice fed a trans-fat/fructose diet.
Transcriptome-wide analysis of A1cf+/Tg liver and isolated hepatocytes.
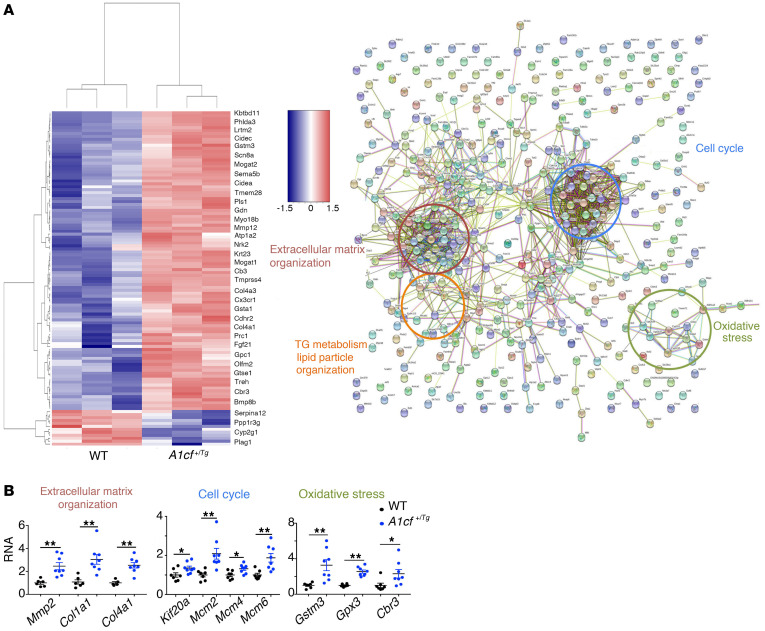
The findings to this point demonstrate that A1cf+/Tg mice exhibit alterations in mRNAs involved in hepatic lipogenic and VLDL assembly pathways, but raise questions regarding the mechanisms associated with the fibrogenic and tumorigenic phenotypes observed. As an approach to identify those pathways, we undertook RNA-Seq and STRING analysis (27) (https://string-db.org/) to examine functional enrichment and protein-protein interaction networks from whole liver transcriptomes in young (12-week-old) mice (Figure 8A). Those analyses revealed changes in several functional categories, including cell cycle, extracellular matrix organization, TG metabolism, and lipid particle organization as well as oxidative stress (Figure 8A). qPCR validated upregulation of several target mRNAs involved in these pathways (Figure 8B). The mRNA changes in regard to cell cycle and extracellular matrix organization extend findings illustrated above showing increased proliferation and fibrogenesis in A1cf+/Tg mice. We pursued the findings implicating altered oxidative stress in A1cf+/Tg mice and found that total glutathione levels were significantly elevated in A1cf+/Tg liver (Supplemental Figure 7A), with no change in reduced or oxidized glutathione and no change in mRNAs involved in glutathione synthesis (Supplemental Figure 7A). We also found no evidence for increased endoplasmic reticulum stress as evidenced by mRNA abundance of Chop, Ire1a, Xbp1, Grp78, and Atf4 (Supplemental Figure 7B).
Figure 8. Differentially expressed genes in livers from young A1cf+/Tg mice.
(A) Heatmap of the 556 differentially expressed genes. STRING analysis of the differentially expressed genes showing enriched pathways. (B) qPCR validation of gene clusters involved in extracellular matrix organization (red), cell cycle (blue), and oxidative stress (green). Data are mean ± SEM (n = 6–8), *P < 0.05, **P < 0.01 (unpaired t test).
To further examine the range of potential A1CF mRNA targets, we undertook sequencing of RNA isolated by crosslinking immunoprecipitation (RNA CLIP-seq) of RBP-RNA complexes (28) on isolated hepatocytes from A1cf+/Tg mice (Supplemental Figure 7C) and identified 245 RNAs that copurified with FLAG-tagged A1CF (here designated direct A1CF targets). Overlapping these direct A1CF RNA targets with mRNAs that were significantly differentially expressed in our RNA-Seq studies, we identified 4 A1CF RNA targets (Sox4, Sparcl1, Smad9, and Dlgap1) (Figure 9). qPCR revealed 1.5-fold and 2-fold upregulation of Sox4 and Sparcl1 mRNAs, respectively, with 2-fold and 10-fold downregulation of Smad9 and Dlgap1 mRNAs, respectively (Figure 9). These mRNAs revealed a trend toward the inverse patterns in A1cf–/– liver (Supplemental Figure 7D). SOX4 overexpression in liver was shown to stabilize β-catenin and increase cell proliferation, promoting steatosis and HCC progression (29–32), while SPARCL1 overexpression was correlated with tumor angiogenesis in HCC (33, 34). Since SMAD9 inhibits bone morphogenetic protein (BMP) signaling (34), we asked whether the decreased expression of Smad9 in A1cf+/Tg liver was accompanied by changes in Bmp7 mRNA. qPCR revealed a 2-fold increase in A1cf+/Tg liver (Supplemental Figure 7E), findings consistent with the fibrogenic phenotype observed in A1cf+/Tg mice. These findings, taken together, support the notion that mRNAs identified through RNA CLIP are likely direct A1CF targets with a plausible role in the phenotypes observed. Among the differentially expressed RNAs, we also observed increased abundance of several organogenic mRNAs (Sox9, Gpc1, Tmprss4) in A1cf+/Tg mice (Supplemental Figure 7F). Among the features of interest in these mRNAs, the presence of an AU-rich 3′-UTR in Sox9 mRNA led us to ask whether Sox9 mRNA could represent a target for A1CF, since earlier work showed that A1CF is an AU-rich RNA-binding protein (11). Here we show that Sox9 RNA was immunoprecipitable from liver extracts and demonstrated a shift into actively translating polysomal RNA fractions (Supplemental Figure 7F).
Figure 9. Schematic representation of differentially expressed genes in young A1cf+/Tg mice in relation to A1CF RNA CLIP targets.
Two A1CF RNA targets (Sox4 and Sparcl1) are upregulated (red) and 2 (Smad9 and Dlgap1) are downregulated (blue) in A1cf+/Tg liver. Expression of these 4 targets was validated by qPCR (n = 7–8) and is shown as mean ± SEM, *P < 0.05, **P < 0.01 (unpaired t test).
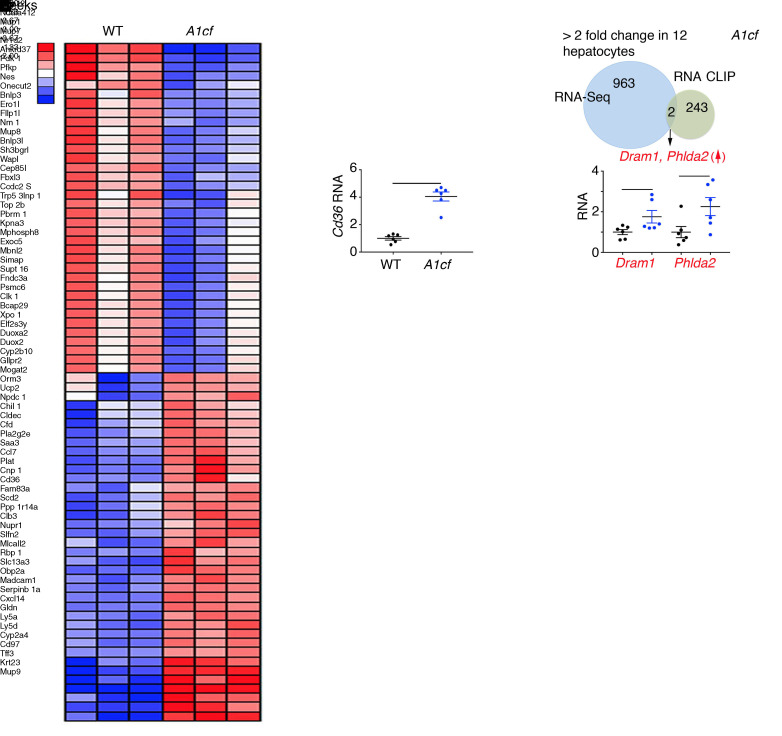
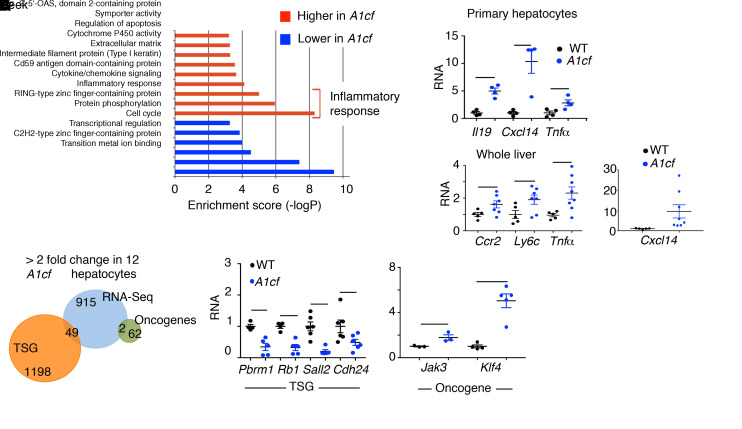
We also undertook transcriptome profiling in isolated hepatocytes, revealing 391 upregulated and 574 downregulated RNAs (Figure 10A). Cd36 mRNA was approximately 4-fold upregulated (compare Figure 10A with Figure 3B for whole liver), again supporting the conclusion that hepatocyte Cd36 expression is regulated in response to A1CF overexpression. We aligned A1CF RNA targets identified by RNA CLIP with differentially expressed RNAs in A1cf+/Tg hepatocytes and validated differential expression of 2 mRNAs, Dram1 and Phlda2, which showed 2- to 2.5-fold higher levels in A1cf+/Tg hepatocytes (Figure 10B). Gene Ontology analysis revealed enrichment of pathways related to inflammatory response, supporting the phenotype observed in A1cf+/Tg liver (Figure 11A) and consistent with a predicted increase in production of proinflammatory cytokines and chemokines (35), including IL19, Cxcl14, and TNFα mRNAs, which were 5- to 12-fold upregulated in A1cf+/Tg hepatocytes (Figure 11A). We also analyzed markers of inflammation in whole liver from A1cf+/Tg mice and observed a significant increase in mRNAs encoding proinflammatory chemokines including CCR2 and CXCL14 that likely contribute to inflammation, as shown by elevated expression of Ly6c and Tnfα mRNAs (Figure 11A). In addition, we examined expression of mRNAs encoding tumor suppressor genes (TSGs) and oncogenes (Figure 11B), revealing 49 TSG mRNAs and 2 oncogene mRNAs among the differentially expressed genes from the RNA-Seq analysis. Of the 49 TSG mRNAs, 26 clustered in functional categories including transcriptional regulation, cell cycle, and protein phosphorylation, supporting the phenotype observed in A1cf+/Tg. Among the 26 TSG mRNAs, 7 showed more than 3-fold alteration by RNA-Seq, of which 4 TSG mRNAs (Pbrm1, Rb1, Sall2, and Cdh24), validated by qPCR, were significantly downregulated (Figure 11B), while 2 oncogenes (Jak3, Klf4) exhibited increased mRNA abundance in A1cf+/Tg liver (Figure 11B).
Figure 10. Differentially expressed genes in primary hepatocytes from young A1cf+/Tg mice in relation to A1CF RNA CLIP targets.
(A) Heatmap of 966 differentially altered genes in primary hepatocytes from A1cf+/Tg mice. Upregulation of Cd36 RNA in A1cf+/Tg hepatocytes represented as mean ± SEM (n = 6), **P < 0.01 (unpaired t test). (B) Venn diagram showing two A1CF RNA CLIP targets (Dram1 and Phlda2) upregulated in A1cf+/Tg hepatocytes with mRNA expression, validated by qPCR, shown as mean ± SEM (n = 6), *P < 0.05 (unpaired t test).
Figure 11. A1cf+/Tg primary hepatocytes show enrichment in inflammatory response pathways.
(A) Gene Ontology analysis showing functional pathways overrepresented (red) and underrepresented (blue) in A1cf+/Tg hepatocytes. Relative expression of genes involved in inflammatory response examined by qPCR, in both isolated hepatocytes and whole liver (5–8 per genotype). Data are mean ± SEM, *P < 0.05, **P < 0.01 (unpaired t test). (B) Venn diagram representing comparative analysis between genes with differentially altered expression in A1cf+/Tg hepatocytes and Tumor Suppressor Gene (TSG) and Oncogene databases. qPCR validation of a subset of TSG and Oncogene RNAs from 4–5 independent hepatocyte isolations per genotype. Data are mean ± SEM, *P < 0.05, **P < 0.01 (unpaired t test).
Whole liver transcriptome analysis in aged A1cf+/Tg liver.
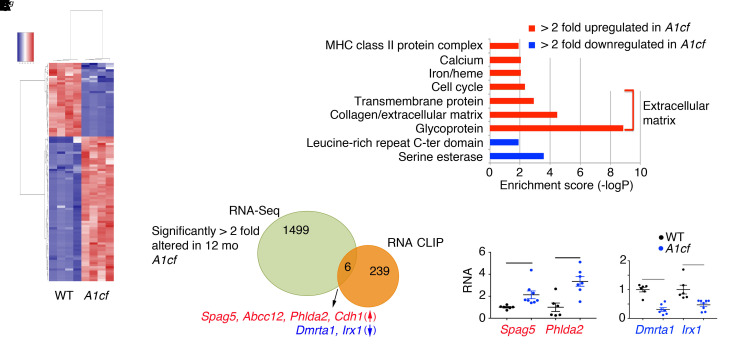
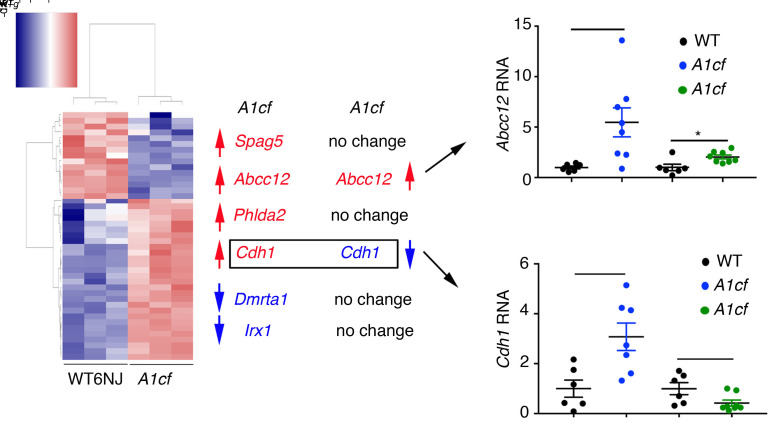
The data presented above suggest that A1CF overexpression promotes steatosis and hepatocyte proliferation as well as activating inflammatory and fibrogenic pathways in both whole liver and isolated hepatocytes from young mice. In order to understand the tumorigenic pathways in older mice, we next profiled mRNAs in aged (12-month-old) A1cf+/Tg liver, which revealed 1505 differentially expressed RNAs (Figure 12A). Gene Ontology and Kyoto Encyclopedia of Genes and Genomes (KEGG) analysis revealed enrichment in genes related to extracellular matrix organization (Figure 12B). We aligned differentially expressed RNAs with RNA CLIP A1CF targets and identified 6 A1CF RNA targets: 4 with increased abundance (Spag5, Phlda2, Abcc12, and Cdh1) and 2 with decreased abundance (Dmrta1 and Irx1) in A1cf+/Tg livers (Figure 12C and Figure 13). We attempted to assign a definitive role for A1CF in the regulation of these RNAs by examining hepatic mRNA expression in aged A1cf–/– mice, reasoning that mRNAs that were increased in A1cf+/Tg livers would be correspondingly reduced in the livers of A1cf–/– mice. Of the 6 RNAs identified above, only E-cadherin 1 (Cdh1) met the criteria for a gain-of-function/loss-of-function effect (i.e., upregulated in A1cf+/Tg and downregulated in age-matched A1cf–/– liver) (Figure 13). Abcc12 mRNA was 5-fold upregulated in A1cf+/Tg liver, recapitulating findings showing increased expression in breast cancer (36), and loss of A1CF attenuated this increase in mRNA expression (Figure 13). The remaining 4 RNAs (Spag5, Phlda2, Dmrta1, Irx1) were unchanged in WT and A1cf–/– liver (Figure 13 and Supplemental Figure 8). We examined features of the 12 mRNAs identified through RNA CLIP-Seq as possible A1CF targets, focusing on the 3′-UTR (Supplemental Table 1). The majority of these mRNAs (11 of 12) were enriched in AU sequences, containing at least 1 AUUUA motif or stretches (5 or 6 repeats) of poly(U) elements (Supplemental Table 1). These sequence and context preferences are consistent with findings from earlier studies (37). Only 1 mRNA (Abcc12) contained none of these features and contained less than 50% AU content (Supplemental Table 1).
Figure 12. Summary of differentially expressed genes in liver of 12-month-old chow-fed A1cf+/Tg mice.
(A) Heatmap showing expression of 1505 differentially expressed genes in A1cf+/Tg liver. (B) Gene Ontology analysis depicting functional categories overrepresented (red) and underrepresented (blue) in A1cf+/Tg livers. (C) Venn diagram summarizing comparative analysis between 1505 differentially altered genes in A1cf+/Tg liver and A1CF RNA targets identified by RNA CLIP. Six A1CF RNA targets showed altered expression, with 4 (Spag5, Abcc12, Phlda2, and Cdh1) upregulated (red) and 2 (Dmrta1 and Irx1) downregulated (blue). Expression was confirmed by qPCR (6–8 animals per genotype). Data indicate mean ± SEM, *P < 0.01, **P < 0.05 (unpaired t test).
Figure 13. Expression profile of differentially expressed A1CF RNA CLIP targets in 12-month-old A1cf–/– mice.
Heatmap representation of 298 genes with altered expression in liver of 12-month-old chow-fed A1cf–/– mice. Expression of A1CF RNA targets, differentially expressed in 12-month-old A1cf+/Tg, in liver of 12-month-old A1cf–/– mice. Genes upregulated in aged A1cf+/Tg mice are indicated in red; genes downregulated are indicated in blue. RNA-Seq analysis showed that of the 6 genes identified from RNA-Seq and RNA CLIP in A1cf+/Tg mice, only Cdh1 was both upregulated in A1cf+/Tg mice and downregulated in A1cf–/– mice. Cdh1 RNA expression in A1cf+/Tg and A1cf–/– liver was confirmed by qPCR (n = 6–7 per genotype). Data represent mean ± SEM, *P < 0.05 (unpaired t test).
A role for A1CF in human HCC.
Genome-wide association studies implicate A1CF in regulating hepatic lipid metabolism and plasma TG levels (15). Because genetic pathways in hepatic lipid metabolism modulate HCC risk in patients with NAFLD (38), we took advantage of The Cancer Genome Atlas (TCGA) and observed that 6 A1CF RNA targets (Spag5, Abcc12, Phlda2, Cdh1, Dmrta1, and Irx1; Supplemental Figure 9A) that were differentially expressed in 12-month-old A1cf+/Tg mouse liver were also associated with aberrant expression of A1CF in human HCC. Of the 6 RNAs, Spag5 and Cdh1 mRNAs showed a significant positive co-occurrence with A1CF (Supplemental Figure 9A). Alterations in A1CF were observed in 9% of 360 patients with HCC, including increased gene copy number and increased mRNA expression in a subset as well as reduced A1CF expression in another subset, the latter reflecting either decreased mRNA or mutational alteration (Supplemental Figure 9A). These findings hint at the possibility that A1CF expression might be altered in patients with HCC.
To resolve that possibility, we examined immunohistochemical expression of A1CF in normal control subjects, cirrhotic patients, and patients with HCC. We observed homogeneous nuclear A1CF staining in control subjects (Figure 14A, top), with heterogeneous staining in cirrhotic nodules as well as in HCC with increased nuclear expression at the edge of the invasive front of the tumor (Figure 14A, bottom, arrowheads). We also performed immunohistochemical analysis of A1CF expression in a tissue microarray of human HCC samples generated at Mayo Clinic, Rochester, Minnesota (clinical data included in Supplemental Table 2). We categorized A1CF staining into 4 groups based on average sample pixel intensity per high-power field, in both tumor and uninvolved tissue (Figure 14B and Table 3). A high level of A1CF staining correlated with advanced (F3/4) fibrosis in both uninvolved and tumor tissue from the entire cohort (Figure 14C) and was also correlated with higher levels of α-fetoprotein levels (Figure 14D). We used multivariable Cox proportional hazard modeling to show that A1CF staining intensity in the uninvolved tissue was predictive of overall survival, with worst survival associated with highest levels of A1CF expression. This implied prognostic role of increased A1CF staining intensity was independent of TNM stage, tumor number, and other putative prognostic factors included in the final model (Supplemental Table 3). Among a subgroup of 19 HCC patients in whom NAFLD was a potential underlying etiology (Methods and Supplemental Table 4), the adverse prognostic role of increased A1CF staining intensity was further substantiated with a progressive decrease in overall survival apparent in patients with increasing levels of A1CF expression (Figure 14E). Furthermore, using proportional hazard modeling, we found that A1CF expression remained predictive of survival after adjustment for recurrence and time to first recurrence in the subgroup with NAFLD (Supplemental Table 5). We also confirmed a significant, independent association of mRNA expression of A1CF with SPAG5 and with CDH1 in a second cohort of patient samples (Supplemental Table 6) of normal and cirrhotic liver (Supplemental Figure 9B), suggesting that the associations demonstrated in mice overexpressing A1cf may also be relevant to conditions (e.g., cirrhosis) that predispose to HCC in humans.
Figure 14. A1CF expression inferred from immunohistochemical staining in human HCC tissue microarray.
(A) Top: A1CF staining of normal human liver showing homogeneous strong nuclear expression. Scale bars: 50 μm. Bottom: A1CF in cirrhotic and HCC tissue. Staining shows a gradient of expression with strong nuclear A1CF staining at the edge of cirrhotic nodules and tumor (arrowheads). Scale bars: 50 μm (first 3 panels) and 20 μm (last panel). (B) A1CF expression in 137 human samples from a tissue microarray. Samples were categorized according to A1CF staining evaluated by quantitation of pixels (see Methods). A representative image of each category is shown. Scale bars: 50 μm. (C) A1CF expression and comparison among fibrosis categories in uninvolved and tumor tissues from all patients. Data represent mean ± SEM (unpaired t test). (D) A1CF expression in uninvolved tissue and comparison among patients with low and high levels of AFP, represented as mean ± SEM (unpaired t test). (E) Kaplan-Meier plots of the overall survival rates in HCC subjects with underlying NAFLD, stratified by A1CF staining intensity. Patients were divided into 4 quartiles based on A1CF total expression in uninvolved tissue. Patients with highest A1CF staining (quartile 4) show significantly reduced survival compared with patients with lower A1CF staining intensity (quartiles 1–3). Inset shows Cox proportional hazard values.
Table 3. Distribution of patients by A1CF expression category in uninvolved and tumor tissue.

Discussion
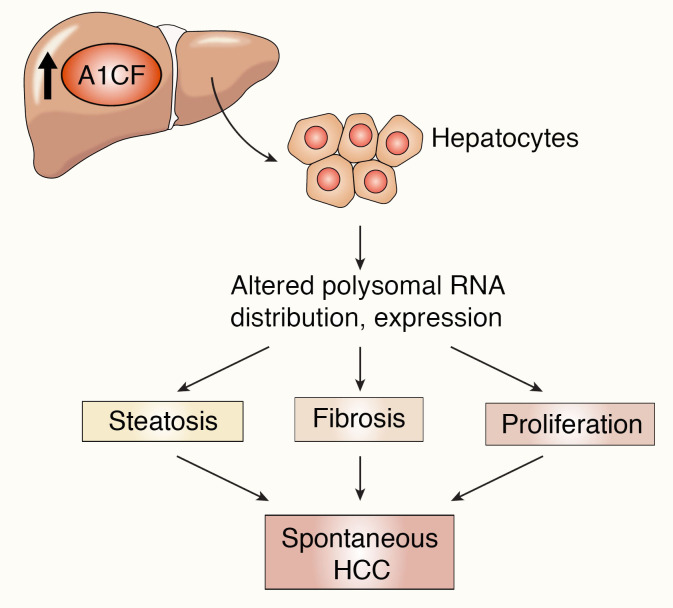
Here we show that transgenic overexpression of the RNA-binding protein A1CF in mouse liver produces a gain-of-function phenotype that includes steatosis, increased proliferation, inflammation, fibrosis, and spontaneous tumorigenesis. As an overarching model (Figure 15), we show that A1CF overexpression alters hepatic APOB secretion and shifts VLDL production into smaller particles, which, along with upregulation of mRNAs including lipogenic genes and Cd36, promotes the development of hepatic steatosis. In addition, upregulation of mRNAs involved in oxidative stress, inflammation, and extracellular matrix organization in A1cf+/Tg mice promotes the development of hepatic fibrosis. The convergence of these steatotic and fibrogenic pathways, together with upregulation of proliferative and organogenic mRNAs and decreased expression of tumor suppressor mRNAs, promotes spontaneous tumorigenesis and HCC (Figure 15). Several elements of our findings and this proposed model merit further discussion.
Figure 15. Schematic summary of findings with an integrated mechanism for A1CF-induced hepatic carcinogenesis.
Hepatic overexpression of A1CF induces steatosis via pathways including increased expression of lipogenic genes, increased fatty acid/lipid uptake (Cidea, Mogat1, Mogat2, Cd36), and reduced VLDL APOB secretion. Increased A1CF expression is also associated with increased oxidative stress (Gstm3, Gpx3, Cbr3), augmented inflammatory response (Il19, Cxcl14, Tnfα, Ccr2, Ly6c), and exaggerated extracellular matrix organization (Mmp2, Col1a1, Col4a1, Sparcl1), which together promote accumulation of collagen and fibrosis. In parallel, hepatic overexpression of A1CF increases expression of proliferative genes (Mcm2, Mcm4, Mcm6, Kif20a), organogenic genes (Bmp7, Sox4, Sox9, Tmprss4), and oncogenic genes (Jak3, Klf4, Tmprss4) and decreases expression of tumor suppressor genes (Pbrm1, Rb1, Sall2, Cdh24). These adaptive responses, including steatosis, fibrosis, and augmented proliferation, combine to promote spontaneous hepatic carcinogenesis in A1cf+/Tg mice.
A1CF is a widely expressed RNA-binding protein identified in connection with ApoB RNA binding and assembly of a functional C-to-U RNA editing complex with APOBEC1 (9, 10). However, A1cf deletion produced no effect on ApoB RNA editing (12) and variably impacted C-to-U RNA editing of other mRNAs (13). More recently, genome-wide association studies implicated variants in A1CF with specific metabolic traits, including regulation of plasma TG levels (15, 39). Accordingly, among the primary objectives of this study was to examine the impact of gain and loss of function of A1CF alleles on hepatic RNAs and in particular the impact on VLDL assembly and secretion. Findings demonstrating that CRISPR-mediated A1CF deletion in human hepatoma cells greatly decreased APOB secretion (15) led us to predict that VLDL production and fasting plasma TG levels would be correspondingly reduced in A1cf+/Tg mice and elevated in A1cf–/– mice. However, these predictions were only partially confirmed. We found a modest decrease in APOB secretion and a shift to smaller VLDL particles in A1cf+/Tg mice. However, there were no alterations in hepatic TG or VLDL secretion or in APOB production in A1cf–/– mice and only a subtle (~30%) decrease in APOB secretion from 2 independent A1CF-null HepG2 cells. Our transcriptomic surveys further revealed a panel of hepatic mRNAs whose expression was upregulated in A1cf+/Tg mice, including Cidea, Mogat1, Mogat2, and Cd36, via mechanisms that include shifts into actively translating polysome fractions and increased protein expression. A function for A1CF in transporting mRNAs toward actively translating polysomes is consistent with its known nuclear/cytoplasmic shuttling activity in cell culture models (14, 40) and with its dynamic pattern of altered distribution under metabolic stress (23).
We further observed that aged A1cf+/Tg mice developed advanced fibrosis and that male mice developed spontaneous liver tumors at high penetrance, even while consuming a chow diet. The tumorigenic phenotype was accelerated when male mice were fed a high-fat, high-fructose diet, and these mice exhibited hepatic STAT3 activation along with downstream effects including upregulation of Hif1α mRNA, consistent with prior studies linking experimental obesity-associated nonalcoholic steatohepatitis to advanced features including development of HCC (41). These tumors exhibited features associated with human HCC, including immunohistochemical staining for GPC3 and HSP70, enhanced β-catenin expression, and increased expression of cyclin D1. Certain features of the temporal progression from steatosis to fibrosis raise the question of whether the development of HCC in A1cf+/Tg mice occurs as a consequence of — or independently from — fibrogenic and inflammatory signaling. The demonstration that A1cf+/Tg mice fed high-fat, high-fructose diets exhibit enhanced steatosis and inflammatory signaling (augmented STAT3 activation; Figure 7, A and B) along with dysplastic nodules suggests that the progressive development of HCC is likely driven by steatotic injury and fibrogenic signaling. On the other hand, our findings that WT and A1cf–/– mice also develop steatosis, fibrosis, and inflammation when fed high-fat, high-fructose diets, yet mice of neither genotype develop tumors at 6 months (in contrast to A1cf+/Tg mice), suggest that the presence of steatosis and fibrosis alone is insufficient to promote HCC.
As a step toward identifying relevant signaling pathways, we undertook RNA-Seq from livers of A1cf+/Tg mice at various ages and aligned some of the differentially expressed mRNAs with RNA CLIP-Seq from isolated hepatocytes. We identified 12 mRNAs through RNA CLIP-Seq and discovered several shared sequence motifs within the 3′-UTR of these mRNAs, including the overall AU content, the presence and multiplicity of AUUUA motifs, and the presence and multiplicity of poly(U) stretches. The preferences for AU and poly(U) motifs are consistent with recent work (37), and these preferences are shared by other RNA-binding proteins, including RBM47 and members of the hnRNP family (hnRNPH1/2), both of which have been shown to interact with A1CF in posttranscriptional regulation (13, 23). Among the RNA CLIP targets, Cdh1 and Spag5 both have plausible roles in the pathogenesis of HCC. Germline or somatic (loss-of-function) mutations in CDH1 are well recognized in a range of cancers, including HCC (42, 43), but CDH1 mRNA has also been shown to be upregulated in 40% of patients with HCC (44), with findings demonstrating selective nuclear retention of CDH1 mRNA in some patients (45). These latter findings raise the question of whether nucleocytoplasmic shuttling activity of A1CF (40) plays a role in compartmentalizing specific cargo RNAs in tumorigenesis. Another A1CF target, SPAG5, was upregulated (mRNA and protein) in HCC and associated with poor survival (46). Furthermore, expression of both CDH1 and SPAG5 RNA was highly correlated with A1CF RNA in patients with cirrhosis (Supplemental Figure 9B). Yet another A1CF target, Sox9 mRNA, which was immunoprecipitated from hepatocytes from A1cf+/Tg mice, was identified as a hepatic stem cell marker in HCC with SOX9 overexpression in patients correlating with reduced overall survival (47).
As for other RNA targets, A1CF likely interacts with RBM47 in the context of C-to-U RNA editing of ApoB mRNA and modifies editing activity of the RNA deaminase APOBEC1 on a variety of substrates in mouse liver and intestine (13). A1CF competes with hnRNPH1/2 by binding at the 5′ splice site of exon 3C in ketohexokinase mRNA and regulates alternative splicing (23). However, we failed to observe spontaneous liver tumors in aged, male A1cf–/– mice, in which this alternative splicing event would be predicted to increase expression of ketohexokinase mRNA with the A isoform, a shift in isoform distribution that was shown in other work to promote growth of hepatoma cells in nude mice (24). An additional caveat is warranted in the interpretation of the temporal shifts in hepatic mRNA expression noted in A1cf+/Tg mice since those changes likely reflect both altered cellular expression and cellular composition. Resolution of these possibilities will require study of the cellular composition and transcriptomic profiles at critical developmental stages.
While we confirmed the same pattern of nuclear A1CF staining in human hepatocytes and mouse liver (48), we also observed heterogeneity in A1CF expression in cirrhosis and HCC with variability in regenerating nodules and tumors. We found that increased levels of staining were associated with more advanced stages of fibrosis as well as other parameters of advanced liver disease (Child-Pugh score and MELD score) (Supplemental Table 2). In HCC patients in whom NAFLD was an underlying etiology, high levels of A1CF staining were predictive of reduced overall survival. These observations must be interpreted with caution, however. First, this cohort of HCC contained only 19 subjects (14%) with NAFLD, and our study was not powered to draw conclusions regarding specific HCC etiology. However, the overall prevalence of NAFLD underlying HCC is very similar to that in previous retrospective cohorts reported from the Mayo Clinic (49). Second, while fibrosis stage is an important predictor of all-cause mortality in NAFLD patients (50), it is unclear whether A1CF expression is associated with compensated cirrhosis and/or bridging fibrosis. This reservation is relevant also to our observations that A1CF staining is within hepatocytes, suggesting the possibility that steatotic hepatocytes release factors that promote fibrogenic and/or inflammatory signaling (51). Third, our conclusions regarding A1CF expression in those samples reflect immunohistochemical staining intensity, which is at best semiquantitative. Future studies will be required to obtain a more granular understanding of A1CF protein distribution and expression in relation to the candidate mRNAs implicated and to examine the role of RNA trafficking, polysome distribution, and translation of those candidate target genes.
Methods
Animals.
A1cf–/– and Apobec1–/– mice were on a background of C57BL/6NJ or C57BL/6J, respectively (13, 52). For high-fat diet studies, mice were fed a high–trans-fat, high-fructose diet (TD.06303, Envigo) for 6 months. Unless noted otherwise, mice were fasted for 4 hours and injected with 100 mg/kg of BrdU (Sigma-Aldrich) 2 hours before study. Littermate controls were used in all experiments.
Generation of A1cf-transgenic mice.
The FLAG-A1cf transgene was generated by amplification of A1CF from human cDNA using a 5′ primer containing FLAG sequence and a KpnI site and a 3′ primer containing an XhoI site and cloned into the pLiv7 vector (53). Of 5 founders, 2 were selected with comparable levels (about 2- to 3-fold) of transgene expression for the baseline characterization and original description of spontaneous tumorigenesis.
Liver and serum biochemical assessments.
Serum levels of alanine aminotransferase and aspartate aminotransferase were measured with kits (ALT [SGPT], A526-120, and AST [SGOT], A559-150, respectively, Teco Diagnostics). Serum and hepatic triglycerides (TGs), cholesterol, and nonesterified fatty acid levels were measured using kits (L-Type Triglyceride M, 998-02891/998-02892; Cholesterol E, 996-02611; and HR Series NEFA-HR(2) 991-34793/999-35193, respectively, all from FUJIFILM Wako Diagnostics). Serum was fractionated on tandem Superose 6 columns (Pharmacia FPLC). Liver glutathione was evaluated following manufacturer’s protocol (Cayman Chemical).
VLDL secretion.
Following a 4- or 16-hour fast, mice were weighed and injected with Pluronic F-127 (1 mg/g; Invitrogen) and serum TG determined from blood collected 1, 2, and 4 hours after injection.
Electron microscopy.
Pooled serum from 2–4 mice was collected after Pluronic F-127 injection and VLDL particles separated by ultracentrifugation for negative staining electron microscopy.
Histology and immunohistochemistry.
For mouse studies, BrdU-positive hepatocytes were quantitated in each section. Eight to ten fields per section, each section containing 4–6 pieces of liver from multiple lobes, were analyzed. Fibrosis was assessed by Sirius red staining. Using Nuance multispectral imaging software, a spectral library was created to analyze a complete experimental group. Liver sections (4 μm) were stained with anti-A1CF, anti-FLAG, anti-CIDEA, anti–β-catenin, anti-HSP70, anti-GPC3, anti-p62, and anti–cyclin D1. Dilutions and origins of each antibody are given in Supplemental Table 7. Histological survey was performed by a pathologist blinded to the experimental groups. Liver nodules were counted and classified into dysplastic nodules and HCC. The background liver was evaluated for the presence of steatosis, inflammation, ballooning, and anisonucleosis. For human samples, tissue microarray slides were scanned using a Nuance FX multispectral imaging system (CRi, Cambridge Research & Instrumentation) and Nuance 2.10 software. Images were acquired at 20 nm wavelength intervals and combined into 1 image. A spectral library was created and served as reference with individual fluorescent signals corresponding to total A1CF, nuclear A1CF, counterstain (hematoxylin), and autofluorescence. Autofluorescence was subtracted from the spectral reference. Two ×20 magnification fields per sample were randomly analyzed. The emission spectra for total and nuclear A1CF were acquired and saved as an image cube that contained both individual signal components, which were then unmixed and analyzed separately. The intensity of staining was defined by pixels evaluated in the analyzed area, including the entire field for total A1CF staining and all nuclei for nuclear staining. Total pixel values for total and nuclear A1CF represent the mean of 2 measurements per sample. Stained area was expressed as a percentage of total area. Unstained samples were evaluated using the same parameters used to create the spectral reference (fluorescent signals for both total and nuclear A1CF, counterstain, and autofluorescence). These samples showed only counterstaining background. Samples were considered positively stained when the total pixel value was above counterstain background.
Studies in primary hepatocytes.
Livers were perfused and digested with 0.05% collagenase (Type IV, C5138, Sigma-Aldrich), and hepatocytes were plated on collagen-coated dishes overnight. APOB synthesis and secretion were studied as previously described (54), with 35S-methionine pulsed for 30 minutes and chased for 0, 2, and 4 hours. Aliquots of cell lysate and medium were immunoprecipitated with APOB IgG and separated by 4%–15% gradient SDS-PAGE. The data were normalized to total TCA-precipitable radioactivity. CRISPR-targeted HepG2 cells were generated as previously described (17).
RNA extraction and RNA-Seq.
For each genotype and condition, 3 pools were prepared, each containing RNAs from 3–4 separate mice, for a total of 10 mg RNA per final pool. Pools were subjected to oligo-dT selection, cDNA library preparation, and whole transcriptome sequencing by Illumina HiSeq2000 as previously described (55).
Gene expression analysis by qPCR.
Total RNA was treated with DNase and subjected to cDNA synthesis using a High Capacity cDNA Reverse Transcription kit (Applied Biosystems). qPCR was performed in triplicate. RNA levels were expressed as fold changes after normalization to Gapdh RNA. Sequences of primers used for qPCR are listed in Supplemental Table 8.
Polysome isolation.
Livers were washed in ice-cold PBS supplemented with 0.1 mg/mL cycloheximide (Sigma-Aldrich) and minced in lysis buffer (25 mM Tris-HCl [pH 7.5], 250 mM NaCl, 5 mM MgCl2, 0.5 mM PMSF, 0.2 mg/mL heparin [Sigma-Aldrich], 5 mM DTT, 20 U/mL RNasin [Promega], 0.1 mg/mL cycloheximide, 1% Triton X-100, 1× protease inhibitor). Homogenized minced livers were resolved through a 10%–50% sucrose gradient at 200,000g for 2.5 hours at 4°C using a SWT41i rotor (Beckman Brea). Fractions (0.9 mL) were collected and 260 nm absorbance monitored by spectrophotometry. RNA from each fraction was used for qPCR.
Protein extraction and Western blot analysis.
Fifty micrograms protein was resolved by SDS-PAGE and transferred to PVDF membrane. In all analyses, equal loading was verified using anti-actin or anti-GAPDH antibody. Antibodies and conditions used for Western blot are listed in Supplemental Table 7.
A1CF-RNA coimmunoprecipitation.
A1CF-RNA coimmunoprecipitation was performed as previously described (11). Freshly harvested, minced livers were exposed to 300 mJ/cm2 UV irradiation in a Stratalinker 1800 (Stratagene), collected in 1× PBS, and resuspended into PLB buffer (10 mM HEPES [pH 8], 100 mM KCl, 5 mM MgCl2, 10 mM ribonucleoside vanadyl complexes [Sigma-Aldrich], 0.5% Nonidet P-40, 1 mM DTT, 0.2 mM PMSF, and protease inhibitors). Cleared lysates were incubated with 0.1 mL of pre-swollen magnetic Dynabeads protein A beads (Invitrogen). Aliquots were extracted with TRIzol as input RNA. The remainder was incubated overnight, with either protein A coupled to anti-A1CF (25 μg), or rabbit IgG in NT2 buffer (50 mM Tris [pH 7.4], 150 mM NaCl, 1 mM MgCl2, 0.05% Nonidet P-40) supplemented with 200 U of RNase inhibitor (Invitrogen), 2% ribonucleoside vanadyl complexes, 1 mM DTT, and 150 mM EDTA. The beads were washed twice in buffer A (1× PBS [no Mg2+, no Ca2+], 0.1% SDS, 0.5% deoxycholate, 0.5% Nonidet P-40), twice in buffer B (5× PBS [no Mg2+, no Ca2+], 0.1% SDS, 0.5% deoxycholate, 0.5% Nonidet P-40), and twice in buffer C (50 mM Tris [pH 7.4],10 mM MgCl2, 0.5% Nonidet P-40). Beads were incubated 30 minutes at 55°C with 30 μg of proteinase K (Sigma-Aldrich) and 0.1% SDS in 1× NT2 buffer supplemented with 80 U of RNase OUT (Promega). The phenol/chloroform-extracted RNA was used for cDNA synthesis followed by PCR using Sox9-specific primers: Fwd825 5′-GAAGAGACCCTTCGTGGAGGAGGCGG-3′; Rev1040 5′-TGCACCTCACTCATGCCGGAGGAGG-3′. PCR products from A1CF-specific immunoprecipitation were gel-purified and sequenced.
RNA CLIP-Seq was performed as previously described (28). Primary hepatocytes (108) from 12-week-old A1cf+/Tg mice seeded on 10 mm collagen-coated plates were exposed to 400 mJ/cm2 of 254 nm UV light in a Stratalinker 2400 (Stratagene). Hepatocytes were scraped in 1 mL lysis buffer containing 50 mM HEPES (pH 7.5), 150 mM KCl, 2 mM EDTA, 1 mM NaF, 0.5% (vol/vol) NP40, 1 mM DTT, 1× protease inhibitors, 2 mM Na3VO4, 5 mM sodium pyrophosphate, and RNasin (Promega), incubated on ice, and frozen at –80°C. Cells were homogenized, and cleared lysates were treated with RQ1 DNase (Promega) for 5 minutes at 37°C followed by 15 minutes of incubation at room temperature with RNase T1 (Fermentas). A1CF-RNA complexes were immunoprecipitated and treated on-beads with RNase T1, ligated with RNA adapters (RL5a-TYE705 and RL3-biotin), resolved on SDS-PAGE, and transferred to nitrocellulose. The RNP complexes were excised and treated with Proteinase K (Thermo Scientific). Phenol/chloroform-purified RNA was subjected to cDNA synthesis using DP3 primer, followed by PCR using DP5a and DP3 primers. PCR conditions were as follows: 94°C for 2 minutes; 40 cycles at 94°C for 30 seconds, 58°C for 30 seconds, 68°C for 30 seconds; 68°C for 10 minutes. PCR products were gel-purified and subjected to a second round of amplification using DSFP5a and indexed DSFP3 primer (RPIX-D3) (1 per template) with the following conditions: 94°C for 2 minutes; 35 cycles at 94°C for 30 seconds, 62°C for 45 seconds, 68°C for 45 seconds; and 68°C for 10 minutes. Final PCR products were gel-purified and submitted for high-throughput sequencing using primer SSP1. Primer sequences were as follows: RL5a-TYE705: 5′-AGGGAGGACGAUGCGG-3′; RL3-biotin: 5′-GGCGACCUUCACUGACUGUG-3′; DP5a: 5′-AGGGAGGACGATGCGG-3′; DP3: 5′-CCGCTGGAAGTGACTGACAC-3′; DSFP5a: 5′-AATGATACGGCGACCACCGACTATGGATACTTAGTCAGGGAGGACGATGCGG-3′; RPIX1-DP3: 5′-CAAGCAGAAGACGGCATACGAGATCGTGATGTGACTGGAGTTCCTTGGCACCCGAGAATTCCACCGCTGGAAGTGACTGACAC-3′. The underlined 6-nucleotide sequence represents the index. Each index is as follows: RPIX2-DP3: ACATCG; RPIX3-DP3: GCCTAA; RPIX4-DP3: TGGTCA; RPIX5-DP3: CACTGT; RPIX6-DP3: ATTGGC; RPIX7-DP3: GATCTG; RPIX8-DP3: TCAAGT; RPIX9-DP3: CTGATC; SSP1: 5′-CTATGGATACTTAGTCAGGGAGGACGATGCGG-3′.
Bioinformatics analysis.
Microarray data was processed using the R/Bioconductor package limma (51). Background correction was performed using the normexp + offset method (56). The loess and scale methods (57) were used for normalization within and between arrays, respectively. RNA-Seq reads were aligned to the Ensembl release 76 primary assembly with STAR version 2.5.1a (58). Unsupervised hierarchical clustering of samples was performed with Cluster3 (59), and heatmaps were generated with Java TreeView (60). Gene counts were derived from the number of uniquely aligned unambiguous reads by Subread:featureCount version 1.4.6-p5 (61). Isoform expression of known Ensembl transcripts was estimated with Salmon version 0.8.2 (62). All gene counts were imported into the R/Bioconductor package edgeR (63), and TMM normalization size factors were calculated to adjust for differences in library size. The TMM size factors and the matrix of counts were imported into the R/Bioconductor package limma (64). Weighted likelihoods based on the observed mean-variance relationship of every gene and sample were calculated for all samples with voomWithQualityWeights (65). Differential expression analysis was performed to analyze for differences between conditions, and the results were filtered only for the genes with Benjamini-Hochberg false discovery rate adjusted P values less than or equal to 0.05. The Database for Annotation, Visualization and Integrated Discovery (DAVID) tool (66, 67) was used to identify enrichment for functional pathways within differentially expressed gene sets.
Data availability.
The RNA-Seq and RNA CLIP data discussed in this publication were deposited in the NCBI’s Gene Expression Omnibus and are accessible through GEO Series accession number GSE157233 (https://www.ncbi.nlm.nih.gov/geo/query/acc.cgi?acc=GSE157233). The RNA array data are accessible through GEO Series accession number GSE157516 (https://www.ncbi.nlm.nih.gov/geo/query/acc.cgi?acc=GSE157516).
Studies with human subjects.
Deidentified human liver tissue blocks were obtained from the Department of Pathology at Washington University School of Medicine. For the evaluation of HCC samples, a total of 137 patients were analyzed from a patient cohort at Mayo Clinic, Rochester, Minnesota. A tissue microarray was constructed using 2 uninvolved and 2 tumor tissue samples per patient, which were analyzed for A1CF expression by immunohistochemistry. Available clinical and laboratory data are presented in Supplemental Table 2. Patients were followed for an average of 3.7 years after diagnosis. Patients were classified as having NAFLD as an underlying component of HCC (a) if confirmed by history and pathological examination or (b) if they had a BMI greater than 30 (>25 for Asians) and there was no other identified etiology (viral hepatitis, alcohol, etc.). A1CF expression was defined as total pixels per high-power field and categorized as follows: category 1 (less than 12 × 104 pixels), category 2 (12 × 104 to 23 × 104 pixels), category 3 (23 × 104 to 32 × 104 pixels), category 4 (greater than 32 × 104 pixels). A second set of patient samples was obtained from cirrhotic and normal liver tissue in a cohort of patients undergoing surgical resection at Queen Mary Hospital, Hong Kong. Demographic data for these subjects are shown in Supplemental Table 6.
Statistics.
Data are mean ± SEM for the indicated sample number. Statistical significance was set at a P value less than 0.05. Data were analyzed using GraphPad Prism 7.02 (GraphPad Software Inc.) by unpaired t test or Mann-Whitney U test. For multigroup comparisons, statistical differences were performed by 1-way ANOVA and Tukey’s multiple-comparison post hoc test.
Statistical analyses on the clinical samples were performed using the average A1CF expression of paired samples (pixel count per high-power field) per tissue type. Unpaired t test or 1-way ANOVA was used to compare A1CF expression of tumor or uninvolved tissue across subgroups of HCC patients categorized based on different clinical and paraclinical parameters. For survival analysis, we used Kaplan-Meier curves to estimate overall survival patterns in patients with different levels of A1CF expression. We also used Cox proportional hazard modeling to adjust the prognostic role of A1CF expression in HCC patients for other putative prognostic factors. First, simple Cox models were used to identify factors associated with overall survival of patients. Next, we fit the preliminary multivariable model based on A1CF and other candidate factors identified from the previous step and used backward elimination method to reach the final multivariable Cox proportional hazard model. Prognostic factors with significant hazard ratios or major contribution to fitness of the model were retained in the final Cox model. We also investigated the prognostic role of tissue A1CF expression in a subset of HCC patients with NAFLD (n = 17/19; Supplemental Table 4). The association between A1CF expression and overall survival was also adjusted for recurrence and time to the first recurrence in this subgroup. Statistical analysis of clinical data was conducted using Stata statistical software version SE 11.2 (StataCorp LP).
Study approval.
All animal experiments were conducted in accordance with the guidelines of the Institutional Animal Care and Use Committee of Washington University School of Medicine (IACUC 20180266, 20190028). Collection of samples from the Mayo Clinic patient cohort was approved by the Mayo Clinic Institutional Review Board (IRB 16-003945). Collection of samples from the Hong Kong patient cohort was approved by the Institutional Review Board of the University of Hong Kong/Hospital Authority Hong Kong West Cluster. For the TMAs, not all the patients provided written informed consent. Both patients who provided written informed consent and deceased patients who did not opt out of research, as required by Minnesota law, have previously been approved by the Mayo Clinic Institutional Review Board for inclusion in our Hepatobiliary Neoplasia Biorepository (IRB 707-03). TMAs were assembled from paraffin blocks from these patients stored in the Mayo Pathology Tissue Archives.
Author contributions
VB and NOD developed study design and approach. VB, JDR, EAM, and YX performed experimental methodology and animal and cell studies. VB, IN, EMB, JCM, ION, YH, and LRR provided pathology and immunohistochemical analysis. JDR, VB, JHN, SS, BBM, JCM, and DCR performed bioinformatics analysis. VB, JDR, JHN, JCM, DCR, IN, YH, LRR, and NOD interpreted the data. VB, JDR, SS, JHN, IN, YX, EAM, BBM, EMB, JCM, DCR, ION, YH, LRR, and NOD prepared and reviewed the manuscript.
Supplementary Material
Acknowledgments
This work was supported by grants DK112378 (to DCR and NOD); DK119437 (to NOD); P30DK52574 from the Washington University Digestive Disease Research Core Center (Advanced Imaging and Tissue Analysis Core and Biobank Core) (to NOD, DCR, and JCM); RGC TRS T12-704/16-R (to ION); DK106382 and CA230282 (to DCR); P50CA210964 (Mayo Clinic Hepatobiliary SPORE) from the National Cancer Institute (to LRR); and R01DK105129 and R01DK094989 (to JCM).
Version 1. 09/17/2020
In-Press Preview
Version 2. 01/04/2021
Print issue publication
Footnotes
Conflict of interest: The authors have declared that no conflict of interest exists.
Copyright: © 2021, American Society for Clinical Investigation.
Reference information: J Clin Invest. 2021;131(1):e138699.https://doi.org/10.1172/JCI138699.
Contributor Information
Valerie Blanc, Email: Vblanc@wustl.edu.
Jesse D. Riordan, Email: jesse-riordan@uiowa.edu.
Saeed Soleymanjahi, Email: Saeed.s.jahi@gmail.com.
ILKe Nalbantoglu, Email: Ilke.nalbantoglu@yale.edu.
Yan Xie, Email: Yxie@dom.wustl.edu.
Elizabeth A. Molitor, Email: e.quasebarth@wustl.edu.
Blair B. Madison, Email: bbmadison@gmail.com.
Elizabeth M. Brunt, Email: EBrunt@path.wustl.edu.
Jason C. Mills, Email: jmills@wustl.edu.
Deborah C. Rubin, Email: drubin@wustl.edu.
Yeonjung Ha, Email: Yeonjung.ha@gmail.com.
Lewis R. Roberts, Email: roberts.lewis@mayo.edu.
Nicholas O. Davidson, Email: nod@wustl.edu.
References
- 1.Rinella M, Charlton M. The globalization of nonalcoholic fatty liver disease: prevalence and impact on world health. Hepatology. 2016;64(1):19–22. doi: 10.1002/hep.28524. [DOI] [PubMed] [Google Scholar]
- 2.Forner A, Llovet JM, Bruix J. Hepatocellular carcinoma. Lancet. 2012;379(9822):1245–1255. doi: 10.1016/S0140-6736(11)61347-0. [DOI] [PubMed] [Google Scholar]
- 3.Adams LA, Anstee QM, Tilg H, Targher G. Non-alcoholic fatty liver disease and its relationship with cardiovascular disease and other extrahepatic diseases. Gut. 2017;66(6):1138–1153. doi: 10.1136/gutjnl-2017-313884. [DOI] [PubMed] [Google Scholar]
- 4.Sookoian S, Pirola CJ, Valenti L, Davidson NO. Genetic pathways in nonalcoholic fatty liver disease: insights from systems biology. Hepatology. 2020;72(1):330–346. doi: 10.1002/hep.31229. [DOI] [PMC free article] [PubMed] [Google Scholar]
- 5.Pirola CJ, Sookoian S. The dual and opposite role of the TM6SF2-rs58542926 variant in protecting against cardiovascular disease and conferring risk for nonalcoholic fatty liver: a meta-analysis. Hepatology. 2015;62(6):1742–1756. doi: 10.1002/hep.28142. [DOI] [PubMed] [Google Scholar]
- 6.Reyes-Soffer G, et al. Complex effects of inhibiting hepatic apolipoprotein B100 synthesis in humans. Sci Transl Med. 2016;8(323):323ra312. doi: 10.1126/scitranslmed.aad2195. [DOI] [PMC free article] [PubMed] [Google Scholar]
- 7.Panta R, Dahal K, Kunwar S. Efficacy and safety of mipomersen in treatment of dyslipidemia: a meta-analysis of randomized controlled trials. J Clin Lipidol. 2015;9(2):217–225. doi: 10.1016/j.jacl.2014.12.006. [DOI] [PubMed] [Google Scholar]
- 8.Cuchel M, et al. Efficacy and safety of a microsomal triglyceride transfer protein inhibitor in patients with homozygous familial hypercholesterolaemia: a single-arm, open-label, phase 3 study. Lancet. 2013;381(9860):40–46. doi: 10.1016/S0140-6736(12)61731-0. [DOI] [PMC free article] [PubMed] [Google Scholar]
- 9.Lellek H, Kirsten R, Diehl I, Apostel F, Buck F, Greeve J. Purification and molecular cloning of a novel essential component of the apolipoprotein B mRNA editing enzyme-complex. J Biol Chem. 2000;275(26):19848–19856. doi: 10.1074/jbc.M001786200. [DOI] [PubMed] [Google Scholar]
- 10.Mehta A, Kinter MT, Sherman NE, Driscoll DM. Molecular cloning of apobec-1 complementation factor, a novel RNA-binding protein involved in the editing of apolipoprotein B mRNA. Mol Cell Biol. 2000;20(5):1846–1854. doi: 10.1128/MCB.20.5.1846-1854.2000. [DOI] [PMC free article] [PubMed] [Google Scholar]
- 11.Blanc V, Sessa KJ, Kennedy S, Luo J, Davidson NO. Apobec-1 complementation factor modulates liver regeneration by post-transcriptional regulation of interleukin-6 mRNA stability. J Biol Chem. 2010;285(25):19184–19192. doi: 10.1074/jbc.M110.115147. [DOI] [PMC free article] [PubMed] [Google Scholar]
- 12.Snyder EM, et al. APOBEC1 complementation factor (A1CF) is dispensable for C-to-U RNA editing in vivo. RNA. 2017;23(4):457–465. doi: 10.1261/rna.058818.116. [DOI] [PMC free article] [PubMed] [Google Scholar]
- 13.Blanc V, et al. Apobec1 complementation factor (A1CF) and RBM47 interact in tissue-specific regulation of C to U RNA editing in mouse intestine and liver. RNA. 2019;25(1):70–81. doi: 10.1261/rna.068395.118. [DOI] [PMC free article] [PubMed] [Google Scholar]
- 14.Galloway CA, Ashton J, Sparks JD, Mooney RA, Smith HC. Metabolic regulation of APOBEC-1 complementation factor trafficking in mouse models of obesity and its positive correlation with the expression of ApoB protein in hepatocytes. Biochim Biophys Acta. 2010;1802(11):976–985. doi: 10.1016/j.bbadis.2010.06.003. [DOI] [PMC free article] [PubMed] [Google Scholar]
- 15.Liu DJ, et al. Exome-wide association study of plasma lipids in >300,000 individuals. Nat Genet. 2017;49(12):1758–1766. doi: 10.1038/ng.3977. [DOI] [PMC free article] [PubMed] [Google Scholar]
- 16.Araki S, Okazaki M, Goto S. Impaired lipid metabolism in aged mice as revealed by fasting-induced expression of apolipoprotein mRNAs in the liver and changes in serum lipids. Gerontology. 2004;50(4):206–215. doi: 10.1159/000078349. [DOI] [PubMed] [Google Scholar]
- 17.Wen Y, et al. A stable but reversible integrated surrogate reporter for assaying CRISPR/Cas9-stimulated homology-directed repair. J Biol Chem. 2017;292(15):6148–6162. doi: 10.1074/jbc.M117.777722. [DOI] [PMC free article] [PubMed] [Google Scholar]
- 18.Zhou J, et al. Hepatic fatty acid transporter Cd36 is a common target of LXR, PXR, and PPARγ in promoting steatosis. Gastroenterology. 2008;134(2):556–567. doi: 10.1053/j.gastro.2007.11.037. [DOI] [PubMed] [Google Scholar]
- 19.Zhou L, et al. Cidea promotes hepatic steatosis by sensing dietary fatty acids. Hepatology. 2012;56(1):95–107. doi: 10.1002/hep.25611. [DOI] [PubMed] [Google Scholar]
- 20.Lee YJ, et al. Nuclear receptor PPARγ-regulated monoacylglycerol O-acyltransferase 1 (MGAT1) expression is responsible for the lipid accumulation in diet-induced hepatic steatosis. Proc Natl Acad Sci U S A. 2012;109(34):13656–13661. doi: 10.1073/pnas.1203218109. [DOI] [PMC free article] [PubMed] [Google Scholar]
- 21.Yamanaka S, et al. Apolipoprotein B mRNA-editing protein induces hepatocellular carcinoma and dysplasia in transgenic animals. Proc Natl Acad Sci U S A. 1995;92(18):8483–8487. doi: 10.1073/pnas.92.18.8483. [DOI] [PMC free article] [PubMed] [Google Scholar]
- 22.Yamanaka S, Poksay KS, Arnold KS, Innerarity TL. A novel translational repressor mRNA is edited extensively in livers containing tumors caused by the transgene expression of the apoB mRNA-editing enzyme. Genes Dev. 1997;11(3):321–333. doi: 10.1101/gad.11.3.321. [DOI] [PubMed] [Google Scholar]
- 23.Nikolaou KC, Vatandaslar H, Meyer C, Schmid MW, Tuschl T, Stoffel M. The RNA-binding protein A1CF regulates hepatic fructose and glycerol metabolism via alternative RNA splicing. Cell Rep. 2019;29(2):283–300. doi: 10.1016/j.celrep.2019.08.100. [DOI] [PubMed] [Google Scholar]
- 24.Li X, et al. A splicing switch from ketohexokinase-C to ketohexokinase-A drives hepatocellular carcinoma formation. Nat Cell Biol. 2016;18(5):561–571. doi: 10.1038/ncb3338. [DOI] [PMC free article] [PubMed] [Google Scholar]
- 25.Monga SP. β-Catenin signaling and roles in liver homeostasis, injury, and tumorigenesis. Gastroenterology. 2015;148(7):1294–1310. doi: 10.1053/j.gastro.2015.02.056. [DOI] [PMC free article] [PubMed] [Google Scholar]
- 26.Xu Q, et al. Targeting Stat3 blocks both HIF-1 and VEGF expression induced by multiple oncogenic growth signaling pathways. Oncogene. 2005;24(36):5552–5560. doi: 10.1038/sj.onc.1208719. [DOI] [PubMed] [Google Scholar]
- 27.Szklarczyk D, et al. STRING v11: protein-protein association networks with increased coverage, supporting functional discovery in genome-wide experimental datasets. Nucleic Acids Res. 2019;47(D1):D607–D613. doi: 10.1093/nar/gky1131. [DOI] [PMC free article] [PubMed] [Google Scholar]
- 28.Madison BB, et al. LIN28B promotes growth and tumorigenesis of the intestinal epithelium via Let-7. Genes Dev. 2013;27(20):2233–2245. doi: 10.1101/gad.224659.113. [DOI] [PMC free article] [PubMed] [Google Scholar]
- 29.Lee AK, Ahn SG, Yoon JH, Kim SA. Sox4 stimulates β-catenin activity through induction of CK2. Oncol Rep. 2011;25(2):559–565. doi: 10.3892/or.2010.1091. [DOI] [PubMed] [Google Scholar]
- 30.Jiao Y, et al. SRY-Box containing gene 4 promotes liver steatosis by upregulation of SREBP-1c. Diabetes. 2018;67(11):2227–2238. doi: 10.2337/db18-0184. [DOI] [PubMed] [Google Scholar]
- 31.Vervoort SJ, van Boxtel R, Coffer PJ. The role of SRY-related HMG box transcription factor 4 (SOX4) in tumorigenesis and metastasis: friend or foe? Oncogene. 2013;32(29):3397–3409. doi: 10.1038/onc.2012.506. [DOI] [PubMed] [Google Scholar]
- 32.Lourenco AR, Coffer PJ. SOX4: joining the master regulators of epithelial-to-mesenchymal transition? Trends Cancer. 2017;3(8):571–582. doi: 10.1016/j.trecan.2017.06.002. [DOI] [PubMed] [Google Scholar]
- 33.Li T, Liu X, Yang A, Fu W, Yin F, Zeng X. Associations of tumor suppressor SPARCL1 with cancer progression and prognosis. Oncol Lett. 2017;14(3):2603–2610. doi: 10.3892/ol.2017.6546. [DOI] [PMC free article] [PubMed] [Google Scholar]
- 34.Tsukamoto S, et al. Smad9 is a new type of transcriptional regulator in bone morphogenetic protein signaling. Sci Rep. 2014;4:7596. doi: 10.1038/srep07596. [DOI] [PMC free article] [PubMed] [Google Scholar]
- 35.Pagadala M, Kasumov T, McCullough AJ, Zein NN, Kirwan JP. Role of ceramides in nonalcoholic fatty liver disease. Trends Endocrinol Metab. 2012;23(8):365–371. doi: 10.1016/j.tem.2012.04.005. [DOI] [PMC free article] [PubMed] [Google Scholar]
- 36.Esmaeili M, Mirzaahmadi S, Tehrani GA. Evaluation of additional Abcc12 gene expression character in breast cancer samples using formal diagnostic profile. Gene Cell Tissue. 2019;5(4):e84392 [Google Scholar]
- 37.Dominguez D, et al. Sequence, structure, and context preferences of human RNA binding proteins. Mol Cell. 2018;70(5):854–867. doi: 10.1016/j.molcel.2018.05.001. [DOI] [PMC free article] [PubMed] [Google Scholar]
- 38.Sookoian S, Pirola CJ. Genetics of nonalcoholic fatty liver disease: from pathogenesis to therapeutics. Semin Liver Dis. 2019;39(2):124–140. doi: 10.1055/s-0039-1679920. [DOI] [PubMed] [Google Scholar]
- 39.de Vries PS, et al. Multiancestry genome-wide association study of lipid levels incorporating gene-alcohol interactions. Am J Epidemiol. 2019;188(6):1033–1054. doi: 10.1093/aje/kwz005. [DOI] [PMC free article] [PubMed] [Google Scholar]
- 40.Blanc V, Kennedy S, Davidson NO. A novel nuclear localization signal in the auxiliary domain of apobec-1 complementation factor regulates nucleocytoplasmic import and shuttling. J Biol Chem. 2003;278(42):41198–41204. doi: 10.1074/jbc.M302951200. [DOI] [PubMed] [Google Scholar]
- 41.Grohmann M, et al. Obesity drives STAT-1-dependent NASH and STAT-3-dependent HCC. Cell. 2018;175(5):1289–1306. doi: 10.1016/j.cell.2018.09.053. [DOI] [PMC free article] [PubMed] [Google Scholar]
- 42.Rodriguez FJ, Lewis-Tuffin LJ, Anastasiadis PZ. E-cadherin’s dark side: possible role in tumor progression. Biochim Biophys Acta. 2012;1826(1):23–31. doi: 10.1016/j.bbcan.2012.03.002. [DOI] [PMC free article] [PubMed] [Google Scholar]
- 43.Matsumura T, Makino R, Mitamura K. Frequent down-regulation of E-cadherin by genetic and epigenetic changes in the malignant progression of hepatocellular carcinomas. Clin Cancer Res. 2001;7(3):594–599. [PubMed] [Google Scholar]
- 44.Wei Y, Van Nhieu JT, Prigent S, Srivatanakul P, Tiollais P, Buendia MA. Altered expression of E-cadherin in hepatocellular carcinoma: correlations with genetic alterations, β-catenin expression, and clinical features. Hepatology. 2002;36(3):692–701. doi: 10.1053/jhep.2002.35342. [DOI] [PubMed] [Google Scholar]
- 45.Ghafoory S, et al. Nuclear accumulation of CDH1 mRNA in hepatocellular carcinoma cells. Oncogenesis. 2015;4:e152. doi: 10.1038/oncsis.2015.11. [DOI] [PMC free article] [PubMed] [Google Scholar]
- 46.Liu H, et al. SPAG5 promotes hepatocellular carcinoma progression by downregulating SCARA5 through modifying β-catenin degradation. J Exp Clin Cancer Res. 2018;37(1):229. doi: 10.1186/s13046-018-0891-3. [DOI] [PMC free article] [PubMed] [Google Scholar]
- 47.Sang X, et al. Human hepatic cancer stem cells (HCSCs) markers correlated with immune infiltrates reveal prognostic significance of hepatocellular carcinoma. Front Genet. 2020;11:112. doi: 10.3389/fgene.2020.00112. [DOI] [PMC free article] [PubMed] [Google Scholar]
- 48.Blanc V, Henderson JO, Newberry EP, Kennedy S, Luo J, Davidson NO. Targeted deletion of the murine apobec-1 complementation factor (acf) gene results in embryonic lethality. Mol Cell Biol. 2005;25(16):7260–7269. doi: 10.1128/MCB.25.16.7260-7269.2005. [DOI] [PMC free article] [PubMed] [Google Scholar]
- 49.Yang JD, et al. Factors that affect risk for hepatocellular carcinoma and effects of surveillance. Clin Gastroenterol Hepatol. 2011;9(7):617–623. doi: 10.1016/j.cgh.2011.03.027. [DOI] [PubMed] [Google Scholar]
- 50.Vilar-Gomez E, et al. Fibrosis severity as a determinant of cause-specific mortality in patients with advanced nonalcoholic fatty liver disease: a multi-national cohort study. Gastroenterology. 2018;155(2):443–457. doi: 10.1053/j.gastro.2018.04.034. [DOI] [PubMed] [Google Scholar]
- 51.Wobser H, et al. Lipid accumulation in hepatocytes induces fibrogenic activation of hepatic stellate cells. Cell Res. 2009;19(8):996–1005. doi: 10.1038/cr.2009.73. [DOI] [PubMed] [Google Scholar]
- 52.Hirano K, et al. Targeted disruption of the mouse apobec-1 gene abolishes apolipoprotein B mRNA editing and eliminates apolipoprotein B48. J Biol Chem. 1996;271(17):9887–9890. doi: 10.1074/jbc.271.17.9887. [DOI] [PubMed] [Google Scholar]
- 53.Simonet WS, Bucay N, Lauer SJ, Taylor JM. A far-downstream hepatocyte-specific control region directs expression of the linked human apolipoprotein E and C-I genes in transgenic mice. J Biol Chem. 1993;268(11):8221–8229. [PubMed] [Google Scholar]
- 54.Xie Y, Nassir F, Luo J, Buhman K, Davidson NO. Intestinal lipoprotein assembly in apobec-1–/– mice reveals subtle alterations in triglyceride secretion coupled with a shift to larger lipoproteins. Am J Physiol Gastrointest Liver Physiol. 2003;285(4):G735–G746. doi: 10.1152/ajpgi.00202.2003. [DOI] [PubMed] [Google Scholar]
- 55.Blanc V, et al. Genome-wide identification and functional analysis of Apobec-1-mediated C-to-U RNA editing in mouse small intestine and liver. Genome Biol. 2014;15(6):R79. doi: 10.1186/gb-2014-15-6-r79. [DOI] [PMC free article] [PubMed] [Google Scholar]
- 56.Ritchie ME, et al. A comparison of background correction methods for two-colour microarrays. Bioinformatics. 2007;23(20):2700–2707. doi: 10.1093/bioinformatics/btm412. [DOI] [PubMed] [Google Scholar]
- 57.Smyth GK, Speed T. Normalization of cDNA microarray data. Methods. 2003;31(4):265–273. doi: 10.1016/S1046-2023(03)00155-5. [DOI] [PubMed] [Google Scholar]
- 58.Dobin A, et al. STAR: ultrafast universal RNA-seq aligner. Bioinformatics. 2013;29(1):15–21. doi: 10.1093/bioinformatics/bts635. [DOI] [PMC free article] [PubMed] [Google Scholar]
- 59.de Hoon MJ, Imoto S, Nolan J, Miyano S. Open source clustering software. Bioinformatics. 2004;20(9):1453–1454. doi: 10.1093/bioinformatics/bth078. [DOI] [PubMed] [Google Scholar]
- 60.Saldanha AJ. Java Treeview — extensible visualization of microarray data. Bioinformatics. 2004;20(17):3246–3248. doi: 10.1093/bioinformatics/bth349. [DOI] [PubMed] [Google Scholar]
- 61.Liao Y, Smyth GK, Shi W. featureCounts: an efficient general purpose program for assigning sequence reads to genomic features. Bioinformatics. 2014;30(7):923–930. doi: 10.1093/bioinformatics/btt656. [DOI] [PubMed] [Google Scholar]
- 62.Patro R, Duggal G, Love MI, Irizarry RA, Kingsford C. Salmon provides fast and bias-aware quantification of transcript expression. Nat Methods. 2017;14(4):417–419. doi: 10.1038/nmeth.4197. [DOI] [PMC free article] [PubMed] [Google Scholar]
- 63.Robinson MD, McCarthy DJ, Smyth GK. edgeR: a Bioconductor package for differential expression analysis of digital gene expression data. Bioinformatics. 2010;26(1):139–140. doi: 10.1093/bioinformatics/btp616. [DOI] [PMC free article] [PubMed] [Google Scholar]
- 64.Ritchie ME, et al. limma powers differential expression analyses for RNA-sequencing and microarray studies. Nucleic Acids Res. 2015;43(7):e47. doi: 10.1093/nar/gkv007. [DOI] [PMC free article] [PubMed] [Google Scholar]
- 65.Liu R, et al. Why weight? Modelling sample and observational level variability improves power in RNA-seq analyses. Nucleic Acids Res. 2015;43(15):e97. doi: 10.1093/nar/gkv412. [DOI] [PMC free article] [PubMed] [Google Scholar]
- 66.Huang da W, Sherman BT, Lempicki RA. Systematic and integrative analysis of large gene lists using DAVID bioinformatics resources. Nat Protoc. 2009;4(1):44–57. doi: 10.1038/nprot.2008.211. [DOI] [PubMed] [Google Scholar]
- 67.Huang da W, et al. Extracting biological meaning from large gene lists with DAVID. Curr Protoc Bioinformatics. 2009;Chapter 13:Unit 13 11. doi: 10.1002/0471250953.bi1311s27. [DOI] [PubMed] [Google Scholar]
Associated Data
This section collects any data citations, data availability statements, or supplementary materials included in this article.
Supplementary Materials
Data Availability Statement
The RNA-Seq and RNA CLIP data discussed in this publication were deposited in the NCBI’s Gene Expression Omnibus and are accessible through GEO Series accession number GSE157233 (https://www.ncbi.nlm.nih.gov/geo/query/acc.cgi?acc=GSE157233). The RNA array data are accessible through GEO Series accession number GSE157516 (https://www.ncbi.nlm.nih.gov/geo/query/acc.cgi?acc=GSE157516).


