
Fig. 2: Fully visualized β-tail extends deep into the α active site.
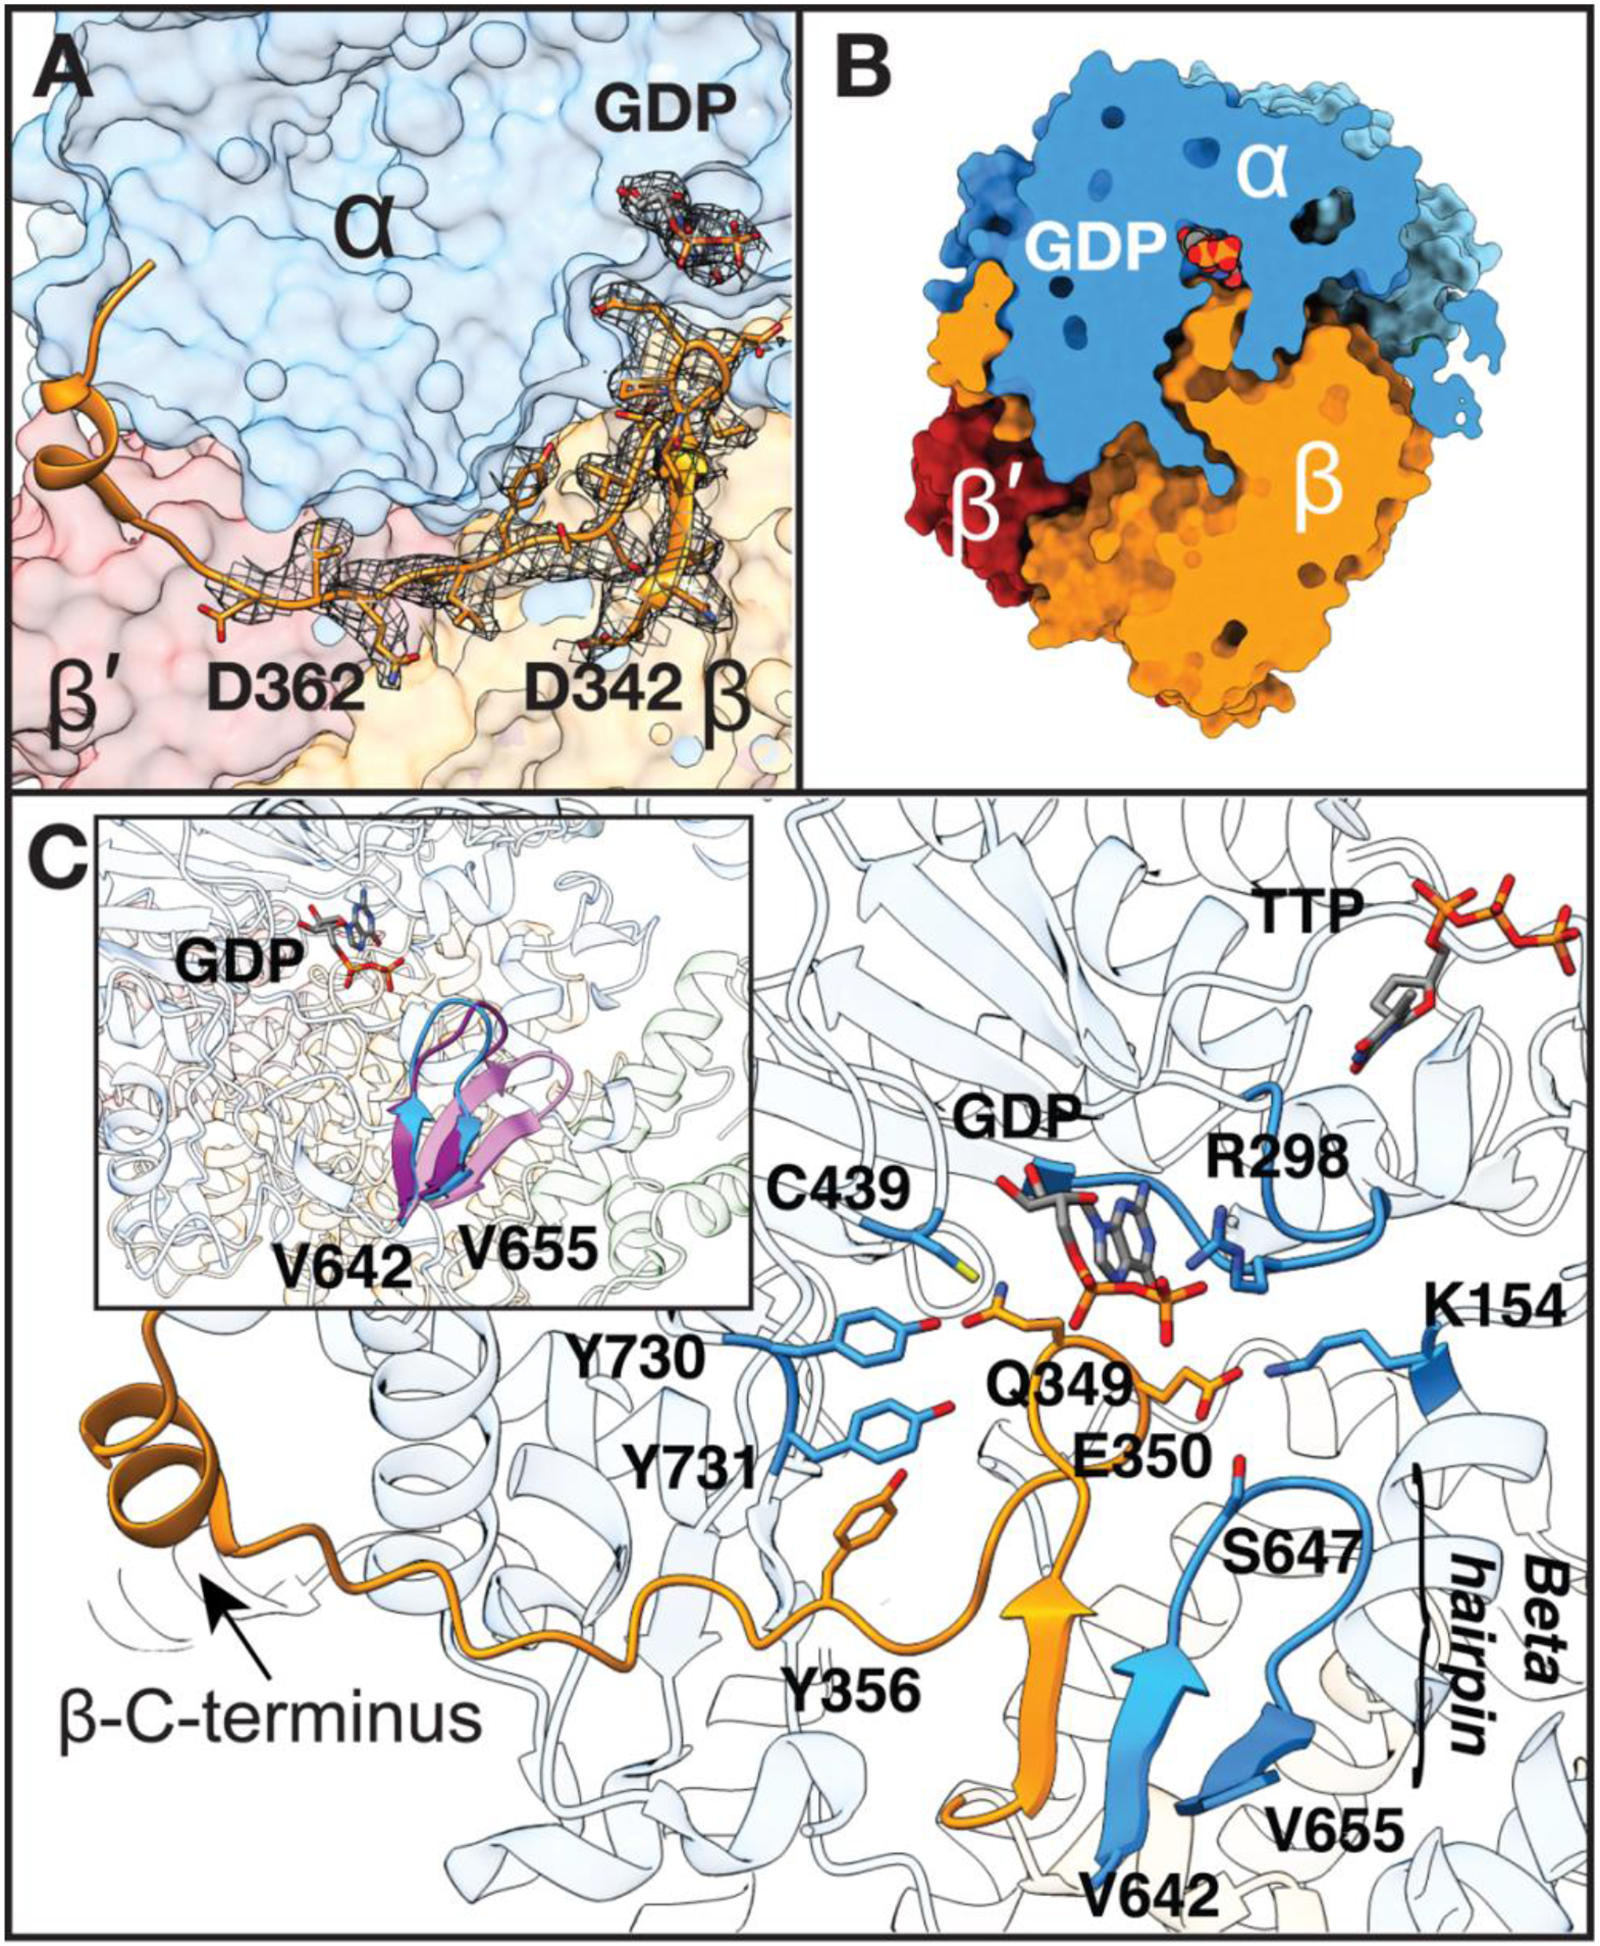
A) Missing β residues 342–362 modeled into cryo-EM density (grey mesh, threshold set to 0.0249). B) Slice through space filling representation showing tight packing between subunits which blocks solvent accessibility. C) β-C-terminus extends up to substrate-binding site in α. Regions of α that contact β-tail are displayed. Substrate GDP and effector TTP are shown in sticks, separated by the specificity loop, labeled at position R298. Inset: β-hairpin of α shifts 5-Å toward the active site upon substrate and effector binding and the ordering of the specificity loop. Three α2 structures were aligned to highlight movement of this β-hairpin: substrate-free α2 (pink, PDB 2R1R (14)), substrate/effector-bound α2 from inhibited α4β4 (purple, PDB 5CNV (13)), and substrate-bound α2 from our structure of active α2β2 (blue).