

Abstract
Background:
The APOE ε4 allele is the largest genetic risk factor for late-onset Alzheimer’s disease (AD). Recent literature suggested that the contribution of APOE ε4 to AD risk could be population-specific, with ε4 conferring a lower risk to Blacks or African Americans.
Objective:
To investigate the effect of APOE haplotypes on AD risk in individuals with European ancestry (EU) and Blacks or African Americans (AA).
Methods:
We selected data from 1) the National Alzheimer’s Coordinating Center: a total of 3,486 AD cases and 4,511 controls (N = 7,997, 60% female) with genotypes from the Alzheimer’s Disease Genetics Consortium (ADGC), and 2) the Rush University Religious Orders Study and Memory and Aging Project (ROSMAP) cohort with 578 AD and 670 controls (N = 1,248, 60% female). Using ε3 homozygotes as the reference, we compared the association of various APOE haplotypes with the clinical and neuropathological correlates of dementia in AA and EU.
Results:
In both cohorts, we find no difference in the odds or age of onset of AD among the ε4-linked haplotypes defined by rs769449 within either AA or EU. Additionally, while APOE ε4 was associated with a faster rate of decline, no differences were found in rate of decline, clinical or neuropathological features among the ε4-linked haplotypes. Further analysis with other variants near the APOE locus failed to identify any effect modification.
Conclusion:
Our study finds similar effects of the ε4-linked haplotypes defined by rs769449 on AD as compared to ε3 in both AA and EU. Future studies are required to understand the heterogeneity of APOE conferred risk of AD among various genotypes and populations.
Keywords: African Americans, APOE, clinicopathological features, Europeans, genotype
INTRODUCTION
Alzheimer’s disease (AD) is the main cause of dementia and constitutes an immense and growing social and economic burden especially in an aging population [1]. In the United States, 1 in 10 people over 65 years old and 1 in 3 people over 85 have AD [1]. The APOE gene region presents by far the strongest genetic association with late onset AD [2, 3]. Among the many loci that have been associated with AD in recent large-scale genome wide association studies (GWAS), the APOE locus still accounts for the vast majority of the explained heritability [4–6]. In particular, the APOE ε4 allele is relatively common: it is present in up to 60% of AD patients [7], corresponding to a Minor Allele Frequency (MAF) of 0.35, and is estimated to increase the risk for AD 3–4 folds in heterozygous and 9–15 fold for ε4 homozygous individuals [8]. The risk conferred by APOE ε4 to AD, however, has been reported to vary across populations and geography [9] and the effect size of the APOE ε4 associated AD risk and related outcomes among African American populations is inconsistent across studies.
Several studies examining the possible differential effect of APOE ε4 in European and African populations have shown that individuals with African ancestry have a lower risk than those with European or Asian ancestry [10–13], while others report no difference in cognitive decline in African Americans compared with Caucasians [14, 15]. Even among those with African ancestry, there are differences in ε4-associated effects: one study reports that APOE ε4 had a weaker effect in Yoruba than in African American participants [16]. These differences across studies in odds of AD and related endophenotypes motivated us to perform a comprehensive clinicopathological characterization of the APOE haplotypes and local variants across populations in two different cohorts. Instead of analyzing all variants and haplotypes, we focus only on those that have been previously reported in the literature.
In particular, we concentrated on the study by Babenko et al. that attempted to characterize the APOE locus in more detail by further stratifying it into more specific haplotypes present in different populations and describing how these haplotypes relate to AD risk [17]. The haplotypes were composed of 5 common variants within the APOE gene: 3 non-coding variants (rs440446, rs769449, rs769450) and the two coding variants known to define haplotypes ε2/ε3/ε4 (rs429358 differentiating ε3 and ε4 and rs7412 differentiating ε3 and ε2) [17]. They observed that an Ancestral ε4 version confers a lesser AD/MCI risk compared to the European version, which is explained by the potential putative protective effect of the variant rs769449 on DNA methylation and open chromatin state [17].
There have been several other efforts to analyze variants in the vicinity of the APOE locus that modify APOE ε4-associated AD risk. For example, one study found that the single nucleotide polymorphism (SNP) rs438811 increases the odds of AD in APOE ε4 carriers but not in non-carriers potentially by altering APOE transcription [18, 19]. Other variants in the regulatory region have also been reported to increase AD risk or are associated with the rate of cognitive decline [19–21]. A recent study by Zhou et al. reported a large number of non-coding variants in APOE that are significantly associated with AD independent of the effect of APOE ε4 that may act by affecting chromatin states and gene expression [22]. They determined a list of 9 causal variants in the nearby genes APOC1 and PVRL2 with some of the effect sizes comparable to the main variants defining ε2 and ε4.
In our study, we analyze the effect of these haplotypes and variants on the risk of Alzheimer’s disease and related clinicopathologic traits. We use the Rush University Religious Orders Study and Memory and Aging Project (ROSMAP) cohorts [23, 24] and longitudinal data in the National Alzheimer’s Coordinating Center (NACC) Uniform Data Set (UDS) from the NIA-sponsored Alzheimer’s Disease Research Centers (ADRCs) with genotype data from the Alzheimer’s Disease Genetics Consortium (ADGC).
METHODS
Study data
We used data from two different cohorts. The first was the NIA-sponsored Alzheimer’s Disease Research Centers (ADRCs) for which we obtained clinical, neuropsychological, and neuropathological information longitudinal data from the National Alzheimer’s Coordinating Center (NACC) in Uniform Data Set (UDS) format [25, 26] and genotype data from the Alzheimer Disease Genetics Consortium (ADGC). The NACC dataset contained UDS visits from September 2005 to December 2018. From the NACC database, we extracted 3,106 AD cases (53% female, mean age of onset 71.86 years) and 3,797 cognitively healthy controls (63.5% female) of European descent (NACC EU). Additionally, we selected 1,094 Blacks or African American individuals (NACC AA): 380 AD cases (68.4% female, mean age of onset 73.60) and 714 cognitively healthy controls (75.8% female). Genotyping was performed using Illumina Human660, OmniExpress, and imputed by the ADGC using the Haplotype Reference Consortium (HRC) data.
The second cohort was the ROSMAP study where genotyping and clinical data was obtained from the Sage Bionetwork synapse website: https://www.synapse.org/#!Synapse:syn3219045. Only individuals with European ancestry were included in our study (578 AD and 670 controls). Genotyping was performed in two batches using Affymetrix GeneChip 6.0 and Illumina HumanOmniExpress. More information on the ROSMAP study can be found here [27].
APOE haplotypes and variants
We analyzed the APOE haplotypes identified by Babenko et al. [17], which uses whole genome sequencing data from the Alzheimer’s Disease Neuroimaging Initiative (ADNI http://www.adniinfo.org/) project. The combination of five SNPs (three non-coding: rs440446 C/G, rs769449 A/G, rs769450 A/G and two coding: rs429358 C/T and rs7412 T/C) leads to the definition of six haplotypes that account for more than 99.7% of the observed haplotypes within African, European, and Asian populations (Table 3 of the Babenko paper) [17]. Of note, the two versions of the ε4 haplotype have largely different prevalence in African versus European populations, with the African/Ancestral ε4 allele dominant in African samples and the other version of ε4 in European and Asian samples [17]. For simplicity purposes we refer to these two ε4 haplotypes as the Ancestral ε4 and the European ε4, respectively. The two haplotypes only differ by SNP rs769449 (G in Ancestral ε4, A in European ε4) in the first position. In this study, we analyze the four haplotypes defined by rs769449 in the first position and the two APOE SNPs (rs429358, rs7412) in the last two positions: ε2 (GTT), ε3 (GTC), ε4 Ancestral (GCC), ε4 European (ACC). There were no heterogenous effects in the other two haplotypes, and thus they were not studied. In addition, we studied, nine other variants in the vicinity of the APOE locus that have previously been reported in the literature to modify the effect of the ε4 allele.
Clinical, cognitive testing, and neuropathological outcomes
For the NACC data, AD outcomes were defined using the recommended procedures and criteria available at the time of the visit. For example, UDS v3.0 uses the 2011 National Institute on Aging-Alzheimer’s Association (NIA-AA) diagnostic criteria for AD [28] and mild cognitive impairment (MCI) [29]. In the ROSMAP cohort, the outcome of AD, MCI, or no cognitive impairment (NCI) is defined by the criteria of the joint working group of the National Institute of Neurological and Communicative Disorders and Stroke and the Alzheimer’s Disease and Related Disorders Association (NINCDS/ADRDA) and the diagnosis was made by a clinician with dementia expertise with input from cognitive tests and a neuropsychologist [30].
From the NACC database, we obtained several cognitive and neuropsychological test scores and genotypes for 2,895 AD and MCI cases and 3,963 controls. For this data, non-Hispanic whites represent >80% of the samples, so we included all individuals in one model and added reported race and Hispanic status as covariates. The memory Z-scores were computed using the Logical Memory immediate and delayed story units (for UDS v1.0 and v2.0), or the Craft Story 21 immediate and delayed recall paraphrase units (for UDS v3.0) [31, 32]. The executive Z-scores were the average Z-scores of the TRAILB and Digit span backward length tests [31, 32]. The language Z-scores were the average of the Category fluency of animals and vegetables scores [31, 32]. We also analyzed the trajectory of the CDR® Dementia Staging Instrument. For AD/MCI cases, we only considered visits post the age of onset (age of decline) and for the cognitively normal control subjects, their entire visit history.
From NACC, we also have neuropathological (autopsy) data on a proportion of samples: 1,628 AD cases and 455 controls of which 984 cases and 289 controls have genotype data. The vast majority of these (901 cases and 262 controls) are non-Hispanic white individuals. Therefore, we chose to limit our analysis to non-Hispanic white individuals. The variables considered were brain weight, atrophy, micro and gross infarcts, white matter rarefaction, arteriolosclerosis, atherosclerosis, the Braak stage for neurofibrillary degeneration (from stage 0 to VI), the CERAD score for density of neocortical neuritic plaques (0 to 3) and the NIA-AA ADNC score of AD neuropathological change of Not AD (0) to High ADNC (3) [33].
Statistical analysis
To test the association of the four APOE haplotypes with AD/MCI, we separately analyzed the NACC EU, the NACC AA, and the ROSMAP EU individuals. We used a multivariate logistic regression using the R glm function with AD (or MCI) as the outcome variable, and dosage of ε2, the Ancestral ε4 haplotype, and the European ε4 haplotype as the predictors and controlled for age, gender, and education. Homozygous ε3 was used as the reference haplotype.
Effect of APOE haplotypes on the cognitive or neuropsychiatric trajectory was estimated using a linear mixed effect model with the R lme4 package and adjusted for age at first visit, sex, race, and years of education. The interaction of the variable of interest and time was tested for significance. For testing the association of the continuous neuropathological outcomes, we used a linear regression using with the variable of interest as outcome and the dosage of the different haplotypes and the confounders (sex, age, education, race, Hispanic status) as the independent variables. For the discrete neuropathological outcomes, we used an ordinal regression with the R polr unction from the MASS package. All analyses were preformed using R (r-project.org).
RESULTS
Effect of APOE haplotypes in individuals of European descent
We aggregated the individuals of European descent (EU) from the NACC database for whom we have clinical data, genotype arrays, and independent APOE genotyping (ε4/ε3/ε2). After removing those with missing data, we had 3,106 AD cases, 677 MCI, and 3,797 controls having APOE genotypes, rs769449 status from the genotype array data and information on age, gender, and education. The SNP rs7412 identifying the ε2 allele was present in the array where it largely confirmed the independent APOE genotyping data (1 mismatch and 35 missing genotype values across 7,580 individuals), whereas rs429358 responsible for distinguishing ε4 was not present in the post QC genotype array data. The SNP rs769449, which fully differentiates the two versions of ε4 haplotype (Ancestral ε4 allele versus European ε4), was directly measured by the genotyping array and not imputed. Thus, we had either APOE genotyping or array data to analyze the ε2, ε3, Ancestral ε4, and European ε4 haplotypes.
We first tested the association of the APOE haplotypes with AD using ε3/ε3 individuals as the reference group. The results are summarized in Table 1A: ε2 reduces AD risk (p = 4.7E-10) and both versions of ε4 increase AD risk with less significant p-values for the Ancestral ε4 haplotype compared to the European ε4 haplotype (4.5E-50 and 1.6E-132, respectively). However, the estimated odds ratios are very similar between the two ε4 haplotypes; the Ancestral allele has a slightly higher odds ratio of 3.61 (CI = [3.04,4.27]) compared to the European ε4 allele 3.48 (CI = [3.15,3.84]), and there is no significant difference between the effects (Wald test p = 0.68). This suggests that rs769449 and the ancestral haplotype are not associated with a differential risk of AD. Furthermore, a non-inferiority Wald test with a 20% margin on the European haplotype odds ratio rejects the null hypothesis with a p of 0.007. In a sensitivity analysis restricted to ε4 heterozygous individuals only, a logistic regression with rs769449, age, gender, and education as explanatory variables did not find any association between AD and rs769449, even with sample sizes that are larger than those used by Babenko et al.
Table 1A.
A) APOE haplotype association with AD. Odds ratios, confidence intervals and p-values are obtained from a logistic regression model controlling for confounders and the dosages of the different haplotypes. ε3 is taken as the reference haplotype. A) Haplotype analysis of individuals of European descent (EU) in NACC. Analysis restricted to EU individuals
| Name | Haplotype | Age of onset | AD | CTR | OR | 95% CI | P |
|---|---|---|---|---|---|---|---|
| E3 | GTC | 72.9 | 0.601 | 0.77 | |||
| E2 | GTT | 75.3 | 0.036 | 0.075 | 0.58 | [0.49–0.69] | 4.70E–10 |
| E4 Ancestral | GCC | 70.2 | 0.078 | 0.034 | 3.61 | [3.04–4.27] | 4.50E–50 |
| E4 European | ACC | 69.6 | 0.285 | 0.122 | 3.48 | [3.15–3.84] | 1.60E–132 |
| 3106 | 3797 |
Next, we used the same methodology on the ROSMAP data, which includes genotypes, APOE status, and clinical covariates on 578 AD cases, 362 MCI cases, and 670 controls of European descent (See Table 1B). Given the lower sample size compared to the NACC data, the odds ratio estimates had higher uncertainties, but we still observe similar AD odds ratios for both the Ancestral ε4 (OR = 2.63; CI = [1.49–4.65]) and the European ε4 haplotype (OR = 3.23;CI = 2.40–4.34).
Table 1B.
B) Haplotype analysis of EU in ROSMAP
| Name | Haplotype | Age of onset | AD | CTR | OR | 95% CI | P |
|---|---|---|---|---|---|---|---|
| E3 | GTC | 88.3 | 0.74 | 0.804 | |||
| E2 | GTT | 90.7 | 0.063 | 0.104 | 0.58 | [0.42–0.80] | 1.20E–03 |
| E4 Ancestral | GCC | 86.1 | 0.033 | 0.019 | 2.63 | [1.49–4.65] | 8.90E–04 |
| E4 European | ACC | 85.7 | 0.163 | 0.073 | 3.23 | [2.40–4.34] | 1.00E–14 |
| 578 | 670 |
Finally, we repeated the same experiments to compare MCI individuals and controls and we also observed no evidence of difference between the odds ratios of the Ancestral ε4 and the European ε4 haplotype either in NACC or ROSMAP (see Supplementary Table 1A and 1B). Note that we did observe a significant conferred MCI risk for both ε4 alleles, unlike what was reported in Babenko et al. where the Ancestral version of ε4 was associated with AD but not with MCI.
Effect of APOE haplotypes in Blacks or African Americans
The most recent rounds of ADGC genotyping included large amounts of data on Blacks or African Americans individuals (AA) from NACC. After the same preprocessing done in the previous section, we ended up with 380 AD cases, 49 MCI cases, and 714 controls having APOE status data, rs769449 status, and clinical information. We used the same logistic regression model correcting for gender, age, and education and summarized the results in Table 1C. African Americans often have mixed genetic backgrounds and therefore we observe that about 15% of AA ε4 carriers carry the European ε4 allele while the majority carry the African/Ancestral version of ε4. In Table 1C, we observe that ε2 reduces the risk for AD while both versions of ε4 increase it. Congruent with what we observed in the previous section, we do not observe any difference in association between two different versions of ε4, with the Ancestral ε4 having an odds ratio of 3.85 (CI = 2.97–4.99) and the European ε4 having an odds ratio of 4.23 (CI = 2.51–7.12). This is also true for the association of both ε4 alleles with MCI (Supplementary Table 1C). Notably, we again observed a significant conferred MCI risk for both ε4 alleles, unlike what was reported in Babenko et al.
Table 1C.
C) Haplotype analysis of African Americans (AA) in NACC. Analysis restricted to AA
| Name | Haplotype | Age of onset | AD | CTR | OR | 95% CI | P |
|---|---|---|---|---|---|---|---|
| E3 | GTC | 75.1 | 0.536 | 0.697 | |||
| E2 | GTT | 74.7 | 0.064 | 0.121 | 0.66 | [0.45–0.98] | 4.20E–02 |
| E4 Ancestral | GCC | 71.3 | 0.341 | 01.56 | 3.85 | [2.97–4.99] | 2.90E–24 |
| E4 European | ACC | 72 | 0.059 | 0.025 | 4.23 | [2.51–7.12] | 5.60E–08 |
| 380 | 714 |
A power analysis conducted based on the current AA cohort suggests that a sample size of at least 12,000 is required to reach statistical significance and determining with 80% power whether or not the Ancestral ε4 haplotype confers a lower risk (20% lower) compared to the European ε4 haplotype. With a sample size of 6,903 (same size as the NHW cohort), the power to detect non-inferiority is 0.56. This suggests that future studies should aim for larger cohorts or at least large numbers of AA ε4 carriers to conclusively determine effects of haplotypes.
We also observe that the odds ratios of Blacks or African Americans individuals do not differ much from those of individuals of European descent (Fig. 1). Moreover, there was no significant interaction of race with either Ancestral or European haplotype (p = 0.339 and p = 0.820, respectively), suggesting that the APOE ε4 conferred risk appears to be similar across both populations and ε4 haplotypes as defined by Babenko et al.
Fig. 1.
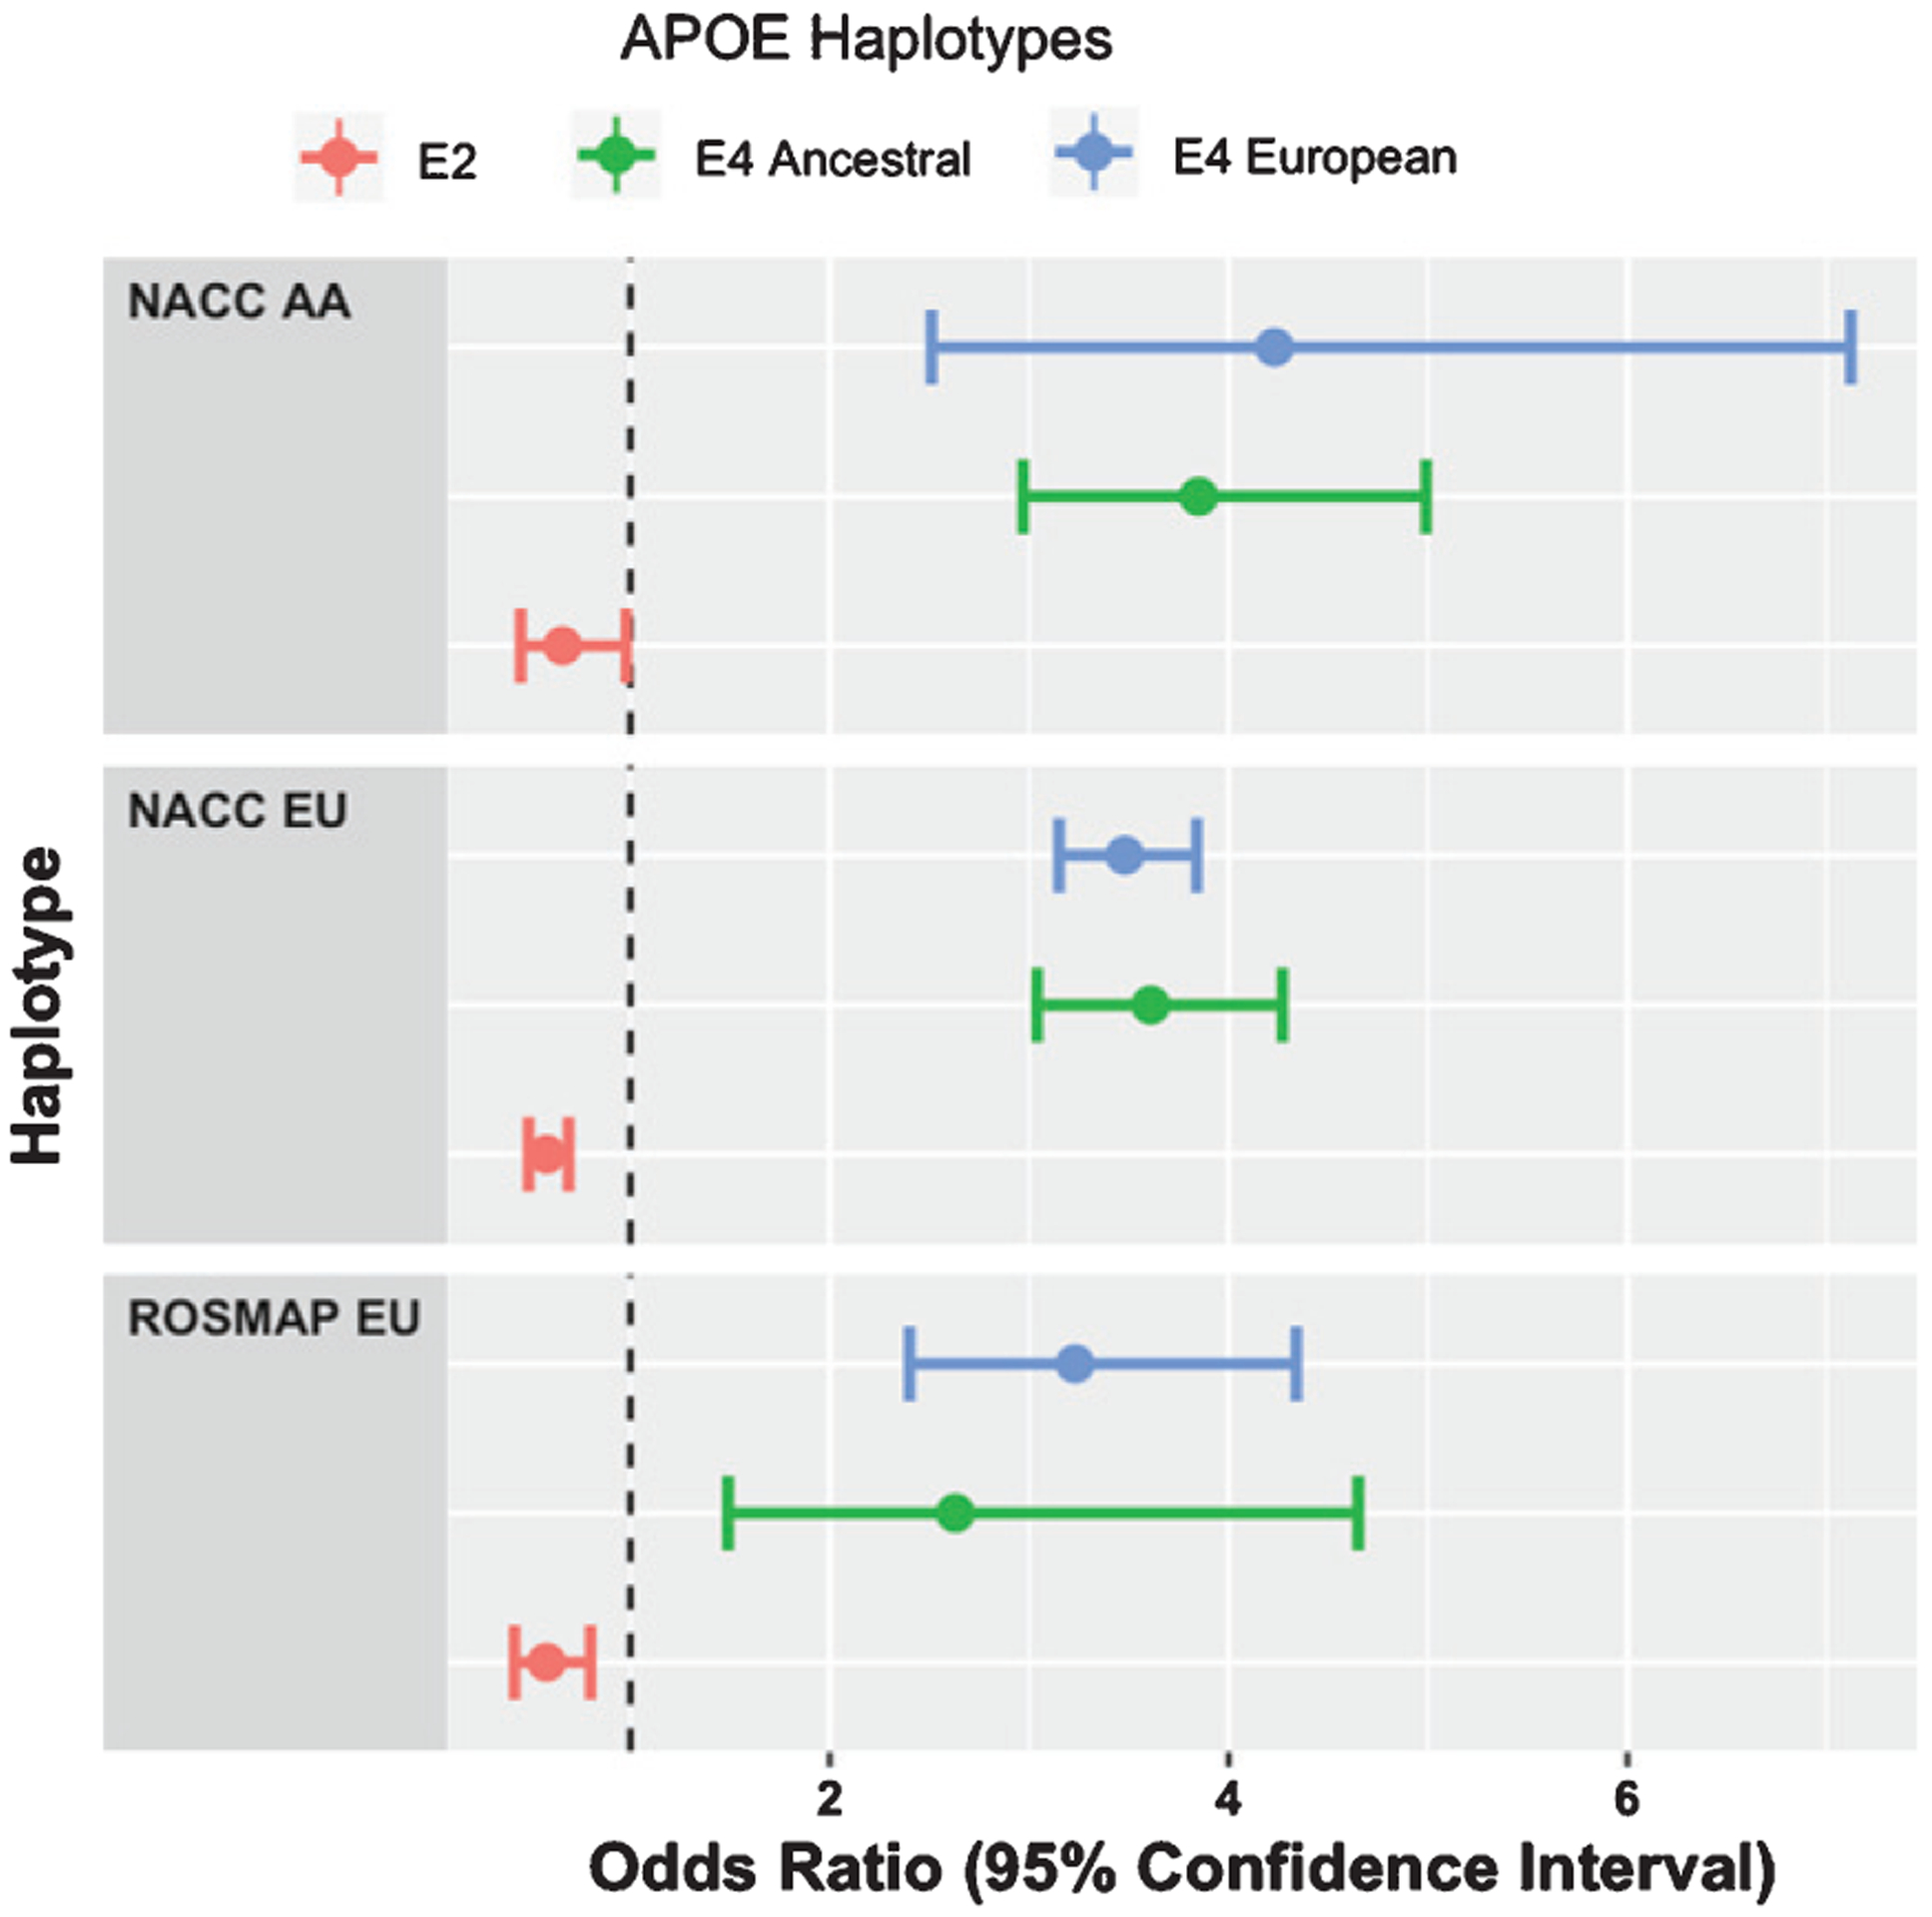
Odds ratios of APOE haplotypes across cohorts and populations.
Characterizing the effect of APOE haplotypes on clinical and neuropathological variables
AD is a highly complex disease with a number of correlated clinical and neuropathological presentations. In strictly defining individuals as AD or controls, we might lose fine-grained phenotypic differences and biologically relevant heterogeneity in the disease mechanism. In this section, we attempt to characterize the effects of the four different APOE haplotypes on several clinical and neuropathological variables of interest in AD including measures of cognitive decline and accumulation of plaques and tangles.
Table 2 displays the tested variables in individuals with AD/MCI and controls, the associations, and the direction of effect of the different APOE haplotypes. Overall, our results confirm previously known results such as ε2 carriers having later age of onset (about 0.6–2 years older than ε3/ε3 individuals across our different cohorts), ε4 carriers having earlier age of onset (about 4 years younger than ε3/ε3 individuals across our different cohorts). In addition, the ε2 allele is also associated with a slightly lower rate of decline for memory scores, computed using the Logical Memory or Crafts Story recall score as well as the language and CDR scores. The effect of ε2 on the rate of change of episodic memory has previously been reported [34]. On the other hand, while both ε4 alleles were associated with a faster rate of cognitive decline as has been reported by prior studies [35–37], no difference in rate of decline was observed between the ε4-linked haplotypes. Analysis of memory, executive or language scores in cognitively normal individuals had no effect, suggesting that there are no allelic differences at baseline (Table 2).
Table 2.
APOE haplotypes effects on measures of cognitive decline in AD/MCI cases and non-AD Controls. Computation of memory, executive and language scores were computes from Z-scores of neuropsychological tests as described in methods. Odds ratios and p-values are obtained from a multiple linear regression model controlling for confounders and the dosages of the different haplotypes. ε3 is taken as the reference haplotype
| AD | Control | |||||
|---|---|---|---|---|---|---|
| E2 | E4 Anc. | E4 Eur. | E2 | E4 Anc. | E4 Eur. | |
| Age of onset | 1.07* | 0.95** | 0.94**** | - | - | - |
| Memory _Slope | 1.04*** | 0.99 | 0.98** | 1.01 | 1.01 | 0.99 |
| Executive_Slope | 1.02 | 0.96**** | 0.96**** | 1.00 | 0.99 | 1.00 |
| Language_Slope | 1.02* | 0.95**** | 0.96**** | 1.00 | 1.00 | 1.00 |
| CDRSUM._Slope | 0.90* | 1.25**** | 1.12**** | 1.00 | 1.00 | 1.00 |
| CDRGLOB_Slope | 0.98* | 1.04**** | 1.02**** | 1.00 | 1.00 | 1.00 |
p < 0.05,
p < 0.01,
p < 0.001,
p < 0.0001.
Table 3 shows the result of analysis with neuropathology variables in AD cases and controls respectively. Brain weight, atrophy, vascular pathologies, Braak stage of neurofibrillary degeneration [38], CERAD score for neuritic plaques [39], and Alzheimer’s Disease Neuropathologic Changes (NIA-ADNC) [33] were assessed. We observed an association of ε2 with lower levels of both plaques and tangles and inversely ε4 was associated with higher levels of plaques and tangles. Previous studies have reported fewer tangles in ε2, with a stronger effect in homozygous individuals [40], and others have reported increased amyloidosis and tau tangles in ε4 carriers [41–43]. However, we observed no difference in the effects of the Ancestral ε4 allele and the European ε4 allele. While a few associations were observed in control brains, none of them, except Braak stage, was significant after multiple comparison corrections (Table 3).
Table 3.
APOE haplotypes effects on neuropathological features measured in autopsies of AD cases and non-AD controls. Odds ratios and p-values are obtained from a logistic or ordinal regression model controlling for confounders and the dosages of the different haplotypes. ε3 is taken as the reference haplotype
| AD | Control | |||||
|---|---|---|---|---|---|---|
| E2 | E4 Anc. | E4 Eur. | E2 | E4 Anc. | E4 Eur. | |
| Whole brain weight | 0.96 | 0.91 | 1.04 | 1.04 | 0.74 | 0.64* |
| Fresh or fixed weight | 1.3 | 1 | 1 | 0.69 | 0.57 | 0.26 |
| Cerebral cortex atrophy | 1.07 | 1.11 | 1.01 | 0.8 | 1.16 | 1.91** |
| Lobar atrophy | 0.73 | 0.66 | 1.03 | 1 | 12* | 1.1 |
| Hippocampus atrophy | 1.08 | 1.17 | 1.03 | 1.11 | 0.99 | 0.69 |
| White matter rarefaction | 0.9 | 1.11 | 1.03 | 0.79 | 1.34 | 0.93 |
| Arteriolosclerosis | 0.78 | 0.85 | 0.97 | 1.12 | 1.61 | 1.91 |
| Atherosclerosis | 0.99 | 1.06 | 0.93 | 0.8 | 1.03 | 0.81 |
| Microinfarcts | 1.52 | 1.57 | 1.16 | 0.58 | 0.68 | 0.44 |
| Infarcts | 0.56 | 1.3 | 1.3 | 1.1 | 1.40E–07 | 0.55 |
| Braak stage for neurofibrillary degeneration | 0.78* | 1.23* | 1.3**** | 1.33 | 2.79*** | 1.19 |
| CERAD score for neuritic plaques | 0.74** | 1.3** | 1.34**** | 0.73 | 1.35 | 1.26 |
| NIA-AA ADNC | 0.73 | 1.17 | 1.28*** | 0.81 | 2.33 | 1.77* |
p < 0.05,
p < 0.01,
p < 0.001,
p < 0.0001.
Association of APOE variants with AD
As the four APOE haplotypes defined by rs769449—ε4 Ancestral (GCC), ε4 European (ACC)—had no major differences, next we explored other variants in the vicinity of the APOE locus. After a literature review, we selected the variants shown in Table 4 for our analysis. Most of the SNPs in the APOE region have different prevalence across racial groups (Table 4). This analysis was performed on a large set of individuals of European descent from NACC. One of the variants studied, rs6859, was measured directly on the SNP array and for the rest we used the imputed values. We verified that the imputation was accurate with less than 1% mismatch for rs429358 (ε4 defining variant) by comparing it with direct APOE genotyping data and that the imputation for rs6859 and rs769449 also corresponded closely to their measured array genotypes.
Table 4.
List of Single Nucleotide Variants assessed in this paper and their frequencies in the populations considered. Population allele frequency was obtained from https://ldlink.nci.nih.gov/?tab=ldhap and location (BP) from dbSNP: https://www.ncbi.nlm.nih.gov/snp/ (MA = affected allele)
| SNP | BP | Gene | MA | Population Frequency: African | Population Frequency: European |
|---|---|---|---|---|---|
| rs11668861 | 19:45380970 | PVRL2 | T | G = 0.572, T = 0.428 | G = 0.545, T = 0.455 |
| rs6859 | 19:45382034 | PVRL2 | G | G = 0.534, A = 0.466 | G–0.56, A = 0.44 |
| rs3852860 | 19:45382966 | PVRL2 | T | C = 0.692, T = 0.308 | C = 0.586, T = 0.414 |
| rs3852861 | 19:45383061 | PVRL2 | T | G = 0.691, T = 0.309 | G = 0.584, T = 0.416 |
| rs769449 | 19:45410002 | APOE | A | G = 0.993, A = 0.007 | G = 0.877, A = 0.123 |
| rs438811 | 19:45416741 | APOC1 | T | T = 0.548, C = 0.452 | C = 0.781, T = 0.219 |
| rs12721046 | 19:45421254 | APOC1 | A | G = 0.992, A = 0.008 | G = 0.834, A = 0.166 |
| rs12721051 | 19:45422160 | APOC1 | G | C = 0.917, G = 0.083 | C = 0.802, G = 0.198 |
| rs56131196 | 19:45422846 | APOC1 | A | G = 0.781, A = 0.219 | G = 0.802, A = 0.198 |
| rs4420638 | 19:45422946 | APOC1 | G | A = 0.78, G = 0.22 | A = 0.802, G = 0.198 |
For each of the variants, we used a logistic regression model to test the association of AD with the non-coding variants and controlled for gender, age, education, and dosage of ε2 and ε4. As seen in Table 5, no significant association was observed in any of the SNPs with AD after accounting for the effects of ε2 and ε4, and the lowest significance was observed in rs6859 (p = 0.065). If we do not distinguish between heterozygous and homozygous ε4 carriers, several SNPs are significant, suggesting strong correlations between ε4 and these variants. If we correct for ε4 but omit to control for ε2, rs6859 and rs438811 are significant after multiple comparison corrections (Table 5). We also attempted a stratified analysis where we tested these variants in only a subset of individuals such as only ε3/ε3 individuals or ε4 carriers (we only used ε4/ε3 individuals as ε4 carriers) using a logistic regression correcting for age, gender, and education. Overall, we found no association for any of the reported variants, whether we use stratification or correction for ε4 and ε2 or interaction of the SNPs with ε4 (data not shown). Finally, we verified that these same variants showed no association in ROSMAP Whole Genome Sequencing (WGS) data with 421 AD cases and 380 controls.
Table 5.
Effect of additional variants in APOE vicinity on AD risk in the ADGC data. Analysis restricted to individuals of European descent for which we have imputed genotypes
| Fully Adjusted Model | Model without ε4 dosage | Model without ε2 | |||||
|---|---|---|---|---|---|---|---|
| SNP | BP | Estimate Pr(> |z|) | Estimate | Pr(> |z|) | Estimate | Pr(> |z|) | |
| rs11668861 | 19:45380970 | 0.930 | 0.076 | 0.886 | 0.003 | 0.984 | 0.681 |
| rs6859 | 19:45382034 | 0.928 | 0.065 | 0.889 | 0.003 | 0.893 | 0.005 |
| rs3852860 | 19:45382966 | 0.981 | 0.635 | 0.944 | 0.159 | 0.967 | 0.418 |
| rs3852861 | 19:45383061 | 0.979 | 0.612 | 0.943 | 0.148 | 0.966 | 0.401 |
| rs438811 | 19:45416741 | 0.812 | 0.395 | 2.733 | 1.30E–19 | 0.601 | 2.61E–09 |
| rs12721046 | 19:45421254 | 1.070 | 0.361 | 1.426 | 4.85E–08 | 1.097 | 0.210 |
| rs12721051 | 19:45422160 | 1.189 | 0.092 | 1.912 | 2.23E–16 | 1.232 | 0.042 |
| rs56131196 | 19:45422846 | 1.191 | 0.087 | 1.905 | 2.49E–16 | 1.232 | 0.041 |
| rs4420638 | 19:45422946 | 1.189 | 0.089 | 1.900 | 2.89E–16 | 1.228 | 0.043 |
DISCUSSION
Previous literature (Babenko et al.) suggested a protective effect of rs769449 and the Ancestral ε4 allele compared to the European ε4 allele. We analyzed genotype, clinical, and neuropathological data from relatively large resources such as NACC and the ROSMAP dataset and two different populations and we were not able to validate the protective effect. Overall, we confirmed the effects of APOE ε2 and ε4 alleles on AD risk and clinical/neuropathological variables but found no difference between the two versions of the ε4 haplotypes defined by Babenko et al. either in Blacks or African Americans or individuals of European descent.
Naturally, inability to find a difference does not mean the difference is nonexistent. Differences in the cohort used and the sample sizes can lead to divergent conclusions. Moreover, variations in the statistical methodology can also lead to different interpretations. Previous studies, even with much smaller numbers of AA AD cases, showed a weaker effect of ε4 on African Americans [11–13]. Our study did not find any difference in odds of AD associated with the APOE ε4 haplotypes between Blacks or African Americans and individuals of European descent. The differing results may be because the NACC AA sample has a different underlying population structure than the previously analyzed cohorts; for example, it had fewer proportion of AD cases than the European sample and had a much higher proportion of females in the control group than in the AD group.
Further, recent studies used estimation of APOE local ancestry (LA) in mixed populations and showed a difference in conferred risk depending on the estimated ethnic origin of the APOE ε4 version [12, 44]. These studies rely on the assumption that the estimation of local ancestry via a classifier is accurate and unconfounded by other variables such as ε4 status. In this study, we explored whether the APOE ε4 haplotypes, as defined by Babenko et al., are associated with different odds of developing AD. It should be noted that while Rajabli et al. reported a significant interaction between local ancestry and the APOE ε4 genotype using a likelihood ratio test, they observed effect sizes that are similar to ours with overlapping confidence intervals for the two APOE ε4 haplotypes (1.8–3.0 and 2.4–3.9, respectively, for the African ε4 and European ε4 haplotypes) [12].
In this paper, we focused on direct haplotype definitions of Babenko et al. instead of local ancestry of the APOE gene and our findings suggest that the AD/MCI risk conferred by the ε4 haplotype appear to be similar across populations and independent of the ethnic origin of the APOE haploblock (as defined by Babenko). This can be relevant for applications predicting individuals at risk in minority populations.
Our study, however, has several limitations. First, we relied on the haplotype blocks defined by Babenko et al., which combined intragenic SNPs. Thus, we cannot exclude the possibility that larger haploblocks might contain more information and variants that modify the risk of AD. Considering a more refined characterization of APOE haplotypes with a larger number of ε4 versions could potentially uncover variants and haplotypes with different conferred AD risk. Second, while rs769449 was directly genotyped, several of the other variants studied were imputed and thus subject to imputation errors. Nevertheless, the main SNP defining the ε4 haplotypes, rs769449, was genotyped and our study is the first of its kind to perform a rigorous population-based analysis on these two ε4-linked haplotypes. In fact, since race is a confounder that is associated with both the allelic frequencies and the disease, our approach of stratified analysis is the preferred method to control for potential bias [45].
Another limitation is that we here rely on data with self-reported race to build the participants cohorts. There is an implicit assumption of homogeneity in these groupings. In reality, the group of participants generally labeled as African Americans is a very heterogeneous group which might include various backgrounds such as recent African immigrants and black Hispanics. It is possible that this labeling issue could explain some of the conflicting AA AD risk findings in the literature. Better study designs with more accurate definitions of ethnicity might help in drawing a clearer picture of AD risk across populations in relation to APOE genotypes.
AD is more prevalent in AA than EU with a meta-analytic prevalence ratio of 1.56 [46], yet it has been reported that APOE with an African ancestry confers a lower risk than the European ancestry [12]. Although our study did not confirm a lower risk among the APOE ε4 haplotypes, to further understand the heterogenous effects of the APOE ε4 allele within and across racial groups, future studies with whole genome sequencing and haplotype analysis in large samples of African Americans may be informative.
Supplementary Material
ACKNOWLEDGMENTS
This study was supported by the National Institute of Aging (NIA) grant P30AG062421. ROSMAP was supported by NIA grants P30AG10161, R01AG15819, and R01AG17917. The Alzheimer’s Disease Genetics Consortium supported the collection of samples used in this study through NIA U01AG032984 and RC2AG036528. The ADRC longitudinal data in the NACC database is funded by NIA/NIH Grant U01 AG016976. NACC data are contributed by the NIA-funded ADRCs: P30 AG019610 (PI Eric Reiman, MD), P30 AG013846 (PI Neil Kowall, MD), P30 AG062428-01 (PI James Leverenz, MD) P50 AG008702 (PI Scott Small, MD), P50 AG025688 (PI Allan Levey, MD, PhD), P50 AG047266 (PI Todd Golde, MD, PhD), P30 AG010133 (PI Andrew Saykin, PsyD), P50 AG005146 (PI Marilyn Albert, PhD), P30 AG062421-01 (PI Bradley Hyman, MD, PhD), P30 AG062422-01 (PI Ronald Petersen, MD, PhD), P50 AG005138 (PI Mary Sano, PhD), P30 AG008051 (PI Thomas Wisniewski, MD), P30 AG013854 (PI Robert Vassar, PhD), P30 AG008017 (PI Jeffrey Kaye, MD), P30 AG010161 (PI David Bennett, MD), P50 AG047366 (PI Victor Henderson, MD, MS), P30 AG010129 (PI Charles DeCarli, MD), P50 AG016573 (PI Frank LaFerla, PhD), P30 AG06242901(PI James Brewer, MD, PhD), P50 AG023501 (PI Bruce Miller, MD), P30 AG035982 (PI Russell Swerdlow, MD), P30 AG028383 (PI Linda Van Eldik, PhD), P30 AG053760 (PI Henry Paulson, MD, PhD), P30 AG010124 (PI John Trojanowski, MD, PhD), P50 AG005133 (PI Oscar Lopez, MD), P50 AG005142 (PI Helena Chui, MD), P30 AG012300 (PI Roger Rosenberg, MD), P30 AG049638 (PI Suzanne Craft, PhD), P50 AG005136 (PI Thomas Grabowski, MD), P30 AG062715-01 (PI Sanjay Asthana, MD, FRCP), P50 AG005681 (PI John Morris, MD), P50 AG047270 (PI Stephen Strittmatter, MD, PhD).
Authors’ disclosures available online (https://www.j-alz.com/manuscript-disclosures/20-0228r3).
Footnotes
SUPPLEMENTARY MATERIAL
The supplementary material is available in the electronic version of this article: https://dx.doi.org/10.3233/JAD-200228.
REFERENCES
- [1].Alzheimer’s Association (2019) 2019 Alzheimer’s disease facts and figures. Alzheimers Dement 15, 321–387. [Google Scholar]
- [2].Mahley RW, Rall SC Jr (2000) Apolipoprotein E: Far more than a lipid transport protein. Annu Rev Genomics Hum Genet 1, 507–537. [DOI] [PubMed] [Google Scholar]
- [3].Shen L, Jia J (2016) An overview of genome-wide association studies in Alzheimer’s disease. Neurosci Bull 32, 183–190. [DOI] [PMC free article] [PubMed] [Google Scholar]
- [4].Cuyvers E, Sleegers K (2016) Genetic variations underlying Alzheimer’s disease: Evidence from genome-wide association studies and beyond. Lancet Neurol 15, 857–868. [DOI] [PubMed] [Google Scholar]
- [5].Lee SH, Harold D, Nyholt DR, ANZGene Consortium; International Endogene Consortium; Genetic and Environmental Risk for Alzheimer’s disease Consortium, Goddard ME, Zondervan KT, Williams J, Montgomery GW, Wray NR, Visscher PM (2013) Estimation and partitioning of polygenic variation captured by common SNPs for Alzheimer’s disease, multiple sclerosis and endometriosis. Hum Mol Genet 22, 832–841. [DOI] [PMC free article] [PubMed] [Google Scholar]
- [6].Ridge PG, Mukherjee S, Crane PK, Kauwe JS, Alzheimer’s Disease Genetics Consortium (2013) Alzheimer’s disease: Analyzing the missing heritability. PLoS One 8, e79771. [DOI] [PMC free article] [PubMed] [Google Scholar]
- [7].Riedel BC, Thompson PM, Brinton RD (2016) Age, APOE and sex: Triad of risk of Alzheimer’s disease. J Steroid Biochem Mol Biol 160, 134–147. [DOI] [PMC free article] [PubMed] [Google Scholar]
- [8].Yamazaki Y, Zhao N, Caulfield TR, Liu CC, Bu G (2019) Apolipoprotein E and Alzheimer disease: Pathobiology and targeting strategies. Nat Rev Neurol 15, 501–518. [DOI] [PMC free article] [PubMed] [Google Scholar]
- [9].Corbo RM, Scacchi R (1999) Apolipoprotein E (APOE) allele distribution in the world. Is APOE*4 a ‘thrifty’ allele? Ann Hum Genet 63, 301–310. [DOI] [PubMed] [Google Scholar]
- [10].Farrer LA, Cupples LA, Haines JL, Hyman B, Kukull WA, Mayeux R, Myers RH, Pericak-Vance MA, Risch N, van Duijn CM (1997) Effects of age, sex, and ethnicity on the association between apolipoprotein E genotype and Alzheimer disease. A meta-analysis. APOE and Alzheimer Disease Meta Analysis Consortium. JAMA 278, 1349–1356. [PubMed] [Google Scholar]
- [11].Tang MX, Stern Y, Marder K, Bell K, Gurland B, Lantigua R, Andrews H, Feng L, Tycko B, Mayeux R (1998) The APOE-epsilon4 allele and the risk of Alzheimer disease among African Americans, whites, and Hispanics. JAMA 279, 751–755. [DOI] [PubMed] [Google Scholar]
- [12].Rajabli F, Feliciano BE, Celis K, Hamilton-Nelson KL, Whitehead PL, Adams LD, Bussies PL, Manrique CP, Rodriguez A, Rodriguez V, Starks T, Byfield GE, Sierra Lopez CB, McCauley JL, Acosta H, Chinea A, Kunkle BW, Reitz C, Farrer LA, Schellenberg GD, Vardarajan BN, Vance JM, Cuccaro ML, Martin ER, Haines JL, Byrd GS, Beecham GW, Pericak-Vance MA (2018) Ancestral origin of ApoE epsilon4 Alzheimer disease risk in Puerto Rican and African American populations. PLoS Genet 14, e1007791. [DOI] [PMC free article] [PubMed] [Google Scholar]
- [13].Evans DA, Bennett DA, Wilson RS, Bienias JL, Morris MC, Scherr PA, Hebert LE, Aggarwal N, Beckett LA, Joglekar R, Berry-Kravis E, Schneider J (2003) Incidence of Alzheimer disease in a biracial urban community: Relation to apolipoprotein E allele status. Arch Neurol 60, 185–189. [DOI] [PubMed] [Google Scholar]
- [14].Knopman DS, Mosley TH, Catellier DJ, Coker LH, Atherosclerosis Risk in Communities Study Brain MRI Study (2009) Fourteen-year longitudinal study of vascular risk factors, APOE genotype, and cognition: The ARIC MRI Study. Alzheimers Dement 5, 207–214. [DOI] [PubMed] [Google Scholar]
- [15].Sawyer K, Sachs-Ericsson N, Preacher KJ, Blazer DG (2009) Racial differences in the influence of the APOE epsilon 4 allele on cognitive decline in a sample of community-dwelling older adults. Gerontology 55, 32–40. [DOI] [PubMed] [Google Scholar]
- [16].Hendrie HC, Murrell J, Baiyewu O, Lane KA, Purnell C, Ogunniyi A, Unverzagt FW, Hall K, Callahan CM, Saykin AJ, Gureje O, Hake A, Foroud T, Gao S (2014) APOE epsilon4 and the risk for Alzheimer disease and cognitive decline in African Americans and Yoruba. Int Psychogeriatr 26, 977–985. [DOI] [PMC free article] [PubMed] [Google Scholar]
- [17].Babenko VN, Afonnikov DA, Ignatieva EV, Klimov AV, Gusev FE, Rogaev EI (2018) Haplotype analysis of APOE intragenic SNPs. BMC Neurosci 19, 16. [DOI] [PMC free article] [PubMed] [Google Scholar]
- [18].Zhang A, Zhao Q, Xu D, Jiang S (2018) Brain APOE expression quantitative trait loci-based association study identified one susceptibility locus for Alzheimer’s disease by interacting with APOE epsilon4. Sci Rep 8, 8068. [DOI] [PMC free article] [PubMed] [Google Scholar]
- [19].Laws SM, Hone E, Gandy S, Martins RN (2003) Expanding the association between the APOE gene and the risk of Alzheimer’s disease: Possible roles for APOE promoter polymorphisms and alterations in APOE transcription. J Neurochem 84, 1215–1236. [DOI] [PubMed] [Google Scholar]
- [20].Belbin O, Dunn JL, Ling Y, Morgan L, Chappell S, Beaumont H, Warden D, Smith DA, Kalsheker N, Morgan K (2007) Regulatory region single nucleotide polymorphisms of the apolipoprotein E gene and the rate of cognitive decline in Alzheimer’s disease. Hum Mol Genet 16, 2199–2208. [DOI] [PubMed] [Google Scholar]
- [21].Bratosiewicz-Wasik J, Liberski PP, Peplonska B, Styczynska M, Smolen-Dzirba J, Cycon M, Wasik TJ (2018) Regulatory region single nucleotide polymorphisms of the apolipoprotein E gene as risk factors for Alzheimer’s disease. Neurosci Lett 684, 86–90. [DOI] [PubMed] [Google Scholar]
- [22].Zhou X, Chen Y, Mok KY, Kwok TCY, Mok VCT, Guo Q, Ip FC, Chen Y, Mullapudi N, Alzheimer’s Disease Neuroimaging Initiative, Giusti-Rodriguez P, Sullivan PF, Hardy J, Fu AKY, Li Y, Ip NY (2019) Non-coding variability at the APOE locus contributes to the Alzheimer’s risk. Nat Commun 10, 3310. [DOI] [PMC free article] [PubMed] [Google Scholar]
- [23].Bennett DA, Schneider JA, Arvanitakis Z, Wilson RS (2012) Overview and findings from the religious orders study. Curr Alzheimer Res 9, 628–645. [DOI] [PMC free article] [PubMed] [Google Scholar]
- [24].Bennett DA, Schneider JA, Buchman AS, Barnes LL, Boyle PA, Wilson RS (2012) Overview and findings from the rush Memory and Aging Project. Curr Alzheimer Res 9, 646–663. [DOI] [PMC free article] [PubMed] [Google Scholar]
- [25].Besser L, Kukull W, Knopman DS, Chui H, Galasko D, Weintraub S, Jicha G, Carlsson C, Burns J, Quinn J, Sweet RA, Rascovsky K, Teylan M, Beekly D, Thomas G, Bollenbeck M, Monsell S, Mock C, Zhou XH, Thomas N, Robichaud E, Dean M, Hubbard J, Jacka M, Schwabe-Fry K, Wu J, Phelps C, Morris JC; Neuropsychology Work Group, Directors, and Clinical Core leaders of the National Institute on Aging-funded US Alzheimer’s Disease Centers (2018) Version 3 of the National Alzheimer’s Coordinating Center’s Uniform Data Set. Alzheimer Dis Assoc Disord 32, 351–358. [DOI] [PMC free article] [PubMed] [Google Scholar]
- [26].Morris JC, Weintraub S, Chui HC, Cummings J, Decarli C, Ferris S, Foster NL, Galasko D, Graff-Radford N, Peskind ER, Beekly D, Ramos EM, Kukull WA (2006) The Uniform Data Set (UDS): Clinical and cognitive variables and descriptive data from Alzheimer Disease Centers. Alzheimer Dis Assoc Disord 20, 210–216. [DOI] [PubMed] [Google Scholar]
- [27].Bennett DA, Buchman AS, Boyle PA, Barnes LL, Wilson RS, Schneider JA (2018) Religious Orders Study and Rush Memory and Aging Project. J Alzheimers Dis 64, S161–S189. [DOI] [PMC free article] [PubMed] [Google Scholar]
- [28].McKhann GM, Knopman DS, Chertkow H, Hyman BT, Jack CR Jr, Kawas CH, Klunk WE, Koroshetz WJ, Manly JJ, Mayeux R, Mohs RC, Morris JC, Rossor MN, Scheltens P, Carrillo MC, Thies B, Weintraub S, Phelps CH (2011) The diagnosis of dementia due to Alzheimer’s disease: Recommendations from the National Institute on Aging-Alzheimer’s Association workgroups on diagnostic guidelines for Alzheimer’s disease. Alzheimers Dement 7, 263–269. [DOI] [PMC free article] [PubMed] [Google Scholar]
- [29].Albert MS, DeKosky ST, Dickson D, Dubois B, Feldman HH, Fox NC, Gamst A, Holtzman DM, Jagust WJ, Petersen RC, Snyder PJ, Carrillo MC, Thies B, Phelps CH (2011) The diagnosis of mild cognitive impairment due to Alzheimer’s disease: Recommendations from the National Institute on Aging-Alzheimer’s Association workgroups on diagnostic guidelines for Alzheimer’s disease. Alzheimers Dement 7, 270–279. [DOI] [PMC free article] [PubMed] [Google Scholar]
- [30].Bennett DA, Schneider JA, Aggarwal NT, Arvanitakis Z, Shah RC, Kelly JF, Fox JH, Cochran EJ, Arends D, Treinkman AD, Wilson RS (2006) Decision rules guiding the clinical diagnosis of Alzheimer’s disease in two community-based cohort studies compared to standard practice in a clinic-based cohort study. Neuroepidemiology 27, 169–176. [DOI] [PubMed] [Google Scholar]
- [31].Weintraub S, Besser L, Dodge HH, Teylan M, Ferris S, Goldstein FC, Giordani B, Kramer J, Loewenstein D, Marson D, Mungas D, Salmon D, Welsh-Bohmer K, Zhou XH, Shirk SD, Atri A, Kukull WA, Phelps C, Morris JC (2018) Version 3 of the Alzheimer Disease Centers’ Neuropsychological Test Battery in the Uniform Data Set (UDS). Alzheimer Dis Assoc Disord 32, 10–17. [DOI] [PMC free article] [PubMed] [Google Scholar]
- [32].Weintraub S, Salmon D, Mercaldo N, Ferris S, Graff-Radford NR, Chui H, Cummings J, DeCarli C, Foster NL, Galasko D, Peskind E, Dietrich W, Beekly DL, Kukull WA, Morris JC (2009) The Alzheimer’s Disease Centers’ Uniform Data Set (UDS): The neuropsychologic test battery. Alzheimer Dis Assoc Disord 23, 91–101. [DOI] [PMC free article] [PubMed] [Google Scholar]
- [33].Hyman BT, Phelps CH, Beach TG, Bigio EH, Cairns NJ, Carrillo MC, Dickson DW, Duyckaerts C, Frosch MP, Masliah E, Mirra SS, Nelson PT, Schneider JA, Thal DR, Thies B, Trojanowski JQ, Vinters HV, Montine TJ (2012) National Institute on Aging-Alzheimer’s Association guidelines for the neuropathologic assessment of Alzheimer’s disease. Alzheimers Dement 8, 1–13. [DOI] [PMC free article] [PubMed] [Google Scholar]
- [34].Wilson RS, Bienias JL, Berry-Kravis E, Evans DA, Bennett DA (2002) The apolipoprotein E epsilon 2 allele and decline in episodic memory. J Neurol Neurosurg Psychiatry 73, 672–677. [DOI] [PMC free article] [PubMed] [Google Scholar]
- [35].Stone DJ, Molony C, Suver C, Schadt EE, Potter WZ (2010) ApoE genotyping as a progression-rate biomarker in phase II disease-modification trials for Alzheimer’s disease. Pharmacogenomics J 10, 161–164. [DOI] [PubMed] [Google Scholar]
- [36].Yu L, Boyle P, Schneider JA, Segawa E, Wilson RS, Leurgans S, Bennett DA (2013) APOE epsilon4, Alzheimer’s disease pathology, cerebrovascular disease, and cognitive change over the years prior to death. Psychol Aging 28, 1015–1023. [DOI] [PMC free article] [PubMed] [Google Scholar]
- [37].Reas ET, Laughlin GA, Bergstrom J, Kritz-Silverstein D, Barrett-Connor E, McEvoy LK (2019) Effects of APOE on cognitive aging in community-dwelling older adults. Neuropsychology 33, 406–416. [DOI] [PMC free article] [PubMed] [Google Scholar]
- [38].Braak H, Braak E (1991) Neuropathological stageing of Alzheimer-related changes. Acta Neuropathol 82, 239–259. [DOI] [PubMed] [Google Scholar]
- [39].Mirra SS, Heyman A, McKeel D, Sumi SM, Crain BJ, Brownlee LM, Vogel FS, Hughes JP, van Belle G, Berg L (1991) The Consortium to Establish a Registry for Alzheimer’s Disease (CERAD). Part II. Standardization of the neuropathologic assessment of Alzheimer’s disease. Neurology 41, 479–486. [DOI] [PubMed] [Google Scholar]
- [40].Reiman EM, Arboleda-Velasquez JF, Quiroz YT, Huentelman MJ, Beach TG, Caselli RJ, Chen Y, Su Y, Myers AJ, Hardy J, Paul Vonsattel J, Younkin SG, Bennett DA, De Jager PL, Larson EB, Crane PK, Keene CD, Kamboh MI, Kofler JK, Duque L, Gilbert JR, Gwirtsman HE, Buxbaum JD, Dickson DW, Frosch MP, Ghetti BF, Lunetta KL, Wang LS, Hyman BT, Kukull WA, Foroud T, Haines JL, Mayeux RP, Pericak-Vance MA, Schneider JA, Trojanowski JQ, Farrer LA, Schellenberg GD, Beecham GW, Montine TJ, Jun GR, Alzheimer’s Disease Genetics Consortium (2020) Exceptionally low likelihood of Alzheimer’s dementia in APOE2 homozygotes from a 5,000-person neuropathological study. Nat Commun 11, 667. [DOI] [PMC free article] [PubMed] [Google Scholar]
- [41].Ramanan VK, Castillo AM, Knopman DS, Graff-Radford J, Lowe VJ, Petersen RC, Jack CR Jr, Mielke MM, Vemuri P (2019) Association of apolipoprotein E varepsilon4, educational level, and sex with tau deposition and tau-mediated metabolic dysfunction in older adults. JAMA Netw Open 2, e1913909. [DOI] [PMC free article] [PubMed] [Google Scholar]
- [42].Safieh M, Korczyn AD, Michaelson DM (2019) ApoE4: An emerging therapeutic target for Alzheimer’s disease. BMC Med 17, 64. [DOI] [PMC free article] [PubMed] [Google Scholar]
- [43].Kim J, Basak JM, Holtzman DM (2009) The role of apolipoprotein E in Alzheimer’s disease. Neuron 63, 287–303. [DOI] [PMC free article] [PubMed] [Google Scholar]
- [44].Blue EE, Horimoto A, Mukherjee S, Wijsman EM, Thornton TA (2019) Local ancestry at APOE modifies Alzheimer’s disease risk in Caribbean Hispanics. Alzheimers Dement 15, 1524–1532. [DOI] [PMC free article] [PubMed] [Google Scholar]
- [45].Pourhoseingholi MA, Baghestani AR, Vahedi M (2012) How to control confounding effects by statistical analysis. Gastroenterol Hepatol Bed Bench 5, 79–83. [PMC free article] [PubMed] [Google Scholar]
- [46].Steenland K, Goldstein FC, Levey A, Wharton W (2016) A meta-analysis of Alzheimer’s disease incidence and prevalence comparing African-Americans and Caucasians. J Alzheimers Dis 50, 71–76. [DOI] [PMC free article] [PubMed] [Google Scholar]
Associated Data
This section collects any data citations, data availability statements, or supplementary materials included in this article.