

SUMMARY
The adult mammalian heart has limited capacity for regeneration following injury, whereas the neonatal heart can readily regenerate within a short period after birth. Neonatal heart regeneration is orchestrated by multiple cell types intrinsic to the heart, as well as immune cells that infiltrate the heart after injury. To elucidate the transcriptional responses of the different cellular components of the mouse heart following injury, we perform single-cell RNA sequencing on neonatal hearts at various time points following myocardial infarction and couple the results with bulk tissue RNA-sequencing data collected at the same time points. Concomitant single-cell ATAC sequencing exposes underlying dynamics of open chromatin landscapes and regenerative gene regulatory networks of diverse cardiac cell types and reveals extracellular mediators of cardiomyocyte proliferation, angiogenesis, and fibroblast activation. Together, our data provide a transcriptional basis for neonatal heart regeneration at single-cell resolution and suggest strategies for enhancing cardiac function after injury.
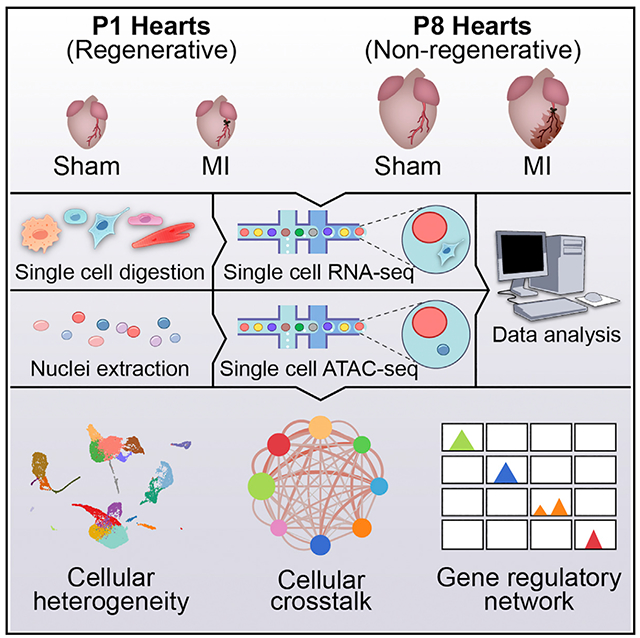
Graphical Abstract
In Brief
Using single-cell sequencing technologies, Wang et al. present single-cell databases of gene expression and open chromatin landscapes of heart cells during murine neonatal heart regeneration. Comparing the injury responses of regenerative and non-regenerative hearts reveals gene regulatory networks, cellular crosstalk, and secreted factors involved in the regeneration process.
INTRODUCTION
Ischemic heart disease remains the leading cause of mortality worldwide, largely because of the lack of regenerative capacity of the adult heart. In contrast, there is a transient time window during the neonatal period in which the mammalian heart can fully restore normal morphology and physiology after injuries such as apical resection and myocardial infarction (MI) (Porrello et al., 2011,2013; Ye et al., 2018; Zhu et al., 2018). In mice, this regenerative capacity is lost by post-natal day (P) 7 and is replaced by a fibrotic and apoptotic response leading to cardiac demise (Porrello et al., 2011,2013). Reactivating the genetic program of neonatal regeneration in the adult heart represents a potential therapeutic approach for cardiac repair.
In addition to cardiomyocytes (CMs), the heart is composed of a variety of resident cell types, including endothelial cells (ECs), fibroblasts (FBs), epicardial cells, smooth muscle cells (SMCs), pericytes, and immune cells. Upon injury, complex cellular signaling networks are activated within and among these cell types, as well as in multiple types of circulating immune cells that infiltrate the heart, culminating in the regenerative response of the neonatal heart or the pathological remodeling response of the adult heart (Aurora and Olson, 2014; Farbehi et al., 2019; Godwin et al., 2017; Martini et al., 2019). To date, most of the mechanistic studies of neonatal heart regeneration were conducted using a candidate-based approach to characterize the roles of individual genes, signaling pathways, or cell types during neonatal heart regeneration (Aurora et al., 2014; Bassat et al., 2017; D’Uva et al., 2015; Das et al., 2019; Hirose et al., 2019; Li et al., 2019; Nakada et al., 2017; Patterson et al., 2017; Singh et al., 2018; Tao et al., 2016; Xin et al., 2013). Although these studies have shed light on potential regulators of regeneration, a more comprehensive and system-level view is needed to understand the intrinsic differences between regenerative and non-regenerative hearts and their differential responses to injury. To address this issue, genomic and proteomic approaches have been applied to profile changes in gene expression, epigenetic landscapes, and protein abundance during neonatal heart regeneration using bulk tissues or flow-cytometry-sorted major cell types (Fan et al., 2020; Quaife-Ryan et al., 2017; Wang et al., 2019a, 2019b). These studies generated valuable insights into the distinctive neonatal features associated with heart regeneration at the systems biology level but because of technical limitations were unable to resolve the individual contributions of different cardiac cell subtypes to the underlying regenerative processes.
Droplet-based single-cell RNA sequencing (scRNA-seq) provides a powerful and high-throughput approach to resolving cellular heterogeneity and gene expression dynamics. Previous studies using scRNA-seq analysis of the mammalian heart have offered insights into cardiac development, homeostasis, and disease remodeling (Asp et al., 2019; Cui et al., 2019; DeLaughter et al., 2016; Farbehi et al., 2019; Gladka et al., 2018; Hill et al., 2019; Litviňuková et al., 2020; Liu et al., 2019; Martini et al., 2019; See et al., 2017; Skelly et al., 2018; Tucker et al., 2020; Wang et al., 2020; Xiao et al., 2018). Furthermore, for the regenerative neonatal heart, we have performed single-nucleus RNA-seq (snRNA-seq) on CMs and identified five distinct populations of CMs in healthy, injured, and regenerating mouse hearts (Cui et al., 2020). However, CMs represent less than half of the cellular constituents of the heart, and the heterogeneity and injury response of the remaining nonmyocytes have not been systematically studied in regenerative neonatal hearts. More importantly, the cis-regulatory landscapes of different cellular components of the heart and their dynamic changes during neonatal heart regeneration have never been characterized at the resolution of single cells, leaving the cell-type-specific gene regulatory networks underpinning the regenerative response largely unknown.
To further understand the contributions of nonmyocyte subtypes to regenerative neonatal hearts, we analyzed gene expression and chromatin accessibility of single cells during neonatal heart regeneration, with a focus on nonmyocytes. Here, we performed scRNA-seq on hearts at different time points (1 and 3 days) post-MI of regenerative and non-regenerative mice and age-matched sham controls. Single-cell transcriptomes from ~17,000 cells revealed heterogeneous cell populations and their distinct gene expression dynamics during neonatal heart regeneration. Integrative analysis of bulk RNA-seq and scRNA-seq data uncovered cell-type-specific gene modules and cellular crosstalk networks that respond to injury. We further identified previously unrecognized secreted factors that promote CM proliferation, angiogenesis, and fibrosis during regenerative and non-regenerative responses to injury. Combining these data with single-cell assay for transposase-accessible chromatin using sequencing (scATAC-seq) to profile open chromatin landscapes of ~30,000 single cells from regenerative and non-regenerative hearts further revealed injury-responsive gene regulatory networks that underpin heart regeneration and cardiac remodeling. Collectively, these data provide mechanistic insights into the molecular basis of neonatal heart regeneration at single-cell resolution and suggest various pathways that could be manipulated to facilitate cardiac repair after injury.
RESULTS
Single-Cell Analysis of Gene Expression during Neonatal Heart Regeneration
To profile changes in gene expression involved in neonatal heart regeneration in single cells, we induced MI by permanently ligating the left anterior descending (LAD) artery of mice at P1 (regenerative) and P8 (non-regenerative) and collected ventricles below the ligation plane at 1 and 3 days postinjury (dpi) for scRNA-seq. Sham surgery controls were collected at the same time points (1 and 3 days post sham [dps]) (Figure 1A). Using the 10X Genomics Chromium platform coupled with next generation sequencing, we acquired 17,320 single-cell gene expression profiles across eight different samples after removing low-quality cells and red blood cells (Figures 1B and 1C; Table S1). Using computational methods implemented in R package Seurat, we applied unsupervised graph-based clustering on the pool of all samples to enable comparable cluster identification across different samples. Cell clusters were visualized through uniform manifold approximation and projection (UMAP), a non-linear dimensional reduction algorithm implemented in the Seurat package (Stuart et al., 2019). Canonical correlation analysis (CCA) was used to integrate different datasets and correct batch effects among samples (Butler et al., 2018). Together with manual consolidation of expression of known marker genes for individual cell types, we identified 22 clusters of cells with defined gene expression signatures of known cardiac cell types (Figure S1A; Table S2). These clusters and their specific markers included CMs (Myh6+), six clusters of ECs (Cdh5+), five clusters of FBs (Pdgfra+), epicardial cells (Msln+), SMCs (Myh11+), pericytes (Kcnj8+), macrophages (Adgre1+), monocytes (Itgal+), dendritic cell (DC)-like cells (DC-like, Naaa+), granulocytes (Gra, S100a9+), T cells (Cd3g+), B cells (Ms4a1+), and glial cells (Glial, Plp1+) (Figure 1D). As expected, CMs were underrepresented in our dataset because of their incompatibility with the 10X Genomics platform as a result of their large cell diameter. Previously, we addressed this technical challenge using snRNA-seq to analyze CM heterogeneity during neonatal heart regeneration (Cui et al., 2020). In this study, we focused on nonmyocyte populations that comprise the neonatal mouse heart, and we defined the cellular heterogeneity within the major cell types.
Figure 1. Single-Cell RNA Sequencing (scRNA-Seq) Reveals Cellular Heterogeneity in Neonatal Hearts.
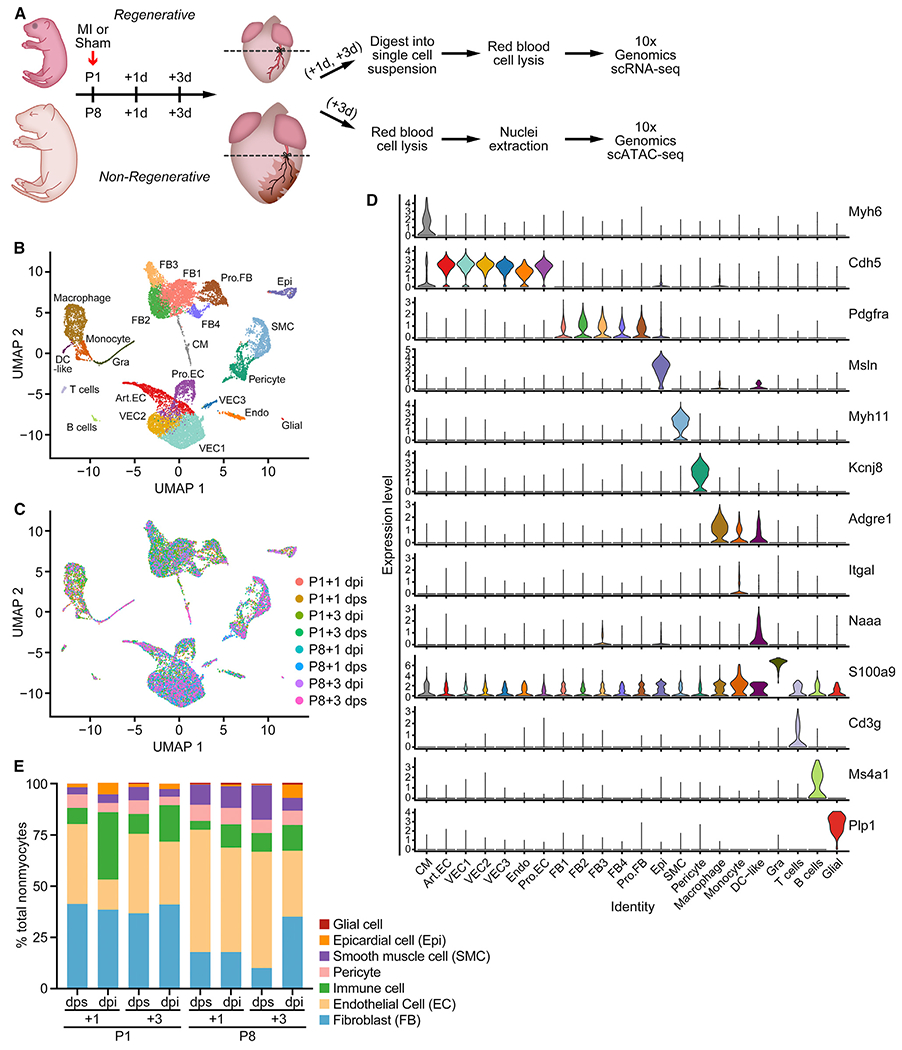
(A) Schematic of experimental design for the single-cell analyses. MI or sham surgeries were performed on P1 and P8 hearts. Ventricles below the ligation plane (indicated by the dashed lines) were collected at 1 or 3 days post-surgery for scRNA-seq, and 3-day post-surgery samples were collected for scATAC-seq. n = 8–12 animals were used for tissue collection. n = 1 sequencing library was generated for each time point and condition.
(B and C) UMAP plots showing single-cell transcriptomes analyzed in the study, color coded for cell clusters (B) or sample origin (C). For each time point, one scRNA-seq library was generated using pooled tissues dissected from 8–12 individual animals to control the differences among individual animals and dissection variations.
(D) Stacked violin plots showing expression of marker genes for each cluster. Cell clusters are color coded according to the UMAP plot in (B).
(E) Percentage of each cell type over all nonmyocytes in each scRNA-seq sample. Endothelial cells (ECs) contain Art.EC, VEC1, VEC2, VEC3, Pro.EC, and Endo clusters. Fibroblasts (FBs) contain FB1, FB2, FB3, FB4, and Pro.FB clusters. Immune cells contain macrophage, DC-like, monocyte, and Gra clusters. Art.EC, arterial endothelial cell; CM, cardiomyocyte; dpi, days postinjury; dps, days post sham; Endo, endocardial cell; Epi, epicardial cell; Gra, granulocyte; Pro.EC, proliferating endothelial cells; Pro.FB, proliferating FB; SMC, smooth muscle cell; VEC, vascular endothelial cell. See also Figure S1 and Tables S1 and S2.
During neonatal heart development, the percentage of ECs increased from 38.9% at P2 (P1+1 dps) to 56.8% at P11 (P8+3 dps), suggesting EC proliferation and angiogenesis during this period (Figure 1E). Additionally, following MI we found an increase in the percentage of immune-related cell types, including macrophages, monocytes, lymphocytes, and granulocytes (from 7.90% to 32.85% at P1+1 dpi and from 4.35% to 11.28% at P8+1 dpi) (Figure 1E). These findings reflect rapid immune cell infiltration during neonatal heart regeneration and post-MI remodeling. Furthermore, epicardial cells also showed an increase in percentage after MI, especially at P8+3 dpi (from 0.40% to 6.50%) (Figure 1E). Changes in cellular composition may be influenced by experimental parameters, such as efficiency of dissociation of cells and the number of cells analyzed. Using immunohistochemistry, we validated the infiltration of macrophages and expansion of epicardial cells after MI at P1 and P8 (Figures S1B and S1C). A table documenting the detailed composition of nonmyocytes can be found in Table S1. These data illustrate dynamic compositional changes of nonmyocytes during neonatal heart development and post-MI injury response.
scATAC-Seq Reveals Chromatin Accessibility Landscapes of the Neonatal Mouse Heart
To profile the regulatory epigenomic landscapes of single cells in regenerative and non-regenerative neonatal hearts, we performed scATAC-seq on P1 and P8 hearts at 3 days post-MI and sham (Figure 1A). After stringent quality-control filtering, we recovered single-cell chromatin accessibility profiles of 118,127 open chromatin regions from 30,520 cells. After normalization and dimensional reduction using R package Signac (Stuart et al., 2019), we identified nine major clusters of cells, together with open chromatin peaks specific to each cluster (Figures 2A–2C; Table S2). We determined the identities of these nine clusters based on gene accessibility (chromatin accessibility at promoter and gene body regions), together with manual consolidation of chromatin accessibility at genomic regions of known marker genes, and assigned them as CMs, arterial ECs (Art.ECs), vascular ECs (VECs), endocardial cells (Endos), FBs, SMCs and pericytes (SMC/Pericytes), epicardial cells (Epis), macrophages, and lymphocytes (Figure 2D; Figures S2A–S2L; Table S2). We also quantified the cellular composition of these four heart scATAC-seq samples and found that after MI, the compositional changes of P1 and P8 hearts mirrored the analysis from scRNA-seq, as previously described (Figure S2M; Table S1).
Figure 2. scATAC-Seq Reveals Open Chromatin Landscapes of Single Cells in Neonatal Hearts.
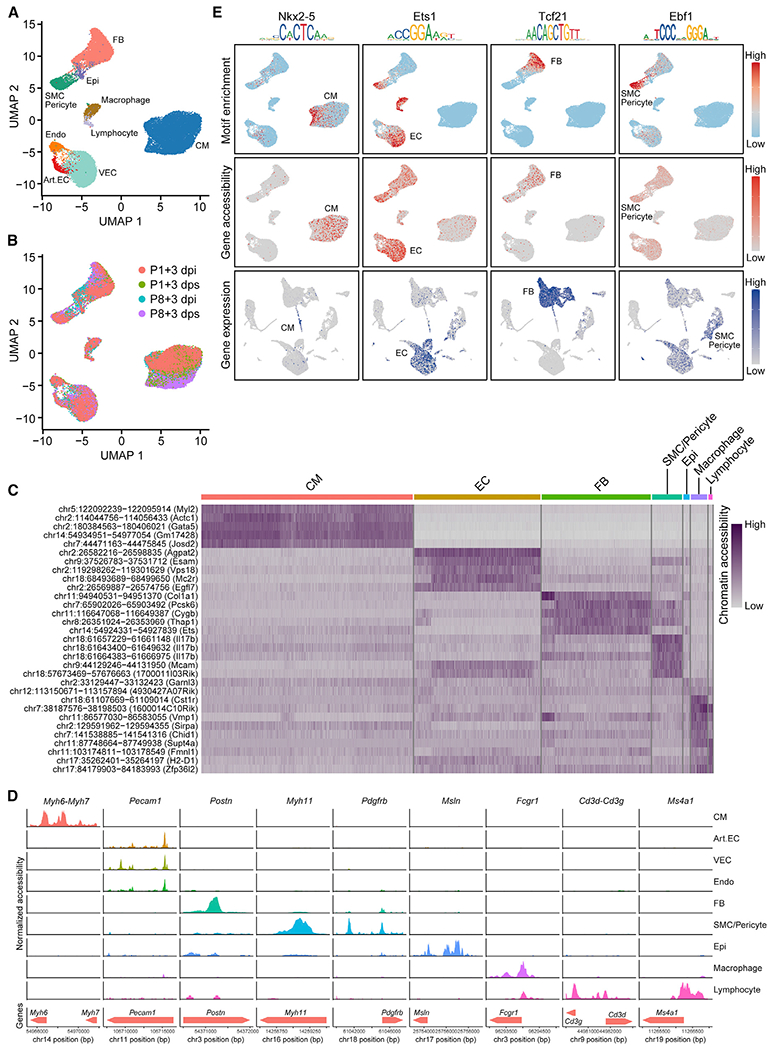
(A and B) UMAP plots showing single-cell open chromatin profiles analyzed in the study, color coded for cell clusters (A) or sample origins (B). For each time point, one scATAC-seq library was generated using pooled tissues dissected from 8–12 individual animals to control the differences among individual animals and dissection variations.
(C) Heatmap showing activity of top enriched open chromatin peaks and their associated genomic coordinates for each cell cluster.
(D) scATAC-seq tracks showing open chromatin peaks associated with cell-type-specific genes, including Myh6 and Myh7 (CM markers), Pecam1 (EC marker), Postn (FB marker), Myh11 (SMC marker), Pdgfrb (pericyte marker), Msln (epicardial cell marker), Fcgr1 (macrophage marker), Cd3g and Cd3d (T cell markers), and Ms4a1 (B cell marker), across different cell clusters.
(E) Transcription factor motif enrichment (upper row), gene accessibility (middle row), and gene expression profiles (bottom row) for lineage-specific transcription factors Nkx2–5 (CM specific, first column), Ets1 (EC enriched, second column), Tcf21 (FB specific, third column), and Ebf1 (SMC/Pericyte enriched, fourth column).
Art.EC, arterial endothelial cell; CM, cardiomyocyte; dpi, days postinjury; dps, days post sham; Endo, endocardial cell; Epi, epicardial cell; FB, fibroblast; SMC, smooth muscle cell; VEC, vascular endothelial cell. See also Figures S2 and S3 and Tables S1 and S2.
Open chromatin regions harbor DNA sequences where transcription factors (TFs) bind and control the expression of target genes. To identify TFs that are essential for cell-type-specific gene expression, we profiled TF binding motifs overrepresented in the peaks that showed differential accessibility among cell types using chromVAR (Schep et al., 2017). This analysis revealed TFs whose binding motifs showed enrichment in open chromatin regions for specific cell types (Figure S2N). These motifs included well-characterized TFs, such as MEF2C in CMs and FOXO4 in ECs (Lin et al., 1997; Zhu et al., 2015), and some less well-characterized TFs in certain lineages, such as EBF1 in SMCs and pericytes (Figure S2N).
We reasoned that a TF could be involved in cell-type-specific gene regulation if the following criteria are satisfied: (1) its motif should be enriched in the open chromatin regions of a specific cell type; and (2) expression of the TF should be enriched in the same specific cell type, as determined by scRNA-seq or chromatin accessibility at the promoter and gene body from scATAC-seq. Using these criteria, we confirmed that the well-characterized TFs, such as NKX2-5, ETS1, and TCF21, which are essential for lineage-specific gene expression of CMs, ECs, and FBs, respectively, all showed motif enrichment in open chromatin regions of the corresponding cell types (Figure 2E). Also, these TFs showed preferential gene accessibility and gene expression patterns in the corresponding cell clusters (Figure 2E). These data validated our scRNA-seq and scATAC-seq datasets. In addition, for EBF1, we found its motif was enriched in the open chromatin regions of SMCs and pericytes (Figure 2E; Figure S2N). Although EBF1 function has not been previously characterized in these cell types, we found gene accessibility and expression of Ebf1 to be enriched in SMCs and pericytes (Figure 2E). These analyses further support the role of EBF1 as a potential transcriptional regulator in SMCs and pericytes. Together, these data revealed gene regulatory networks governed by cell-type-specific TFs, and uncovered previously unrecognized TFs with potential roles in cell-type-specific gene regulation.
To further determine the functional relevance of cell-type-specific open chromatin regions, we overlapped CM- and EC-specific open chromatin peaks with enhancers that showed heart- and blood-vessel-specific patterns, respectively, which were previously characterized by the VISTA Enhancer Browser (Visel et al., 2007). We found a large degree of overlap between VISTA enhancer elements with open chromatin peaks identified from scATAC-seq. Specifically, we identified 119 heart enhancers and 17 blood vessel enhancers from the VISTA Enhancer Browser that showed chromatin accessibility highly restricted to CMs or ECs, respectively (Table S3). These enhancers include hs389 and mm64, which showed high chromatin accessibility in CMs and drove reporter expression uniquely in the heart (Figures S3A and S3B) (Blow et al., 2010; Hashimoto et al., 2019). In addition, hs1653 and mm265 showed high chromatin accessibility in the EC lineages and drove reporter expression in blood vessels throughout the body, suggesting their role as pan-endothelial enhancers (Figures S3C and S3D). Together, these data validated the roles of the cell-type-specific open chromatin regions in driving cell-type-specific gene expression and uncovered numerous cis-regulatory elements with potential roles in transcriptional control.
Decoding Cell-Type-Specific Gene Regulatory Networks Underlying Regenerative and Non-regenerative Injury Responses
We next sought to investigate the cis-regulatory elements and their associated TFs that control the transcriptional responses of the three most abundant cardiac resident cell types: CM, EC, and FB in regenerative and non-regenerative hearts after MI. Comparing chromatin accessibility for each of these cell types between MI and age-matched sham control samples, we identified cis-regulatory elements that showed increased or decreased chromatin accessibility in CMs, ECs, and FBs after MI in P1 or P8 hearts (Figures 3A and 3B). Among the three cell types, FBs were identified with the greatest numbers of both MI-induced and MI-repressed regions in P1 and P8 hearts. In addition, we found more MI-responsive regions in FBs of P8 hearts compared with P1 hearts, suggesting pronounced open chromatin dynamics in FBs concurrent with cardiac remodeling (Figures 3A and 3B). We intersected the MI-induced open chromatin regions from the P1 and P8 hearts and identified cis-regulatory elements that were specific to P1, P8, or shared (Figure 3C). Motif analysis further revealed potential TFs that could bind to these regions and regulate target gene expression (Figure 3C). We further examined a few TFs with known functions in CM proliferation to validate the fidelity of the scATAC-seq data. For example, Tead3, a TF activated by the Hippo-Yap pathway, showed a decrease in open chromatin accessibility at the gene body region in CMs from P4 to P11 (Figure S3E). This finding is consistent with the downregulation of Tead3 expression and the decrease in cell-cycle activity of CMs during post-natal development (von Gise et al., 2012; Wang et al., 2019b; Xin et al., 2013). By chromVAR analysis, we found more CMs with high Tead3 motif enrichment in the P1+3 dpi sample compared with the P1+3 dps sample (Figure S3F). This is concordant with the reported increase in CM proliferation after MI in P1 hearts (Cui et al., 2020). In addition, both Gli1 and Mycn have been characterized as positive regulators of CM proliferation during neonatal heart regeneration, with preferential expression in P1 hearts compared with P28 hearts (Singh et al., 2018). Consistent with these findings, scATAC-seq of CMs showed a decrease in chromatin accessibility of Gli1 and Mycn genomic regions from P4 to P11 (Figures S3G and S3H). Motif analysis further revealed more CMs with high Mycn motif enrichment in open chromatin regions at P1+3 dpi than at P1+3 dps (Figure S3I). These data support the role of the Gli1-Mycn network in regulating CM proliferation and heart regeneration (Singh et al., 2018). Together, these analyses highlight the differences between accessible cis-regulatory elements in regenerative and non-regenerative hearts in response to MI and point to potential TFs that trigger the injury-induced gene regulatory network during neonatal heart regeneration and non-regenerative cardiac remodeling in different cell types.
Figure 3. Decoding Cell-Type-Specific Gene Regulatory Networks in Regenerative and Non-regenerative Injury Responses.
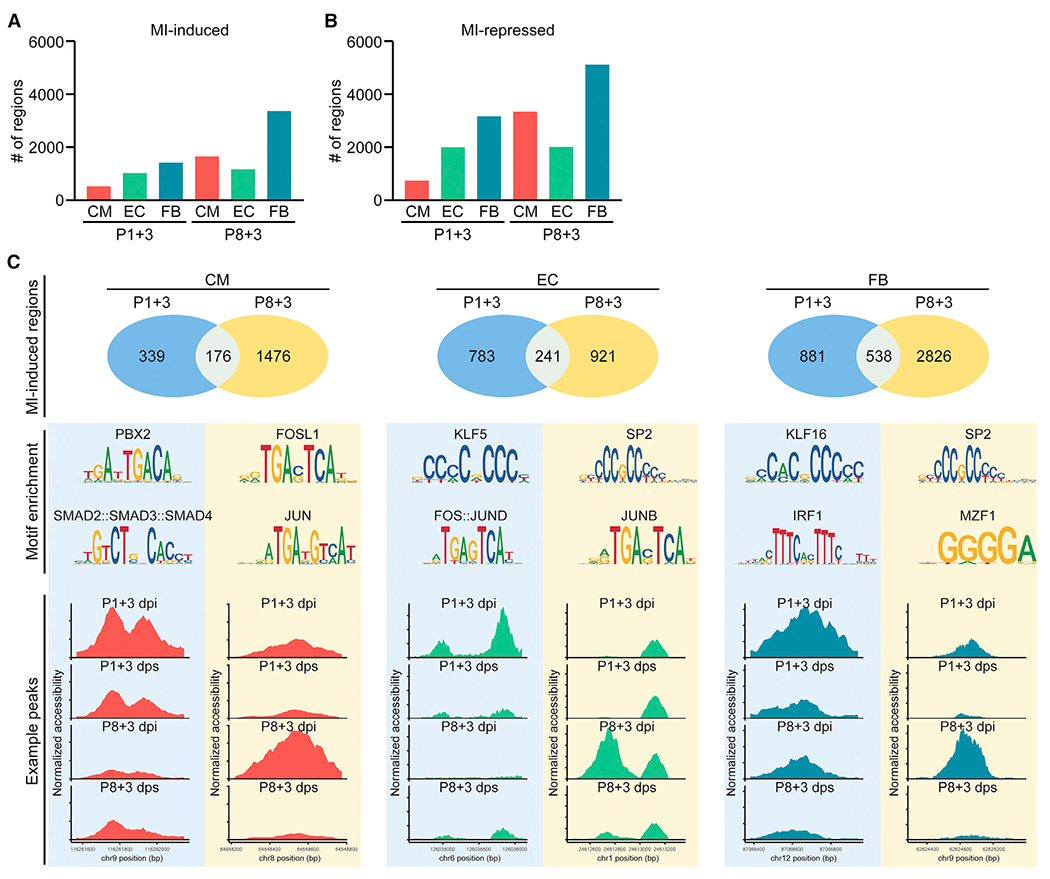
(A) Bar graph showing the number of MI-induced open chromatin regions in CM, EC, and FB at 3 days after P1 or P8 MI.
(B) Bar graph showing the number of MI-repressed open chromatin regions in CM, EC, and FB at 3 days after P1 or P8 MI.
(C) Differential accessibility analysis of scATAC-seq data revealed MI-induced open chromatin peaks from CMs (left column), ECs (middle column), and FBs (right column). Upper row: Venn diagrams showing the number of open chromatin regions that are induced upon MI and specific to P1 hearts, or P8 hearts, or shared, in CM, EC, or FB cell clusters. Middle row: top enriched motifs identified from open chromatin regions that are induced upon MI at P1 (left) or P8 (right). Bottom row: examples of injury-induced open chromatin peaks that are preferentially accessible in P1 (left) or P8 hearts (right) for CM, EC, or FB cell clusters.
See also Figure S3.
Distinctive Epicardial Response during Neonatal Heart Regeneration
To decipher the roles of different cell types and their injury-induced gene signatures, we integrated bulk RNA-seq with scRNA-seq to deconvolute cell-type-specific gene expression. Specifically, differential expression analysis was performed on bulk RNA-seq data, comparing post-MI hearts with age-matched post-sham hearts (Wang et al., 2019b). Expression of MI-enriched genes was then profiled in scRNA-seq data generated at a similar time point, and genes were further clustered based on the cell type in which they showed highest expression (Figure 4A). By this approach, we revealed the cellular origins of postinjury transcriptomic changes in regenerative and non-regenerative hearts (Figure 4B; Figures S4A–S4C; Table S4). We found epicardial cells contributed to a profound portion of MI-induced gene expression following injury of both regenerative and non-regenerative hearts (Figure 4B; Figures S4A–S4C). Especially at P1+1 dpi, 16% of the MI-enriched genes identified from bulk RNA-seq of the heart can be attributed to their expression in epicardial cells, even though epicardial cells compose only ~5% of total nonmyocytes at P1+1 dpi, highlighting the activation of epicardial genes during neonatal heart regeneration (Figure 4B). Comparison of epicardial-enriched, MI-induced genes at each time point further revealed a large number of genes that were specific to regenerative hearts, suggesting a distinct epicardial gene program during neonatal heart regeneration (Figure 4C). To identify the potential upstream regulators of the injury response in epicardial cells, we profiled TF binding motifs within the open chromatin regions associated with MI-induced epicardial genes at each time point from the scATAC-seq data. This analysis uncovered TF motifs that were preferentially enriched in cis-regulatory elements of epicardial MI-induced genes from P1 or P8 hearts, including the KLF14 motif specific to P1 and various FOS/JUN-related motifs enriched in P8, such as FOSL1, BACH2, and MAFK (Figure 4D; Figures S4D–S4F). Together, these data highlight the distinctive response of epicardial cells during neonatal heart regeneration at transcriptional and open chromatin levels.
Figure 4. Distinctive Epicardial Response during Neonatal Heart Regeneration.
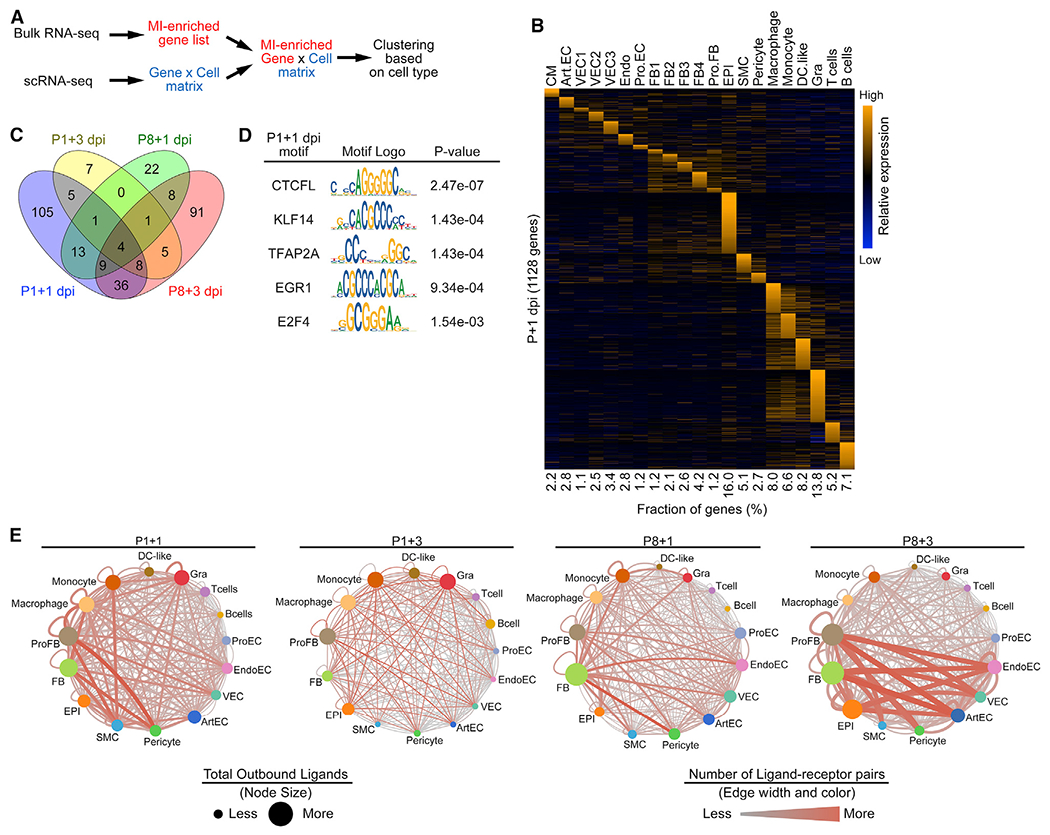
(A) Schematic illustration for the bioinformatics pipeline used to deconvolute bulk RNA-seq data using scRNA-seq data as a reference.
(B) Heatmap showing expression of cell-type-specific, injury-induced genes across different cell types in P1+1 dpi scRNA-seq data.
(C) Venn diagram showing numbers of epicardial injury-induced genes that are specific to or shared among P1+1 dpi, P1+3 dpi, P8+1 dpi, and P8+3 dpi time points.
(D) Table summarizing TF motifs enriched in open chromatin regions that are associated with epicardial-specific, MI-induced genes at P1+1 dpi.
(E) Injury-induced ligand-receptor interaction networks at P1+1 dpi (2,814 total interaction pairs), P1+3 dpi (474 total interaction pairs), P8+1 dpi (2,103 total interaction pairs), and P8+3 dpi (3,800 total interaction pairs). Size of the nodes denotes the total number of predicted ligand-receptor interactions initiated from the indicated cell types. The color and width of the lines connecting two nodes denote the number of predicted ligand-receptor interactions between connected cell types. The network illustrates the potentiality of cellular crosstalk events mediated by injury-induced ligand-receptor pairs but does not account for the anatomic position of different cell types.
To identify potential epicardial regulators of neonatal heart regeneration, we characterized epicardial genes that were specifically upregulated after MI in P1 neonates. Gene Ontology (GO) analysis for biological processes demonstrated that epicardial genes activated at P1+1 dpi were involved in pathways such as regulation of cellular responses to growth factor stimulus and extracellular structure organization (Figure S4G). In addition, GO analysis for cellular components indicated that 69 out of 148 epicardial genes activated at P1+1 dpi were predicted to encode proteins that localize to the extracellular space, suggesting their potential function as secreted factors (Figure S4H). Because many secreted factors serve as ligands for cell surface receptors, we superimposed MI-enriched genes at each time point with a dataset of genes encoding mouse ligand-receptor pairs (Ramilowski et al., 2015; Skelly et al., 2018) and constructed MI-induced cellular crosstalk networks for regenerative and non-regenerative hearts (Figure 4E; Table S5). These findings revealed numerous potential inter- and intra-cellular signaling events during the post-MI response in P1 and P8 hearts and identified several secreted epicardial factors and their target cell types for further analysis.
EC Heterogeneity in Neonatal Hearts
scRNA-seq analysis revealed that ECs in the neonatal heart are heterogeneous. We identified six clusters of ECs by unsupervised clustering: Art.EC, VEC1–3, Endo, and proliferating EC population (Pro.EC; Figure 5A). All six clusters displayed high expression of the EC marker genes Cdh5 and Pecam1, confirming their EC identify (Figure S5A). We identified genes enriched in each cluster using differential expression analysis (Figure 5B). Among them, Art.EC markers, including Fbln5 and Stmn2, were enriched in the Art.EC population (Figure 5C; Figure S5B) (Kalucka et al., 2020). An Endo cluster was also identified based on expression of the endocardial marker genes Npr3 and Nrg1 (Figure 5D; Figure S5C) (Artap et al., 2018; Zhang et al., 2016). in addition, we identified a Pro.EC marked by high expression of cell-cycle-related genes, such as Mki67 and Cenpa (Figure 5E; Figure S5D). Among the other three clusters of VECs (VEC1, VEC2, and VEC3), VEC3 resembles the overall gene signature of large venous ECs characterized by high expression of Plvap and Vwf (Figure S5E) (Kalucka et al., 2020). We did not observe high expression of Lcn2, another large venous EC marker previously identified from 8-week-old mice, in the VEC3 population (Figure S5E) (Kalucka et al., 2020). This is likely due to the immature features of these ECs in neonatal hearts. in contrast, VEC1 and VEC2 clusters exhibited higher expression of the capillary EC marker Gpihbp1 (Figure 5F), indicating their capillary EC identity. In addition, compared with VEC1, the VEC2 cluster had higher expression of genes involved in the regulation of reactive oxygen species and TNF signaling pathways, such as Cxcl1, Junb, Nfkbia, and Icam1 (Figure 5B; Figure S5F). These data highlight the EC heterogeneity in the neonatal mouse heart.
Figure 5. Endothelial Cell Heterogeneity in Neonatal Hearts.
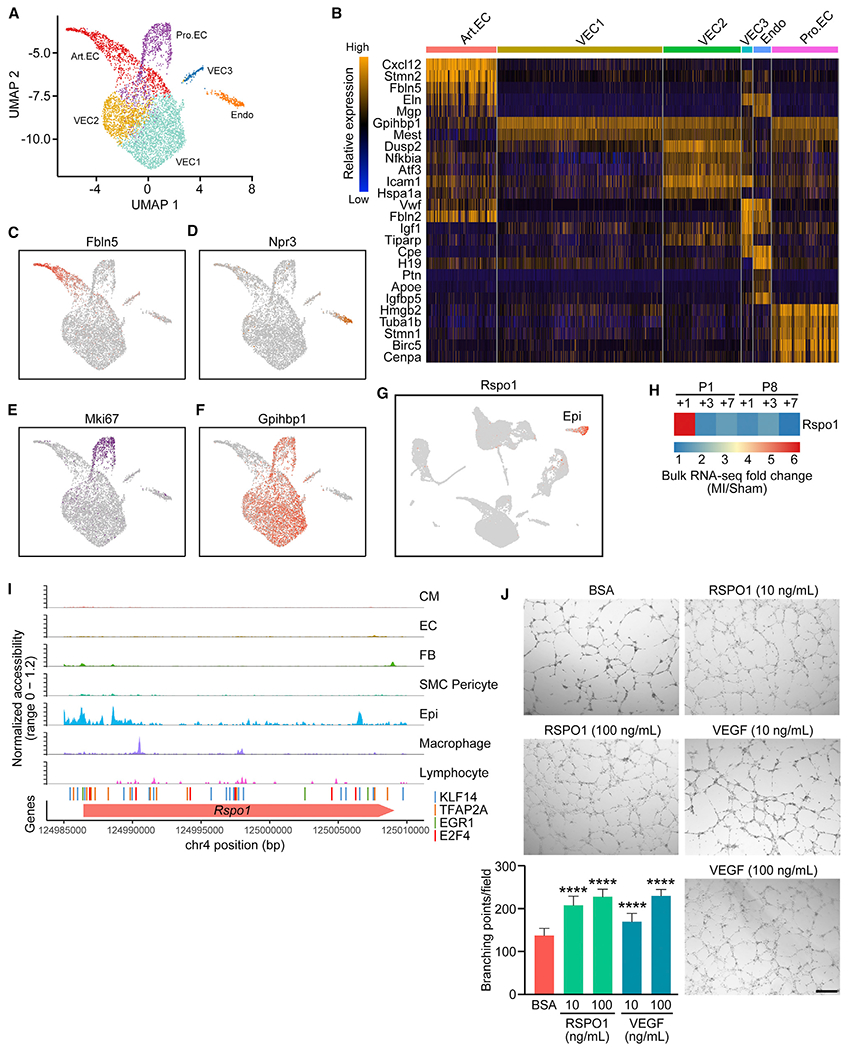
(A) UMAP representation of different EC sub-populations analyzed.
(B) Heatmap showing expression of top enriched genes for each EC sub-population.
(C–F) UMAP plots showing expression of Art.EC marker gene Fbln5 (C), endocardial marker gene Npr3 (D), cell-cycle-related gene Mki67 (E), and capillary EC marker gene Gpihbp1 (F) in ECs.
(G) UMAP plot showing expression of Rspo1 among all cells analyzed, which is restricted to the epicardial cell population.
(H) Heatmap showing fold induction of Rspo1 expression at various time points after P1 or P8 MI detected by bulk RNA-seq.
(I) scATAC-seq tracks showing open chromatin landscape of Rspo1 genomic region across various cell types. Positions of predicted KLF14 (blue), TFAP2A (orange), EGR1 (green), and E2F4 (red) binding sites from previous analysis (Figure 4D) are also shown.
(J) Representative images showing in vitro human umbilical cord VEC (HUVEC) tube formation after 8 h of 200 ng/mL bovine serum albumin (BSA) (negative control), 10 or 100 ng/mL recombinant RSPO1, or 10 or 100 ng/mL recombinant VEGF treatment, cultured in Matrigel, with quantifications showing the number of branching points per field under each treatment (n = 15 per each group; ****p < 0.0001). Scale bar, 500 μm.
See also Figure S5.
From the scATAC-seq data, we identified three subclusters of ECs (VEC, Endo, and Art.EC) based on open chromatin profiles. Among them, the VEC cluster showed high chromatin accessibility at the Gpihbp1 gene locus, reflecting the gene signature of VEC1 and VEC2 identified from scRNA-seq (Figure S2C). The Endo cluster displayed high chromatin accessibility at the Endo marker gene Npr3 locus, and the Art.EC cluster showed high accessibility at the arterial EC marker gene Fbln5 (Figures S2D and S2E). These findings are all consistent with gene expression features of these cell types. We further analyzed differentially accessible peaks among EC subclusters and identified numerous open chromatin regions that were specific to VEC, Endo, and Art.EC, highlighting the open chromatin heterogeneity of different EC subtypes in the neonatal mouse heart and potential cis-regulatory elements involved in EC cell-type maintenance (Figure S5G).
Epicardial RSPO1 Promotes Angiogenesis during Neonatal Heart Regeneration
From the ligand-receptor interaction network analysis, we identified R-Spondin 1 (RSPO1) as a reoccurring ligand for different EC subtypes from the regenerative heart. RSPO1, encoded by the Rspo1 gene, is a potent activator of the Wnt/beta-catenin signaling pathway (Binnerts et al., 2007). Expression of Rspo1 was restricted to epicardial cells (Figure 5G), and its receptors Lrp6 and Lgr4 were detected in various cell types in the heart, including ECs (Figure S5H) (de Lau et al., 2011). Bulk RNA-seq data showed that Rspo1 expression was highly upregulated at 1 day post-MI in P1 regenerative hearts, but not after MI in P8 non-regenerative hearts (Figure 5H) (Wang et al., 2019b). scA-TAC-seq uncovered the regulatory landscape at the Rspo1 locus, with open chromatin regions containing previously identified P1-enriched TF motifs specific to epicardial cells (Figure 5I).
Given the expression of Lrp6 and Lgr4 in ECs, we sought to determine whether Rspo1 could facilitate heart regeneration by promoting angiogenesis. Indeed, overexpression of Rspo1 using adenoviral delivery or recombinant RSPO1 protein treatment substantially enhanced tube formation ability of human umbilical cord VECs (HUVECs), evidenced by an increased number of branching points per field. These results were comparable with HUVECs treated with recombinant vascular endothelial growth factor (VEGF), a known angiogenic factor (Figure 5J; Figure S5I). Also, we did not observe a change in proliferation of neonatal rat ventricular CMs (NRVMs) treated with recombinant RSPO1, as measured by 5-ethynyl-2′-deoxyuridine (EdU) incorporation. Taken together, these data suggest that RSPO1 mediates the cellular crosstalk between epicardial cells and ECs and promotes the angiogenic ability of ECs during neonatal heart regeneration.
Cardiac FB Heterogeneity in Neonatal Hearts
Five clusters of cardiac FBs were identified from scRNA-seq analysis (Figure 6A). All of the FBs highly express the FB marker genes Postn and Col1a1 (Figure S6A). We identified specific genes that defined each cluster using differential expression analysis (Figure 6B) and compared the compositional dynamics of the FB subclusters between P1 and P8 hearts in response to MI (Figure 6C). Proliferating FBs (Pro.FBs) were identified based on high expression of cell-cycle-related genes, such as Hmgb2, Ube2c, and Cenpa (Figures 6B and 6D). The fraction of the Pro.FB population was highly elevated at P8+3 dpi (7.15%, compared with 0.72% at P8+3 dps) (Figure 6C), reflecting FB proliferation preceding the development of cardiac fibrosis, which is consistent with our previous immunofluorescent staining analysis showing elevated FB proliferation after MI at P8 (Wang et al., 2019b). Among the other four FB clusters (FB1–FB4), FB1 showed higher expression of genes involved in cell activation and cytokine production, including Cxcl1 and Ccl2 (Figures 6B and 6E). These findings are consistent with the previously reported gene signature of the injury response cardiac FBs (Forte et al., 2020). Additionally, we observed a subset of FB1 cells that express the myofibroblast marker genes Acta2 and Tagln at high levels and the quiescent FB marker gene Pdgfra at low levels (Figure S6B). These findings are consistent with documented myofibroblast gene profiles and mirror early steps of cardiac FB activation and differentiation to myofibroblasts (Forte et al., 2020; Fu et al., 2018). The increase of FB1 cells in response to injury (3.69% at P8+3 dps to 16.69% at P8+3 dpi) further highlights the FB1 population as injury-responsive cardiac FBs (Figure 6C). The FB2 cluster was marked by the expression of Dlk1 (Figure 6F), an inhibitor of myofibroblast differentiation (Rodriguez et al., 2019), as well as high expression of Pdgfra (Figure S6B), suggesting a gene signature of quiescent FBs. The FB3 population was marked by higher expression of Nov, Thy1, Pi16, Axl, and Cd34 (Figure 6G; Figure S6C). Interestingly, the FB3 gene signature resembled reported FB sub-populations in various tissues, including heart, lung, and pancreas, and may be associated with normal physiological functions of FBs (Farbehi et al., 2019; Forte et al., 2020; Hosein et al., 2019; Xie et al., 2018). The FB4 population was characterized by elevated expression of genes associated with extracellular matrix organization, such as Fbln5, Bgn, and Mfap (Figure 6H; Figure S6D), underscoring their role in regulating the extracellular environment of the heart. These data highlight the heterogeneity of FBs and the compositional changes of cell subtypes during the regenerative and non-regenerative injury responses of the heart.
Figure 6. Heterogeneous Fibroblast Populations in Injured and Uninjured Neonatal Hearts.
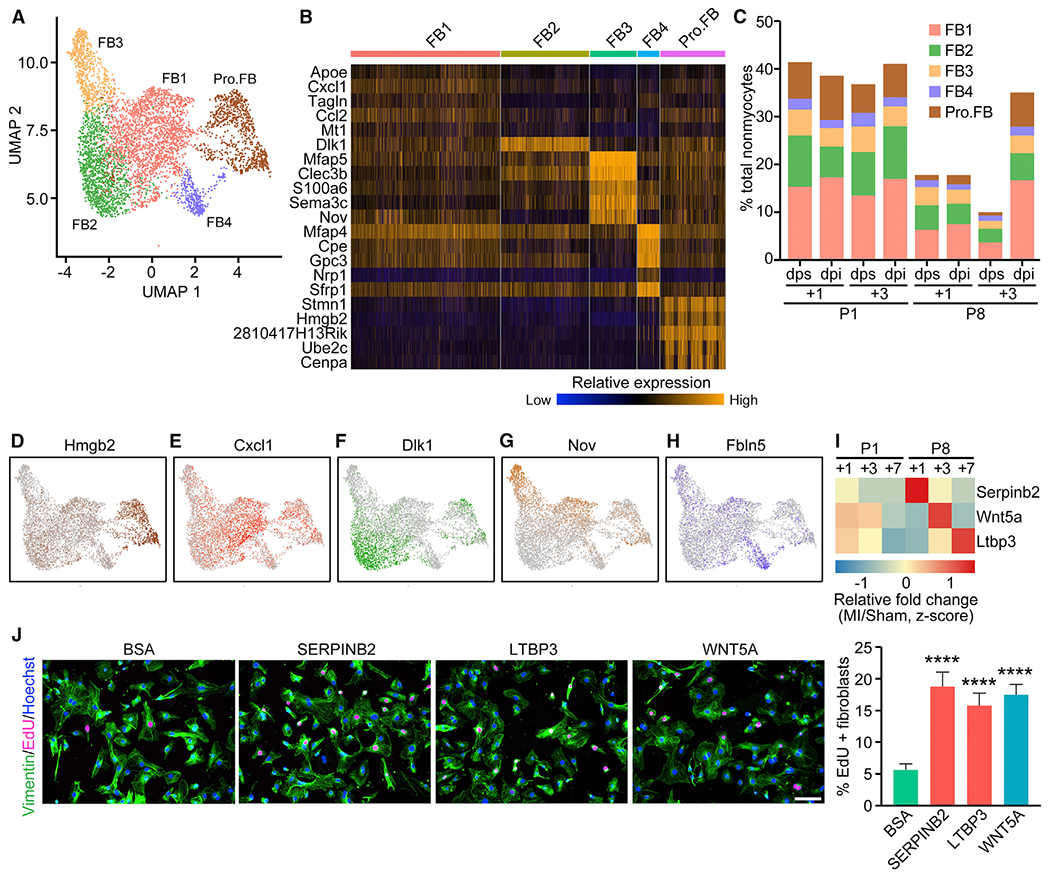
(A) UMAP representation of different FB sub-populations analyzed.
(B) Heatmap showing expression of top enriched genes for each FB sub-population.
(C) Percentage of each FB sub-population over total nonmyocytes within each sample.
(D–H) UMAP plots showing expression of Pro.FB-enriched gene Hmgb2 (D), FBI-enriched gene Cxcl1 (E), FB2-enriched gene Dlk1 (F), FB3-enriched gene Nov (G), and FB4-enriched gene Fbln5 (H).
(I) Heatmap showing relative fold induction (Z score) of Serpinb2, Wnt5a, and Ltbp3 expression at various time points after P1 or P8 MI detected by bulk RNA-seq.
(J) EdU incorporation (magenta) and vimentin immunofluorescent staining (green) of NRCF cells treated with 200 ng/mL BSA (negative control), 20 ng/mL recombinant SERPINB2, 100 ng/mL recombinant LTBP3, or 100 ng/mL recombinant WNT5A (positive control), with quantification showing the proportion of EdU-positive cells among vimentin-positive cells (fibroblasts) (n = 4 per each group; ****p < 0.0001). Scale bar, 100 μm.
See also Figure S6.
Epicardial Cells from Non-regenerative Hearts Secrete Pro-fibrotic Factors in Response to Injury
We observed upregulation of secreted factors in non-regenerative hearts following MI based on our epicardial analysis (Figure 4C). Because CMs in non-regenerative hearts are postmitotic, we reasoned that secreted epicardial factors from P8 hearts were less likely to contribute to CM proliferation, but instead may be involved in the non-regenerative injury response after MI, characterized by cardiac fibrosis. Thus, we selected a few secreted factors, including Serpinb2 (Serpin Family B Member 2), Wnt5a (WNT Family Member 5A), and Ltbp3 (Latent Transforming Growth Factor Beta Binding Protein 3), all of which were enriched in epicardial cells and showed highest upregulation in hearts at P8+1 dpi, P8+3 dpi, and P8+7 dpi, respectively, in our previously published bulk RNA-seq data (Figure 6I) (Wang et al., 2019b). WNT5A has been implicated in heart failure and cardiac fibrosis, and epicardial expression of Wnt5a has been validated in injured hearts (Abraityte et al., 2017; Działo et al., 2019; Mizutani et al., 2016). WNT5A has also been shown to promote lung FB proliferation (Vuga et al., 2009). The roles of SERPINB2 and LTBP3 in the post-MI injury response have not been previously investigated. Interestingly, our ligand-receptor interaction network analysis predicted that LTBP3 interacts with the Pro.FB population via its receptor ITGB5, suggesting a potential role in FB proliferation (Figure 4E; Table S5). Indeed, conditioned medium from 293A cells overexpressing individual factors substantially enhanced EdU incorporation in neonatal rat cardiac fibroblasts (NRCFs), indicating that these factors enhance FB proliferation (Figures S6E and S6F). Furthermore, recombinant SERPINB2 and LTBP3 also promoted EdU incorporation into NRCFs to a similar level as recombinant WNT5A (Figure 6J). Bioinformatics analysis also identified Tcf7, Fam180a, Angptl7, and Abi3bp as candidate genes encoding secreted factors from P8 hearts; however, these factors did not enhance EdU incorporation in the NRCF proliferation assay. Taken together, these findings indicate that the epicardial secreted factors SERPINB2, WNT5A, and LTBP3, which were upregulated in post-MI P8 hearts, promote cardiac FB proliferation, suggesting their role in cardiac fibrosis during cardiac remodeling of non-regenerative hearts.
Macrophage and Monocyte Heterogeneity in Neonatal Hearts
Macrophages comprised most of the immune-related cell types in all the samples analyzed. Subclustering analysis with higher resolution separated the macrophages into M1 and M2 subclusters (Figures 7A and 7B). The M1 subcluster expressed the M1 macrophage marker Cd86 at a high level (Figure 7C), whereas the M2 macrophage marker Arg1 was highly enriched in the M2 subcluster (Figure 7D). Monocytes displayed low expression of the mature macrophage marker Adgre1 and other macrophage markers, such as C1qa, C1qb, C1qc, and Maf (Figure S7A), and high expression of monocyte-enriched genes, including Plac8 and Itgal (Figure 7E; Figure S7B) (Zilionis et al., 2019). Furthermore, we identified a subcluster of monocytes that matched the gene signatures of M1 monocytes (M1Mos), which are enriched for expression of genes such as Ly6c2 and Ifitm6 (Figure 7F; Figure S7C) (Farbehi et al., 2019). DC-like cells were identified based on expression of Naaa, Napsa, and H2afy (Figure 7G; Figure S7D), which also matched the reported gene signature of DC-like cells (Skelly et al., 2018).
Figure 7. Heterogeneity and Distinct Injury Response of Immune Cells.
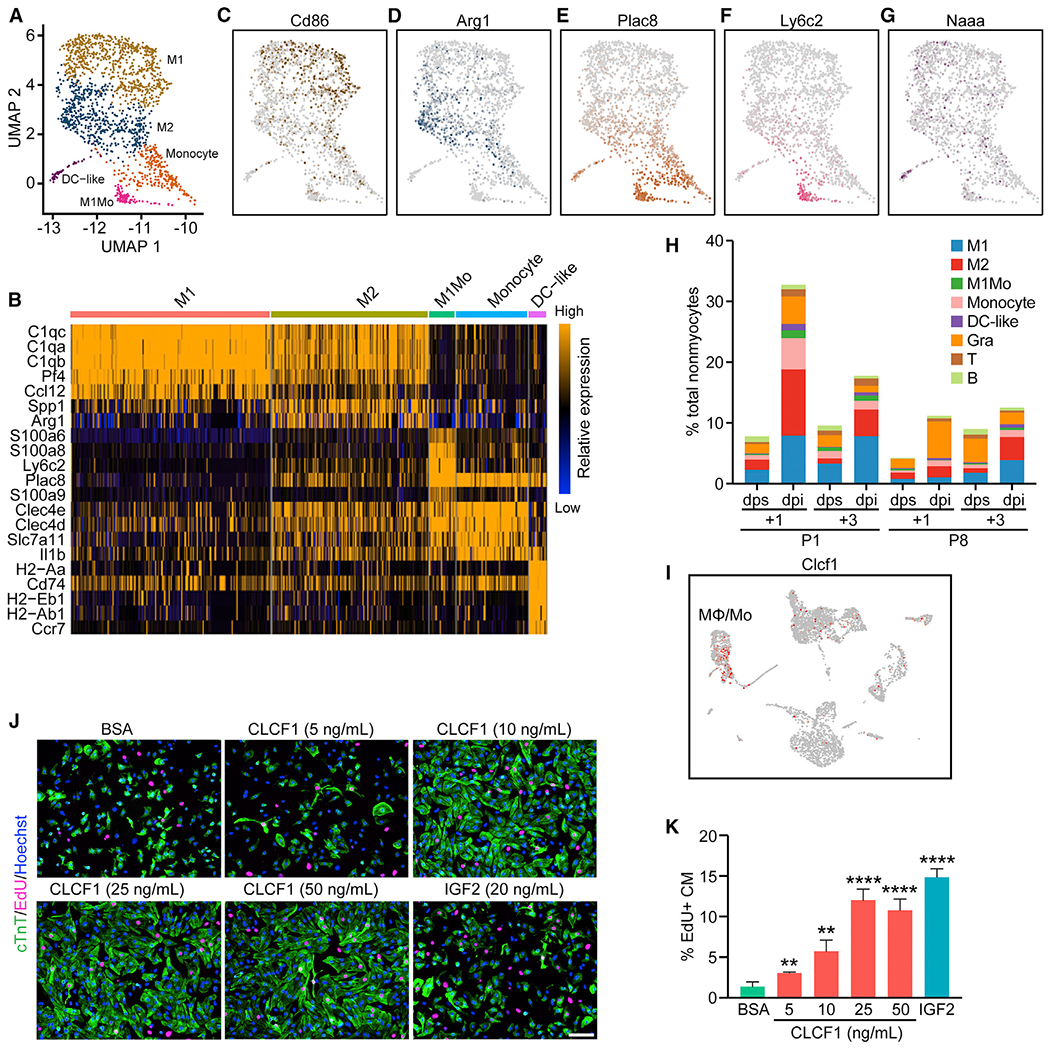
(A) UMAP representation of different myeloid cell populations analyzed.
(B) Heatmap showing expression of top enriched genes for each myeloid cell sub-population.
(C–G) UMAP plots showing expression of Cd86, an M1-macrophage marker gene (C); Arg1, an M2-macrophage marker gene (D); Plac8, a monocyte-enriched gene (E); Ly6c2, an M1 monocyte-enriched gene (F); and Naaa, a DC-like cell enriched gene (G).
(H) Percentage of each immune cell population over total nonmyocytes within each sample.
(I) UMAP plot showing expression of Clcf1 among different cell types present in the P1+1 dpi and dps scRNA-seq data.
(J) Representative images showing EdU incorporation (magenta) and cardiac troponin T (cTnT) immunofluorescent staining (green) of NRVM cells treated with 200 ng/mL BSA (negative control), 20 ng/mL recombinant insulin-like growth factor 2 (IGF2) (positive control), or different concentrations of recombinant CLCF1 (5, 10, 25, and 50 ng/mL). Scale bar, 100 μm.
(K) Quantification showing the proportion of EdU-positive cells among cTnT-positive cells (CM) after treatment of BSA, CLCF1 recombinant protein, or recombinant IGF2 (n = 4 per each group; **p < 0.01, ****p < 0.0001).
See also Figure S7.
Following MI injury, we observed increased percentages of macrophages and monocytes for all time points analyzed (Figure 7H). We noticed that P1 hearts showed higher percentages of macrophages and monocytes at 1 day post-MI, whereas P8 hearts showed higher percentages of macrophages and monocytes at 3 days post-MI, reflecting different dynamics of the neonatal immune response to cardiac injury. These findings are also consistent with our previous findings from bulk RNA-seq (Wang et al., 2019b). Furthermore, the M2 macrophage percentage sharply increased from 1.65% to 10.69% of total nonmyocyte composition at P1+1 dpi, and this degree of M2 macrophage infiltration was not observed at any other time points (Figure 7H). Because M2 macrophages secrete many anti-inflammatory cytokines and promote wound healing and tissue repair, this high degree of M2 macrophage infiltration likely supports neonatal heart regeneration, as also suggested by our prior macrophage ablation studies (Aurora et al., 2014).
The Macrophage Secreted Factor CLCF1 Enhances CM Proliferation
Immune cells are responsible for expressing the majority of MI-enriched genes identified by bulk RNA-seq based on deconvolution analysis (Figure 4B; Figures S4A–S4C). We further examined the macrophage and monocyte populations because they play key roles in processes associated with wound healing and tissue regeneration, such as debris clearance and secretion of cytokines that promote activation and/or proliferation of cells residing in the tissue (Aurora and Olson, 2014). Previously, we showed that macrophage/monocyte depletion blocked neonatal heart regeneration (Aurora et al., 2014). We also identified CCL24, a macrophage secreted factor specifically expressed after P1 MI, which can promote CM proliferation (Wang et al., 2019b). Thus, we decided to further investigate secreted factors from the macrophage and monocyte clusters that are specific to P1 hearts (Figure S7E). Among them, we found known regulators of CM proliferation, such as Areg and Ccl24 (Li et al., 2019; Wang et al., 2019b), and also found Clcf1 (Cardiotrophin Like Cytokine Factor 1) to be highly upregulated after P1 MI, but not after P8 MI (Figure S7E). Clcf1 expression was enriched in macrophages and monocytes of regenerative hearts (Figure 7I). Overexpression of Clcf1 using recombinant adenovirus significantly enhanced EdU incorporation into NRVMs, indicating enhanced proliferation (Figure S7F). In addition, we found that recombinant CLCF1 protein promoted NRVM proliferation in a dose-dependent manner (Figures 7J and 7K). Together, these data suggest that the macrophage/monocyte-enriched secreted factor CLCF1 promotes CM proliferation during neonatal heart regeneration.
DISCUSSION
In this study, we profiled gene expression and chromatin accessibility of neonatal hearts undergoing regenerative and non-regenerative injury responses at the single-cell level. We identified 22 different cell types using scRNA-seq and uncovered distinctive features from neonatal hearts in terms of cellular composition, signaling interactions, and transcriptome dynamics that contribute to heart regeneration. We also used scATAC-seq to characterize the gene regulatory networks that underpin neonatal heart regeneration. This work, together with our previous studies using transcriptome and epigenome profiling in bulk heart tissue (Wang et al., 2019b), as well as snRNA-seq of CMs (Cui et al., 2020), collectively provide a comprehensive molecular framework of neonatal heart regeneration at the resolution of single cells.
An Atlas of Single-Cell Transcriptomes during Neonatal Heart Regeneration
Previously, scRNA-seq analysis was performed on normal and injured adult mouse hearts to reveal cellular heterogeneity and gene expression profiles of nonmyocytes (Farbehi et al., 2019; Gladka et al., 2018; Martini et al., 2019; Skelly et al., 2018). However, the spectrum of nonmyocytes in the neonatal heart and their responses to injury have not been explored. Our findings provide insights into gene signatures of various sub-populations of FBs, ECs, and immune cells from the regenerative neonatal hearts following injury. Our detection of the cellular sub-populations at a finer resolution than has been achieved previously is likely due to the large number of cells we analyzed, the distinct features of these cells at the neonatal stage, and the unique transcriptional responses of these cells to injury. In addition, the anatomical location of an individual cell in the heart likely determines its transcriptional response to injury, which can further reflect the identity of the cellular subtypes. For example, FBs from the infarct region of the post-MI heart may display a different pattern of gene expression than those in the remote area. This notion is further supported by previous studies, which coupled scRNA-seq with immunohistochemistry and identified sub-populations of FBs in the infarct border zone and/or distal area in adult hearts post-MI (Farbehi et al., 2019; Forte et al., 2020). Indeed, some of the nonmyocyte sub-populations we identified, such as the FB1 and VEC2 populations, exhibited gene signatures that reflect an injury response and cell activation and may have a restricted anatomical localization in post-MI hearts that is not limited to the infarct area.
Droplet-based scRNA-seq methods provide unprecedented throughput to analyze gene expression profiles in individual cells; however, the sequencing depth within each cell is limited, which makes the differential expression analysis between two experimental conditions challenging. RNA-seq on bulk tissue, in contrast, allows identification of differentially expressed genes with subtle changes under high sequencing depth; however, it does not provide any cell-type resolution. In this study, we designed an innovative bulk RNA-seq deconvolution method using scRNA-seq as a reference, which integrated the strength of the two approaches, and identified cell-type-specific gene modules that are induced upon injury in regenerative and non-regenerative hearts. Injury-induced genes that are cell type specific can be mapped with high precision in this analysis. However, ubiquitously expressed injury-induced genes will be mapped to the cell type where they show highest expression, and their roles in other cell types may still be important. Another limitation is that this analysis does not take cellular composition into consideration. Based on this analysis, we found that epicardial cells and immune cells from the P1 heart contributed to more than half of the MI-upregulated genes detected from the bulk tissue, suggesting their key roles in mediating the regenerative injury response of the heart.
Regulation of Angiogenesis, CM Proliferation, and Fibrosis by Secreted Factors
Epicardial cells are involved in multiple biological processes of the heart, such as development, regeneration, and remodeling (Caoand Poss, 2018; Quijada et al., 2020). Previous studies using mouse epicardium-derived cells identified secreted factors, such as VEGFA and fibroblast growth factor 2 (FGF2), which were involved in the post-MI cardiac remodeling response of the adult heart (Zhou et al., 2011). Our single-cell analysis highlighted the roles of epicardial cells in the injury response of the heart. We showed that in P1 and P8 hearts, the injury-induced epicardial secretome was highly stage specific. RSPO1, an epicardial factor that was exclusively upregulated after MI at P1, was identified as an activator of angiogenesis. This was also supported by studies in zebrafish, where RSPO1/WNT signaling was shown to regulate angiogenesis via Vegfc/Flt4 (Gore et al., 2011). In sharp contrast, following injury of non-regenerative P8 hearts, epicardial cells express factors such as SERPINB2, WNT5A, and LTBP3, which are involved in extracellular matrix organization, WNT activation, and transforming growth factor-β (TGF-β) localization, all of which regulate FB proliferation (Rifkin, 2005; Tracy et al., 2016; Vuga et al., 2009). Furthermore, our ligand-receptor network analysis identified ITGB5, a known receptor of LTBP3, to be enriched in the proliferating sub-population of FBs, further supporting the role of LTBP3 in cardiac fibrosis (Ramilowski et al., 2015). Taken together, our data suggest that epicardial cells and their secreted factors may represent therapeutic targets to prevent pathological cardiac fibrosis.
We also identified the neonatal-specific, macrophage-secreted CLCF1 as a potent activator of CM proliferation in vitro, highlighting the distinct injury response of macrophages and CMs of the neonatal heart. CLCF1 is an activator of the JAK/STAT3 signaling pathway, and genetic deletion of CLCF1 results in neonatal lethality as a result of a motor neuron-related suckling defect (Alexander et al., 1999; Sims, 2015). The mechanism by which secreted CLCF1 enhances CM proliferation remains to be defined, and further studies are needed to demonstrate whether CLCF1 can promote CM proliferation in vivo and provide therapeutic benefits after MI in adulthood.
Regulatory Landscapes of Single Cells in Regenerative and Non-regenerative Hearts
The recent emergence of scATAC-seq technology has revolutionized the throughput and resolution of identifying cis-regulatory elements in the genome (Buenrostro et al., 2015; Li et al., 2020; Mezger et al., 2018; Preissl et al., 2018). scATAC-seq has been used to characterize the transition and lineage settlement of Isl1+ cardiac progenitor cells (Jia et al., 2018). The scATAC-seq study performed here provides an unbiased single-cell open chromatin atlas of the neonatal heart and broadens our knowledge of the dynamic changes in chromatin accessibility in CMs, as well as nonmyocytes, during neonatal heart regeneration. Cell-type clustering analysis based on open chromatin profiling was highly consistent with that obtained from single-cell expression profiling, which allowed us to accurately link gene expression with accessibility of potential cis-regulatory elements. We validated the cell-type-specific enhancers identified from the scATAC-seq analysis in vivo, using transgenic embryos carrying individual candidate enhancers linked to a lacZ reporter, characterized by the VISTA Enhancer Browser. In addition, we identified candidate injury-induced enhancers and key TFs from the major cardiac cell types in P1 and P8 hearts, which contributed to the regenerative and non-regenerative gene regulatory networks.
In conclusion, this study constructed a comprehensive database documenting single-cell gene expression and open chromatin landscapes at different stages after cardiac injury in regenerative and non-regenerative hearts. Our work uncovered cellular composition features, potential intercellular signaling crosstalk, gene expression patterns, and cis-regulatory logic that provide the foundation for neonatal heart regeneration. These data can also benefit the broad heart community as a single-cell reference to study cardiac development, homeostasis, and disease and the transcriptional regulation behind these processes.
STAR★METHODS
RESOURCE AVAILABILITY
Lead Contact
Further information and requests for resources and reagents should be directed to and will be fulfilled by the Lead Contact, Eric Olson (Eric.Olson@UTSouthwestern.edu).
Materials Availability
All unique reagents generated in this study are available from the Lead Contact upon request.
Data and Code Availability
All data, including raw sequencing data and processed data, have been deposited in the Gene Expression Omnibus (https://www.ncbi.nlm.nih.gov/geo/) under the superseries GSE153481. The accession number for the scRNA-seq data reported in this study is GSE153480. The accession number for the scATAC-seq data reported in this study is GSE153479. The code generated during this study are available from the Lead Contact upon request.
EXPERIMENTAL MODEL AND SUBJECT DETAILS
Experimental Animals
Animal work in this manuscript has been approved and conducted under the oversight of the UT Southwestern Institutional Animal Care and Use Committee. Timed-pregnant ICR/CD-1 mice (Charles River Laboratories) were used to deliver pups for surgical procedures on postnatal day 1 or 8. The day of birth is considered P1. Neonatal Sprague-Dawley rats (Envigo) were used to isolate neonatal rat ventricular cardiomyocytes (NRVMs) and neonatal rat cardiac fibroblasts (NRCFs). Animals were housed in a 12 h light/dark cycle in a temperature-controlled room in the Animal Research Center of UT Southwestern, with ad libitum access to water and food. The ages of mice are indicated in the figure legends or methods. Sex was not determined for neonatal pups in the study.
Cell Lines and Cell Culture
All cells were cultured at 37°C with 5% CO2. Neonatal rat ventricular myocytes (NRVMs) and neonatal rat cardiac fibroblasts (NRCFs) were isolated from 1- or 2-day-old Sprague-Dawley rats with the Isolation System for Neonatal Rat/Mouse Cardiomyocytes (Cellutron, nc-6031) according to the manufacturer’s protocol. NRVMs were cultured in Dulbecco’s modified Eagle’s medium (DMEM) (Sigma, D5796)/199 medium (GIBCO, 11150-059) (3:1) with 3% fetal bovine serum (FBS) (Gemini Bio Products, 100-106), and 1% penicillin-streptomycin (Sigma, P0781). NRCFs were cultured in DMEM/F-12 medium (Sigma, D8437) with 10% FBS, 1% penicillin-streptomycin, and 20 ng/mL FGF (Cell Signaling Technology, 5414LC). Adeno-X 293 cells (Clontech, 632271) and 293A cells (Invitrogen, R70507) were cultured in DMEM with 10% FBS, and 1% penicillin-streptomycin. Human umbilical vein endothelial cells (HUVECs) (ATCC, PCS-100-010) were cultured in EGM-2 Endothelial Cell Growth Medium-2 (Lonza, CC-3162).
METHOD DETAILS
Neonatal MI
Neonatal MI was performed as previously described (Porrello et al., 2013; Wang et al., 2019b). Neonatal mice were anesthetized by hypothermia on an ice bed, as described in Porrello et al. (2011). Lateral thoracotomy at the fourth intercostal space was performed by blunt dissection of the intercostal muscles after skin incision. A tapered needle attached to a non-absorbable 8-0 suture (PROLENE, Ethicon) was passed through the midventricle below the origin of the LAD coronary artery and tied to induce infarction. After LAD ligation, neonates were removed from the ice bed, thoracic wall incisions were sutured with a 7-0 non-absorbable suture (PROLENE, Ethicon), and the skin wound closed by using skin adhesive. Sham-operated mice underwent the same procedure involving thoracotomy without LAD ligation.
Single cell RNA-Sequencing of Neonatal Mouse Hearts
For each scRNA-seq sample, 8-12 ventricular samples collected from the same litter were pooled together, minced with a razor blade, and digested in digestion buffer (2.7 mM KCl, 137 mM NaCl, 1.8 mM KH2PO4, 10 mM Na2HPO4, 20 mM HEPES, 0.5 mM MgCl2, 1 mM CaCl2, 5.5 mM glucose, pH = 7.4) with 0.75% Collagenase/Dispase (Roche, 11097113001) at 37°C in a beaker for 60 min (or until tissue was fully digested), with gentle agitation using a magnetic stir bar set to 125 rpm. Cell suspension was sequentially filtered through 70 μm and 40 μm cell strainers (Falcon, 352350 and 352340), and centrifuged at 500 x g for 5 min. Cell pellet was resuspended with PBS and treated with RBC lysis buffer (Biolegend, 420301) to remove red blood cells. Cells were then washed with PBS twice, resuspended with 0.04%BSA/PBS, filtered through a 40 μm Flowmi cell strainer (Bel-Art, H13680-0040), and counted with a Countess II automated cell counter (Invitrogen).
Single cell RNA-seq libraries were generated using Single Cell 3′ Reagent Kits v2 (10xGenomics) according to the manufacturer’s protocol. Quality control of sequencing libraries were performed on the Agilent Tapestation with D1000 screentapes (Agilent, 5067-5582), and library yield was quantified by Qubit DNA high sensitivity assay. Sequencing was performed on an Illumina Nextseq 500 system operated by the Next Generation Sequencing Core of Children’s Research Institute at UT Southwestern, with the following pair-end sequencing settings: Read1 - 26 cycles, i7 index - 8 cycles, Read2 - 49 cycles.
Single cell ATAC-Sequencing of Neonatal Mouse Hearts
For each scATAC-seq sample, 8-12 ventricular samples collected from the same litter were pooled together, minced with a razor blade, and treated with 1x RBC lysis buffer (Biolegend, 420301) for 3 min. After 500 x g centrifugation for 5 min, the pellet was resuspended in 5 mL Lysis Buffer [320 mM sucrose, 10 mM Tris-HCl, 5 mM CaCl2, 5 mM Magnesium Acetate, 2 mM EDTA, 0.5 mM EGTA, 1 mM DTT, 1x cOmplete protease inhibitor (Roche), 200U/mL RNase OUT Recombinant Ribonuclease Inhibitor (Invitrogen, 10777-019), pH = 8] and homogenized with adounce grinder for 15 strokes. The lysate was sequentially passed through 70 μm and 40 μm cell strainers (Falcon, 352350 and 352340) and centrifuged at 1,000 x g for 5 min at 4°C to pellet nuclei. The nuclear pellet was subsequently resuspended in 2 mL Sucrose Buffer (1 M sucrose, 10 mM Tris-HCl, 5 mM magnesium acetate, 1mM DTT, 1x complete protease inhibitor, 200 U/mL RNase OUT Recombinant Ribonuclease Inhibitor, pH = 8) and the suspension was cushioned on top of 4 mL Sucrose Buffer, followed by centrifugation at 1,000 x g for 5 min at 4°C to pellet nuclei. The nuclear pellet was subsequently washed with 2% BSA/PBS twice, filtered through a 40 mm Flowmi filter and resuspended in 1x Nuclei buffer (10xGenomics), and counted with a Countess II automated cell counter (Invitrogen).
Single cell ATAC-seq libraries were generated using Chromium Next GEM Single Cell ATAC Library & Gel Bead Kit v1.1 (10xGenomics) according to the manufacturer’s protocol. Quality control of sequencing libraries were performed on the Agilent Tapestation with D1000 screentapes (Agilent, 5067-5582), and library yield was quantified by Qubit DNA high sensitivity assay. Sequencing was performed on an Illumina Nextseq 500 system operated by the Next Generation Sequencing Core of Children’s Research Institute at UT Southwestern, with the following pair-end sequencing settings: Read1 - 70 cycles, i7 index - 8 cycles, i5 index – 16 cycles, Read2 - 70 cycles.
Immunohistochemistry
Immunohistochemistry analysis was performed as previously described (Wang et al., 2019b). The following antibodies were used at indicated dilutions: cardiac troponin T (cTnT) monoclonal antibody (Invitrogen, MA5-12960, 1:200), mesothelin (Msln) polyclonal antibody (LSBio, LS-C407883, 1:500), F4/80 monoclonal antibody (Cell Signaling Technology, #70076S, 1:250).
NRVM Proliferation Assay
NRVMs were plated at a density of 3 × 10⁵ cells/well of gelatin-coated 12-well plates. Recombinant human CLCF1 protein (R&D Systems, 962-CL-050), recombinant human RSPO1 protein (Abcam, ab134626) and recombinant mouse IGF-2 protein (R&D Systems, 792-MG-050) were reconstituted in 0.1% BSA/PBS. Before recombinant protein treatment, NRVMs were starved in serum-free medium (DMEM/199 medium) for 24 h, and cultured in serum-free medium throughout the experiment. NRVMs were treated with recombinant proteins at the indicated final concentration for 24 h, followed by treatment with 10 μM EdU (Lumiprobe, 10540) in serum free medium with recombinant proteins for an additional 24 h. Immunostaining and image analysis were performed as previously described (Wang et al., 2019b).
Mouse Clcf1 cDNAor Rspo1 cDNA was cloned into the pAdx-CMV vector using In-Fusion cloning kit (Takara, 638910) and adenovirus was packaged using Adeno-X Adenoviral System 3 (Clontech, 632268). GFP adenovirus (Ad-GFP) (Vector Biolabs, 1060) was used as the negative control. For assessing NRVM proliferation, NRVMs were serum starved for 24 h and infected with Ad-GFP, Ad-Clcf1, or Ad-Rspo1 at the titer of 200 MOI in serum free medium. At 24 h post infection, medium was changed to fresh, serum-free culture medium with 10 μM EdU for 24 h EdU labeling. Staining and image analysis were performed as previously described (Wang et al., 2019b).
NRCF Proliferation Assay
NRCFs were plated at a density of 2 × 10⁵ cells/well into 12-well plates, and starved in serum-free medium (DMEM/F12) for 24h before the proliferation assay.
For proliferation assay using conditional medium, 293A cells were transfected with plasmids that overexpress mouse Serpinb2, Ltbp3 or Wnt5a with C’ terminal 3xFLAG tag from a pcDNA3.1 backbone driven by the CMV promoter. Cell culture medium was changed to serum-free DMEM/F12 medium at 24 h post transfection. Medium was collected and replaced at 24 h and 60 h post the first medium change, respectively, and passed through a 0.45 μm filter (Corning, 431220) to be used as conditioned medium. Expression of these factors in the conditional medium as well as in the cell lysate was examined using western blotting with the following antibodies: anti-FLAG M2 mouse monoclonal antibody (Sigma, F3165, 1:1,000), and anti-GAPDH (Millipore, MAB374, 1:10,000). Pre-starved NRCFs were treated with the conditional medium for 36 h, followed by treatment with conditional medium with 10 μM EdU for additional 12 h. After labeling, cells were fixed with 4% PFA for 10 min at room temperature, and EdU staining was performed as mentioned above. Immunofluorescent staining was performed as above described using rat monoclonal anti-vimentin antibody (R&D systems, MAB2105, 1:200) and Alexa Fluor 488 conjugated goat anti-rat secondary antibody (Invitrogen, A11006, 1:500). Nuclei were counter-stained with Hoechst. Imaging was performed on a Keyence BZ-X700 microscope. At least four fields at 20x magnification were captured for each well. Quantification was carried out by counting the proportion of EdU+/vimentin+ cells over vimentin+ cells from the immunofluorescent staining images. This value was compared to that of the negative control.
For proliferation assay using recombinant proteins, NRCFs were pre-starved and treated with 20 ng/mL recombinant human SERPINB2 (R&D Systems, 9206-PI-025), 100 ng/mL recombinant human LTBP3 (Origene, TP326379), or 100 ng/mL recombinant human WNT5A (Abcam, ab204627) in serum-free DMEM/F12 medium for 36 h, followed by treatment with medium containing recombinant proteins and 10 μM EdU for additional 12 h. After labeling, cells were fixed with 4% PFA for 10 min at room temperature, followed by EdU and vimentin immunofluorescent staining as described above. Imaging and data analysis were performed as mentioned above.
Endothelial Cell Tube Formation Assay
For EC tube formation assay using recombinant proteins, HUVECs were starved with EC-basal medium-2 (EBM-2) from the EGM-2 bulletkit (Lonza, CC-3162) with 0.1% FBS for 12 hours, and seeded on the Growth Factor Reduced Matrigel Matrix (Corning, 354230) in 12-well plates at the density of 5 × 10⁴ cells/well, and treated with 200 ng/mL BSA (negative control), 10 ng/mL or 100 ng/mL recombinant human RSPO1 (Abcam, ab134626), or 10 ng/mL or 100ng/mL recombinant human VEGF 165 (positive controls) (R&D Systems, 293-VE-050) prepared in EBM-2/0.1% FBS medium for 8 h. Imaging was performed on a Keyence BZ-X700 microscope. At least four fields at 4x magnification were captured for each well. Quantification was carried out by counting the number of branching points per each 4x image, and compared to that of the negative control. For EC tube formation assay using adenovirus, HUVEC cells were infected with Ad-YFP (Clontech) or Ad-Rspo1 at the titer of 100 MOI in EGM-2 complete medium for 48 h, starved with EBM-2/0.1% FBS medium for 12 h, and seeded to Matrigel at the density of 5 × 10⁴ cells/well. Imaging analysis was performed at 8 h post seeding as previously described.
Analysis of the scRNA-seq Data
Raw scRNA-seq data were demultiplexed using cellranger mkfastq from the Cell Ranger software suite (v2.1, 10x Genomics) to generate fastq files. Demultiplexed fastq files were aligned to the mouse mm10/GRCm38 reference transcriptome and gene expression matrix was counted using cellranger count program. Downstream bioinformatic analysis was performed in R using the package Seurat (v3.1.4) (Butler et al., 2018; Stuart et al., 2019). A cutoff was applied to filter out low-quality cells based on the number of genes detected, the number of UMI detected, and mitochondrial gene content per each cell, as detailed in Table S1. Data from all samples were combined, scaled by regressing out the nUMIs and percentage of mitochondrial gene expression, and integrated using canonical correlation analysis (CCA) implemented in the Seurat package. Dimensional reduction of the data was performed by RunUMAP function implemented in the Seurat package, using Uniform Manifold Approximation and Projection (UMAP) algorithm. Unsupervised cluster identification was performed via the FindClusters function based on a graph-based clustering algorithm implemented in Seurat, and cell clusters were further annotated based on expression of known marker genes. Red blood cell cluster (Hbb-bt and Hba-a1 high) was removed from the dataset. Identification of enriched genes in cell clusters and single cell differential expression analysis were performed using Seurat functions FindMarkers and FindAllMarkers, using gene expression detected in > 25% of cells for at least one of the populations being compared, with an absolute log2 fold change > 0.25 as cutoff threshold. Differentially expressed genes were ranked by fold change, and genes with highest fold change (top enriched genes) were used for heatmap plotting using Seurat function DoHeatmap.
Lineage Deconvolution of the Bulk RNA-seq Data
Average expression of genes across all the cell types detected by the scRNA-seq data from each time point was calculated using Seurat function AverageExpression, which was used as a reference dataset for query. Bulk RNA-seq data were obtained and analyzed as described in Wang et al. (2019b), which identified genes that are induced upon MI with FC > 2 and FDR < 0.01. The expression of these MI-induced genes across different cell types was queried in the reference dataset generated at the similar time point, and scaled by z-score transformation. Further, genes were grouped and ranked based on the cell type they showed the highest z-score, identifying modules of MI-induced genes and the cell type with the highest expression of certain gene modules. The transformed data were used to generate heatmaps to highlight cell type-specific MI-induced gene modules after deconvolution. Due to the low number of genes mapped to glial cells and their low abundance in all the samples, we removed glial cells from this analysis. Gene ontology analysis was performed using Metascape (Zhou et al., 2019). Venn diagram for epicardial genes was generated using Venny (v2.1, https://bioinfogp.cnb.csic.es/tools/venny/).
Analysis of the Ligand-Receptor Interaction Network
The mouse ligand-receptor pairs were derived from a human ligand-receptor pair database, as described in Ramilowski et al. (2015) andSkelly et al. (2018). We kept ligand-receptor pairs that either the ligand or the receptor showed increased expression after MI, and filtered out the ligand-receptor pairs that neither genes show increased expression after MI for each time point, determined by bulk RNA-seq. Next, the cell types that highly express the ligand and receptor genes were determined using the above described lineage deconvolution pipeline, and the corresponding cell type(s) matched to a ligand or receptor gene is determined as the cell type(s) with a z-score transformed relative expression > 1 at the given time point. We removed CM and glial cells from this analysis due to the low coverage of these cells and the resulted bias that could be introduced to the ligand-receptor mapping. Total number of the potential ligand-receptor interaction events was quantified between each cell type and visualized using Cytoscape (v3.6.0) (Shannon et al., 2003).
Analysis of the scATAC-seq Data
Raw scATAC-seq data were demultiplexed using cellranger-atac mkfastq from the Cell Ranger ATAC software suite (v1.2.0, 10x Genomics) to generate fastq files. Demultiplexed fastq files were aligned to the mouse mm10 reference genome to generate single cell accessibility counts using cellranger-atac count program for each sample. All samples were then combined using cellranger-atac aggr for peak calling and counting in a consistent and meaningful manner. Downstream bioinformatic analysis was performed in R using the package Seurat (v3.1.4) and Signac (v0.2.5) (Butler et al., 2018; Stuart et al., 2019). For quality control, we removed cells with < 5,000 or > 40,000 nUMI, cells with > 5% reads mapped to blacklist regions, and cells with TSS enrichment score < 2. We also performed term frequency-inverse document frequency (TF-IDF) normalization for all samples. We used data integration algorithm implemented in Seurat3 to identify “integration anchors” and integrated all the samples to remove batch effects. UMAP dimensional reduction was performed on the scaled data using Seurat function RunUMAP. Cell clusters were identified using Seurat function FindClusters. A gene activity matrix was generated from reads mapped to gene body and promoter (upstream 2kb from the TSS), to facilitate cluster annotation by examining activity of cell type-specific marker gene activity. After cluster identification, we further removed a few clusters which are composed of few cells with no positive marker gene enriched, likely representing cell-cell multi-plets. Open chromatin peaks specific to cell clusters were identified using Seurat function FindAllMarkers. Differentially accessible peaks were calculated using Seurat function FindMarkers. Selected images of transgenic mouse embryos carrying heart and blood vessel enhancers, which overlapped with CM and EC-specific cis-regulatory elements and were previously characterized as part of the collection of VISTA Enhancer Browser, were used with permission.
Transcription Factor Motif Enrichment Analysis
Aper-cell motif activity score was calculated using chromVAR (Schep et al., 2017) to visualize motif activity per cell and identify differentially active motifs among cell types. Motif enrichment analysis for M1-induced open chromatin regions identified from scATAC-seq data was performed using FindMotifs function implemented in Signac. For motifs associated with M1-induced epicardial genes, open chromatin regions that were present in epicardial cells were identified from the combined dataset. Genomic coordinates of epicardial open chromatin regions were analyzed using ClosestFeature function from Signac package to annotate the predicted target genes of the open chromatin regions. Lists of epicardial induced genes at each time point, as identified using lineage deconvolution algorithm described previously, were intersected with the epicardial open chromatin region list, to identify epicardial open chromatin regions associated with epicardial induced genes. Motifs enriched in open chromatin regions associated with epicardial gene induction were then analyzed using FindMotifs function from Signac package.
QUANTIFICATION AND STATISTICAL ANALYSIS
Statistical analyses were performed using GraphPad Prism 8 (GraphPad Software, Inc.) using a two-tailed unpaired t test, with p < 0.05 considered significant, unless otherwise indicated. Statistical details of experiments can be found in the figures and figure legends. All data are displayed as mean ± SD unless otherwise indicated.
Supplementary Material
KEY RESOURCES TABLE
| REAGENT or RESOURCE | SOURCE | IDENTIFIER |
|---|---|---|
| Antibodies | ||
| Mouse Anti-Cardiac Troponin T Monoclonal Antibody (13-11) | Invitrogen | Cat#MA5-12960; RRID:AB_11000742 |
| Rabbit Anti-Mesothelin Polyclonal Antibody | LSBio | Cat#LS-C407883 |
| Rabbit Anti-F4/80 Polyclonal Antibody | Cell Signaling Technology | Cat#70076; RRID:AB_2799771 |
| Mouse Anti-FLAG M2 Monoclonal Antibody | Sigma | Cat#F3165; RRID:AB_259529 |
| Mouse Anti-GAPDH Monoclonal Antibody | Millipore | Cat#MAB374; RRID:AB_2107445 |
| Rat Anti-Vimentin Monoclonal Antibody | R&D Systems | Cat#MAB2105; RRID:AB_2241653 |
| Goat Anti-Mouse IgG (H+L) Highly Cross-adsorbed Secondary Antibody, Alexa Fluor 488 Conjugated | Invitrogen | Cat#A11029; RRID:AB_138404 |
| Goat anti-Rat IgG (H+L) Cross-Adsorbed Secondary Antibody, Alexa Fluor 488 Conjugated | Invitrogen | Cat#A11006; RRID:AB_2534074 |
| Goat Anti-Rabbit IgG (H+L) Cross-adsorbed Secondary Antibody, Alexa Fluor 555 Conjugated | Invitrogen | Cat#A21428; RRID:AB_141784 |
| Bacterial and Virus Strains | ||
| Stellar Competent Cells | Takara | Cat#636766 |
| Ad-GFP | Vector Biolabs | Cat#1060 |
| Ad-Clcf1 | This paper | N/A |
| Ad-Rspo1 | This paper | N/A |
| Chemicals, Peptides, and Recombinant Proteins | ||
| Dulbecco’s Modified Eagle’s Medium - high glucose | Sigma | Cat#D5796 |
| Medium 199, Earle’s Salts | GIBCO | Cat#11150-059 |
| Dulbecco’s Modified Eagle’s Medium/Nutrient Mixture F-12 Ham | Sigma | Cat#D8437 |
| Fetal Bovine Serum | Gemini Bio Products | Cat#100-106 |
| Penicillin-Streptomycin | Sigma | Cat#P0781 |
| EGM-2 Endothelial Cell Growth Medium-2 | Lonza | Cat#CC-3162 |
| Mouse Basic Fibroblast Growth Factor | Cell Signaling Technology | Cat#5414LC |
| Collagenase/Dispase | Roche | Cat#11097113001 |
| RBC Lysis Buffer | Biolegend | Cat#420301 |
| RNaseOUT Recombinant Ribonuclease Inhibitor | Invitrogen | Cat#10777019 |
| cOmplete Protease Inhibitor Cocktail | Roche | Cat#11697498001 |
| Recombinant human CLCF1 protein | R&D Systems | Cat#962-CL-050 |
| Recombinant human RSPO1 protein | Abcam | Cat#ab134626 |
| Recombinant mouse IGF-2 protein | R&D Systems | Cat#792-MG-050 |
| EdU (5-ethynyl-2′-deoxyuridine) | Lumiprobe | Cat#10540 |
| Sulfo-Cyanine5 azide | Lumiprobe | Cat#B3330 |
| Hoechst 33342 | Thermo Scientific | Cat#62249 |
| Recombinant human SERPINB2 protein | R&D Systems | Cat#9206-PI-025 |
| Recombinant human LTBP3 protein | Origene | Cat#TP326379 |
| Recombinant human WNT5A protein | Abcam | Cat#ab204627 |
| Recombinant human VEGF 165 protein | R&D Systems | Cat#293-VE-050 |
| Critical Commercial Assays | ||
| Chromium Single Cell 3′ Library & Gel Bead Kit v2 | 10xGenomics | Cat#PN-120237 |
| Chromium Single Cell A Chip Kit | 10xGenomics | Cat#PN-120236 |
| Chromium i7 Multiplex Kit | 10xGenomics | Cat#PN-120262 |
| Chromium Next GEM Single Cell ATAC Library & Gel Bead Kit v1.1 | 10xGenomics | Cat#1000176 |
| Chromium Next GEM Chip H Single Cell Kit | 10xGenomics | Cat#1000162 |
| Chromium i7 Multiplex Kit N, Set A | 10xGenomics | Cat#1000084 |
| D5000 High Sensitivity DNA ScreenTape | Agilent | Cat#5067-5592 |
| D1000 ScreenTape | Agilent | Cat#5067-5582 |
| Qubit dsDNA HS Assay Kit | Invitrogen | Cat#Q32854 |
| Neomyt Kit | Cellutron | Cat#nc-6031 |
| Adeno-X Adenoviral System 3 | Clontech | Cat#632267 |
| Deposited Data | ||
| Raw and processed data | This paper | GEO: GSE153481 |
| RNA-seq of neonatal heart regeneration | Wang et al., 2019b | GEO: GSE123868 |
| Experimental Models: Cell Lines | ||
| Adeno-X 293 | Clontech | Cat#632271 |
| 293A | Invitrogen | Cat#R70507 |
| Human umbilical vein endothelial cells (HUVECs) | ATCC | Cat#PCS-100-010 |
| Experimental Models: Organisms/Strains | ||
| Mouse: ICR/CD-1 | Charles River | N/A |
| Rat: Sprague Dawley | Envigo | N/A |
| Recombinant DNA | ||
| pcDNA3.1-Serpinb2-3xFLAG | This paper | N/A |
| pcDNA3.1-Ltbp3-3xFLAG | This paper | N/A |
| pcDNA3.1-Wnt5a-3xFLAG | This paper | N/A |
| Software and Algorithms | ||
| Cell Ranger (v2.1) | 10xGenomics | https://support.10xgenomics.com/single-cell-gene-expression/software/downloads/latest/ |
| Cell Ranger ATAC (v1.2.0) | 10xGenomics | https://support.10xgenomics.com/single-cell-atac/software/downloads/latest |
| Seurat (v3.1.4) | Stuart et al., 2019; Butler et al., 2018 | https://satijalab.org/seurat/ |
| Signac (v0.2.5) | Stuart et al., 2019 | https://satijalab.org/signac/index.html |
| Metascape | Zhou et al., 2019 | http://metascape.org/ |
| Cytoscape (v3.6.0) | Shannon et al., 2003 | https://cytoscape.org/ |
| chromVAR | Schep et al., 2017 | https://github.com/GreenleafLab/chromVAR |
| GraphPad Prism 8 | GraphPad Software Inc | N/A |
| R (v3.6.1) | The R Foundation | https://www.r-project.org/foundation/ |
Highlights.
scRNA-seq and scATAC-seq atlases of neonatal heart regeneration
Crosstalk of heterogeneous cell populations during regeneration
Unique epicardial secreted factors involved in angiogenesis and fibrosis
Macrophage secreted factor CLCF1 promotes cardiomyocyte proliferation
ACKNOWLEDGMENTS
We would like to thank Drs. Jian Xu, Yoon Jung Kim, and Xin Liu from the Next Generation Sequencing Core Facility at Children’s Research Institute at the University of Texas Southwestern Medical Center for performing the Illumina sequencing. We thank Jose Cabrera for help with graphics; Stephen Johnson for help with high-performance computing; Drs. Ngoc Uyen Nhi Nguyen and Elisa Villalobos for technical advice on cardiac FB culture; Drs. Kedryn Baskin, Catherine Makarewich, and Hisayuki Hashimoto for advice on cardiac cell isolation; and Drs. Genevieve Konopka, Fatma Ayhan, and Marissa Co for help with setting up the single-cell workflow. We thank Dr. Len Pennacchio and the VISTA Enhancer Browser for the transgenic enhancer reporter analysis, and Dr. Huocong Huang for sharing reagents. We thank members of the Olson lab for discussions and Dr. Wenduo Ye for scientific inspiration. This work was supported by grants from the NIH (AR-067294, HL-130253, HL-138426, and HD-087351), the Fondation Leducq Transatlantic Networks of Excellence in Cardiovascular Research, and the Robert A. Welch Foundation (1-0025 to E.N.O.). Z.W. was supported by a predoctoral fellowship from the American Heart Association and the Harry S. Moss Heart Trust (19PRE34380436).
Footnotes
SUPPLEMENTAL INFORMATION
Supplemental Information can be found online at https://doi.org/10.1016/j.celrep.2020.108472.
DECLARATION OF INTERESTS
The authors declare no competing interests.
REFERENCES
- Abraityte A, Vinge LE, Askevold ET, Lekva T, Michelsen AE, Ranheim T, Alfsnes K, Fiane A, Aakhus S, Lunde IG, et al. (2017). Wnt5a is elevated in heart failure and affects cardiac fibroblast function. J. Mol. Med. (Berl.) 95, 767–777. [DOI] [PubMed] [Google Scholar]
- Alexander WS, Rakar S, Robb L, Farley A, Willson TA, Zhang JG, Hartley L, Kikuchi Y, Kojima T, Nomura H, et al. (1999). Suckling defect in mice lacking the soluble haemopoietin receptor NR6. Curr. Biol 9, 605–608. [DOI] [PubMed] [Google Scholar]
- Artap S, Manderfield LJ, Smith CL, Poleshko A, Aghajanian H, See K, Li L, Jain R, and Epstein JA (2018). Endocardial Hippo signaling regulates myocardial growth and cardiogenesis. Dev. Biol 440, 22–30. [DOI] [PMC free article] [PubMed] [Google Scholar]
- Asp M, Giacomello S, Larsson L, Wu C, F€rth D, Qian X, Wardell E, Custodio J, Reimegård J, Salmén F, et al. (2019). A spatiotemporal organ-wide gene expression and cell atlas of the developing human heart. Cell 179, 1647–1660. e19. [DOI] [PubMed] [Google Scholar]
- Aurora AB, and Olson EN (2014). Immune modulation of stem cells and regeneration. Cell Stem Cell 15, 14–25. [DOI] [PMC free article] [PubMed] [Google Scholar]
- Aurora AB, Porrello ER, Tan W, Mahmoud AI, Hill JA, Bassel-Duby R, Sadek HA, and Olson EN (2014). Macrophages are required for neonatal heart regeneration. J. Clin. Invest 124, 1382–1392. [DOI] [PMC free article] [PubMed] [Google Scholar]
- Bassat E, Mutlak YE, Genzelinakh A, Shadrin IY, Baruch Umansky K, Yifa O, Kain D, Rajchman D, Leach J, Riabov Bassat D, et al. (2017). The extracellular matrix protein agrin promotes heart regeneration in mice. Nature 547, 179–184. [DOI] [PMC free article] [PubMed] [Google Scholar]
- Binnerts ME, Kim K-A, Bright JM, Patel SM, Tran K, Zhou M, Leung JM, Liu Y, Lomas WE 3rd, Dixon M, et al. (2007). R-Spondin1 regulates Wnt signaling by inhibiting internalization of LRP6. Proc. Natl. Acad. Sci. USA 104, 14700–14705. [DOI] [PMC free article] [PubMed] [Google Scholar]
- Blow MJ, McCulley DJ, Li Z, Zhang T, Akiyama JA, Holt A, Plajzer-Frick I, Shoukry M, Wright C, Chen F, et al. (2010). ChIP-Seq identification of weakly conserved heart enhancers. Nat. Genet 42, 806–810. [DOI] [PMC free article] [PubMed] [Google Scholar]
- Buenrostro JD, Wu B, Litzenburger UM, Ruff D, Gonzales ML, Snyder MP, Chang HY, and Greenleaf WJ (2015). Single-cell chromatin accessibility reveals principles of regulatory variation. Nature 523, 486–490. [DOI] [PMC free article] [PubMed] [Google Scholar]
- Butler A, Hoffman P, Smibert P, Papalexi E, and Satija R (2018). Integrating single-cell transcriptomic data across different conditions, technologies, and species. Nat. Biotechnol 36, 411–420. [DOI] [PMC free article] [PubMed] [Google Scholar]
- Cao J, and Poss KD (2018). The epicardium as a hub for heart regeneration. Nat. Rev. Cardiol 15, 631–647. [DOI] [PMC free article] [PubMed] [Google Scholar]
- Cui Y, Zheng Y, Liu X, Yan L, Fan X, Yong J, Hu Y, Dong J, Li Q, Wu X, et al. (2019). Single-cell transcriptome analysis maps the developmental track of the human heart. Cell Rep. 26, 1934–1950. e5. [DOI] [PubMed] [Google Scholar]
- Cui M, Wang Z, Chen K, Shah AM, Tan W, Duan L, Sanchez-Ortiz E, Li H, Xu L, Liu N, et al. (2020). Dynamic Transcriptional Responses to Injury of Regenerative and Non-regenerative Cardiomyocytes Revealed by Single-Nucleus RNA Sequencing. Dev. Cell 53, 102–116. e8. [DOI] [PMC free article] [PubMed] [Google Scholar]
- Das S, Goldstone AB, Wang H, Farry J, D’Amato G, Paulsen MJ, Eskandari A, Hironaka CE, Phansalkar R, Sharma B, et al. (2019). A unique collateral artery development program promotes neonatal heart regeneration. Cell 176, 1128–1142. e18. [DOI] [PMC free article] [PubMed] [Google Scholar]
- de Lau W, Barker N, Low TY, Koo BK, Li VS, Teunissen H, Kujala P, Haegebarth A, Peters PJ, van de Wetering M, et al. (2011). Lgr5 homologues associate with Wnt receptors and mediate R-spondin signalling. Nature 476, 293–297. [DOI] [PubMed] [Google Scholar]
- DeLaughter DM, Bick AG, Wakimoto H, McKean D, Gorham JM, Kathiriya IS, Hinson JT, Homsy J, Gray J, Pu W, et al. (2016). Single-cell resolution of temporal gene expression during heart development. Dev. Cell 39, 480–490. [DOI] [PMC free article] [PubMed] [Google Scholar]
- D’Uva G, Aharonov A, Lauriola M, Kain D, Yahalom-Ronen Y, Carvalho S, Weisinger K, Bassat E, Rajchman D, Yifa O, et al. (2015). ERBB2 triggers mammalian heart regeneration by promoting cardiomyocyte dedifferentiation and proliferation. Nat. Cell Biol 17, 627–638. [DOI] [PubMed] [Google Scholar]
- Działo E, Rudnik M, Koning RI, Czepiel M, Tkacz K, Baj-Krzyworzeka M, Distler O, Siedlar M, Kania G, and Błyszczuk P (2019). WNT3a and WNT5a Transported by Exosomes Activate WNT Signaling Pathways in Human Cardiac Fibroblasts. Int. J. Mol. Sci 20, 1436. [DOI] [PMC free article] [PubMed] [Google Scholar]
- Fan Y, Cheng Y, Li Y, Chen B, Wang Z, Wei T, Zhang H, Guo Y, Wang Q, Wei Y, et al. (2020). Phosphoproteomic Analysis of Neonatal Regenerative Myocardium Revealed Important Roles of Checkpoint Kinase 1 via Activating Mammalian Target of Rapamycin C1/Ribosomal Protein S6 Kinase b-1 Pathway. Circulation 141, 1554–1569. [DOI] [PubMed] [Google Scholar]
- Farbehi N, Patrick R, Dorison A, Xaymardan M, Janbandhu V, Wystub-Lis K, Ho JW, Nordon RE, and Harvey RP (2019). Single-cell expression profiling reveals dynamic flux of cardiac stromal, vascular and immune cells in health and injury. eLife 8, e43882. [DOI] [PMC free article] [PubMed] [Google Scholar]
- Forte E, Skelly DA, Chen M, Daigle S, Morelli KA, Hon O, Philip VM, Costa MW, Rosenthal NA, and Furtado MB (2020). Dynamic Interstitial Cell Response during Myocardial Infarction Predicts Resilience to Rupture in Genetically Diverse Mice. Cell Rep. 30, 3149–3163. e6. [DOI] [PMC free article] [PubMed] [Google Scholar]
- Fu X, Khalil H, Kanisicak O, Boyer JG, Vagnozzi RJ, Maliken BD, Sargent MA, Prasad V, Valiente-Alandi I, Blaxall BC, and Molkentin JD (2018). Specialized fibroblast differentiated states underlie scar formation in the infarcted mouse heart. J. Clin. Invest 128, 2127–2143. [DOI] [PMC free article] [PubMed] [Google Scholar]
- Gladka MM, Molenaar B, de Ruiter H, van der Elst S, Tsui H, Versteeg D, Lacraz GPA, Huibers MMH, van Oudenaarden A, and van Rooij E (2018). Single-Cell Sequencing of the Healthy and Diseased Heart Reveals Cytoskeleton-Associated Protein 4 as a New Modulator of Fibroblasts Activation. Circulation 138, 166–180. [DOI] [PubMed] [Google Scholar]
- Godwin JW, Pinto AR, and Rosenthal NA (2017). Chasing the recipe for a pro-regenerative immune system. Semin. Cell Dev. Biol 61, 71–79. [DOI] [PMC free article] [PubMed] [Google Scholar]
- Gore AV, Swift MR, Cha YR, Lo B, McKinney MC, Li W, Castranova D, Davis A, Mukouyama YS, and Weinstein BM (2011). Rspo1/Wnt signaling promotes angiogenesis via Vegfc/Vegfr3. Development 138, 4875–4886. [DOI] [PMC free article] [PubMed] [Google Scholar]
- Hashimoto H, Wang Z, Garry GA, Malladi VS, Botten GA, Ye W, Zhou H, Osterwalder M, Dickel DE, Visel A, et al. (2019). Cardiac reprogramming factors synergistically activate genome-wide cardiogenic stage-specific enhancers. Cell Stem Cell 25, 69–86. e5. [DOI] [PMC free article] [PubMed] [Google Scholar]
- Hill MC, Kadow ZA, Li L, Tran TT, Wythe JD, and Martin JF (2019). A cellular atlas of Pitx2-dependent cardiac development. Development 146, dev180398. [DOI] [PMC free article] [PubMed] [Google Scholar]
- Hirose K, Payumo AY, Cutie S, Hoang A, Zhang H, Guyot R, Lunn D, Bigley RB, Yu H, Wang J, et al. (2019). Evidence for hormonal control of heart regenerative capacity during endothermy acquisition. Science 364, 184–188. [DOI] [PMC free article] [PubMed] [Google Scholar]
- Hosein AN, Huang H, Wang Z, Parmar K, Du W, Huang J, Maitra A, Olson E, Verma U, and Brekken RA (2019). Cellular heterogeneity during mouse pancreatic ductal adenocarcinoma progression at single-cell resolution. JCI Insight 5, e129212. [DOI] [PMC free article] [PubMed] [Google Scholar]
- Jia G, Preussner J, Chen X, Guenther S, Yuan X, Yekelchyk M, Kuenne C, Looso M, Zhou Y, Teichmann S, and Braun T (2018). Single cell RNA-seq and ATAC-seq analysis of cardiac progenitor cell transition states and lineage settlement. Nat. Commun 9, 4877. [DOI] [PMC free article] [PubMed] [Google Scholar]
- Kalucka J, de Rooij LPMH, Goveia J, Rohlenova K, Dumas SJ, Meta E, Conchinha NV, Taverna F, Teuwen L-A, Veys K, et al. (2020). Single-Cell Transcriptome Atlas of Murine Endothelial Cells. Cell 180, 764–779. e20. [DOI] [PubMed] [Google Scholar]
- Li J, Yang KY, Tam RCY, Chan VW, Lan HY, Hori S, Zhou B, and Lui KO (2019). Regulatory T-cells regulate neonatal heart regeneration by potentiating cardiomyocyte proliferation in a paracrine manner. Theranostics 9, 4324–4341. [DOI] [PMC free article] [PubMed] [Google Scholar]
- Li YE, Preissl S, Hou X, Zhang Z, Zhang K, Fang R, Qiu Y, Poirion O, Li B, Liu H, et al. (2020). An Atlas of Gene Regulatory Elements in Adult Mouse Cerebrum. bioRxiv. 10.1101/2020.05.10.087585. [DOI] [PMC free article] [PubMed] [Google Scholar]
- Lin Q, Schwarz J, Bucana C, and Olson EN (1997). Control of mouse cardiac morphogenesis and myogenesis by transcription factor MEF2C. Science 276, 1404–1407. [DOI] [PMC free article] [PubMed] [Google Scholar]
- Litviňuková M, Talavera-López C, Maatz H, Reichart D, Worth CL, Lindberg EL, Kanda M, Polanski K, Heinig M, Lee M, et al. (2020). Cells of the adult human heart. Nature, Published online September 24, 2020 10.1038/s41586-020-2797-4. [DOI] [PMC free article] [PubMed] [Google Scholar]
- Liu X, Chen W, Li W, Li Y, Priest JR, Zhou B, Wang J, and Zhou Z (2019). Single-cell RNA-seq of the developing cardiac outflow tract reveals convergent development of the vascular smooth muscle cells. Cell Rep. 28, 1346–1361. e4. [DOI] [PubMed] [Google Scholar]
- Martini E, Kunderfranco P, Peano C, Carullo P, Cremonesi M, Schorn T, Carriero R, Termanini A, Colombo FS, Jachetti E, et al. (2019). Single-Cell Sequencing of Mouse Heart Immune Infiltrate in Pressure Overload-Driven Heart Failure Reveals Extent of Immune Activation. Circulation 140, 2089–2107. [DOI] [PubMed] [Google Scholar]
- Mezger A, Klemm S, Mann I, Brower K, Mir A, Bostick M, Farmer A, Fordyce P, Linnarsson S, and Greenleaf W (2018). High-throughput chromatin accessibility profiling at single-cell resolution. Nat. Commun 9, 3647. [DOI] [PMC free article] [PubMed] [Google Scholar]
- Mizutani M, Wu JC, and Nusse R (2016). Fibrosis of the Neonatal Mouse Heart After Cryoinjury Is Accompanied by Wnt Signaling Activation and Epicardial-to-Mesenchymal Transition. J. Am. Heart Assoc 5, e002457. [DOI] [PMC free article] [PubMed] [Google Scholar]
- Nakada Y, Canseco DC, Thet S, Abdisalaam S, Asaithamby A, Santos CX, Shah AM, Zhang H, Faber JE, Kinter MT, et al. (2017). Hypoxia induces heart regeneration in adult mice. Nature 541, 222–227. [DOI] [PubMed] [Google Scholar]
- Patterson M, Barske L, Van Handel B, Rau CD, Gan P, Sharma A, Parikh S, Denholtz M, Huang Y, Yamaguchi Y, et al. (2017). Frequency of mononuclear diploid cardiomyocytes underlies natural variation in heart regeneration. Nat. Genet 49, 1346–1353. [DOI] [PMC free article] [PubMed] [Google Scholar]
- Porrello ER, Mahmoud AI, Simpson E, Hill JA, Richardson JA, Olson EN, and Sadek HA (2011). Transient regenerative potential of the neonatal mouse heart. Science 331, 1078–1080. [DOI] [PMC free article] [PubMed] [Google Scholar]
- Porrello ER, Mahmoud AI, Simpson E, Johnson BA, Grinsfelder D, Canseco D, Mammen PP, Rothermel BA, Olson EN, and Sadek HA (2013). Regulation of neonatal and adult mammalian heart regeneration by the miR-15 family. Proc. Natl. Acad. Sci. USA 110, 187–192. [DOI] [PMC free article] [PubMed] [Google Scholar]
- Preissl S, Fang R, Huang H, Zhao Y, Raviram R, Gorkin DU, Zhang Y, Sos BC, Afzal V, Dickel DE, et al. (2018). Single-nucleus analysis of accessible chromatin in developing mouse forebrain reveals cell-type-specific transcriptional regulation. Nat. Neurosci 21, 432–439. [DOI] [PMC free article] [PubMed] [Google Scholar]
- Quaife-Ryan GA, Sim CB, Ziemann M, Kaspi A, Rafehi H, Ramialison M, El-Osta A, Hudson JE, and Porrello ER (2017). Multicellular Transcriptional Analysis of Mammalian Heart Regeneration. Circulation 136, 1123–1139. [DOI] [PMC free article] [PubMed] [Google Scholar]
- Quijada P, Trembley MA, and Small EM (2020). The Role of the Epicardium During Heart Development and Repair. Circ. Res 126, 377–394. [DOI] [PMC free article] [PubMed] [Google Scholar]
- Ramilowski JA, Goldberg T, Harshbarger J, Kloppmann E, Lizio M, Satagopam VP, Itoh M, Kawaji H, Carninci P, Rost B, and Forrest AR (2015). A draft network of ligand-receptor-mediated multicellular signalling in human. Nat. Commun 6, 7866. [DOI] [PMC free article] [PubMed] [Google Scholar]
- Rifkin DB (2005). Latent transforming growth factor-beta (TGF-beta) binding proteins: orchestrators of TGF-beta availability. J. Biol. Chem 280, 7409–7412. [DOI] [PubMed] [Google Scholar]
- Rodriguez P, Sassi Y, Troncone L, Benard L, Ishikawa K, Gordon RE, Lamas S, Laborda J, Hajjar RJ, and Lebeche D (2019). Deletion of delta-like 1 homologue accelerates fibroblast-myofibroblast differentiation and induces myocardial fibrosis. Eur. Heart J 40, 967–978. [DOI] [PMC free article] [PubMed] [Google Scholar]
- Schep AN, Wu B, Buenrostro JD, and Greenleaf WJ (2017). chromVAR: inferring transcription-factor-associated accessibility from single-cell epigenomic data. Nat. Methods 14, 975–978. [DOI] [PMC free article] [PubMed] [Google Scholar]
- See K, Tan WLW, Lim EH, Tiang Z, Lee LT, Li PYQ, Luu TDA, Ackers-Johnson M, and Foo RS (2017). Single cardiomyocyte nuclear transcriptomes reveal a lincRNA-regulated de-differentiation and cell cycle stress-response in vivo. Nat. Commun 8, 225. [DOI] [PMC free article] [PubMed] [Google Scholar]
- Shannon P, Markiel A, Ozier O, Baliga NS, Wang JT, Ramage D, Amin N, Schwikowski B, and Ideker T (2003). Cytoscape: a software environment for integrated models of biomolecular interaction networks. Genome Res. 13, 2498–2504. [DOI] [PMC free article] [PubMed] [Google Scholar]
- Sims NA (2015). Cardiotrophin-like cytokine factor 1 (CLCF1)and neuropoietin (NP) signalling and their roles in development, adulthood, cancer and degenerative disorders. Cytokine Growth Factor Rev. 26, 517–522. [DOI] [PubMed] [Google Scholar]
- Singh BN, Koyano-Nakagawa N, Gong W, Moskowitz IP, Weaver CV, Braunlin E, Das S, van Berlo JH, Garry MG, and Garry DJ (2018). A conserved HH-Gli1-Mycn network regulates heart regeneration from newt to human. Nat. Commun 9, 4237. [DOI] [PMC free article] [PubMed] [Google Scholar]
- Skelly DA, Squiers GT, McLellan MA, Bolisetty MT, Robson P, Rosenthal NA, and Pinto AR (2018). Single-Cell Transcriptional Profiling Reveals Cellular Diversity and Intercommunication in the Mouse Heart. Cell Rep. 22, 600–610. [DOI] [PubMed] [Google Scholar]
- Stuart T, Butler A, Hoffman P, Hafemeister C, Papalexi E, Mauck WM III, Hao Y, Stoeckius M, Smibert P, and Satija R (2019). Comprehensive integration of single-cell data. Cell 177, 1888–1902. e21. [DOI] [PMC free article] [PubMed] [Google Scholar]
- Tao G, Kahr PC, Morikawa Y, Zhang M, Rahmani M, Heallen TR, Li L, Sun Z, Olson EN, Amendt BA, and Martin JF (2016). Pitx2 promotes heart repair by activating the antioxidant response after cardiac injury. Nature 534, 119–123. [DOI] [PMC free article] [PubMed] [Google Scholar]
- Tracy LE, Minasian RA, and Caterson EJ (2016). Extracellular Matrix and Dermal Fibroblast Function in the Healing Wound. Adv. Wound Care (New Rochelle) 5, 119–136. [DOI] [PMC free article] [PubMed] [Google Scholar]
- Tucker NR, Chaffin M, Fleming SJ, Hall AW, Parsons VA, Bedi KC Jr., Akkad A-D, Herndon CN, Arduini A, Papangeli I, et al. (2020). Transcriptional and Cellular Diversity of the Human Heart. Circulation 142, 466–482. [DOI] [PMC free article] [PubMed] [Google Scholar]
- Visel A, Minovitsky S, Dubchak I, and Pennacchio LA (2007). VISTA Enhancer Browser—a database of tissue-specific human enhancers. Nucleic Acids Res. 35, D88–D92. [DOI] [PMC free article] [PubMed] [Google Scholar]
- von Gise A, Lin Z, Schlegelmilch K, Honor LB, Pan GM, Buck JN, Ma Q, Ishiwata T, Zhou B, Camargo FD, and Pu WT (2012). YAP1, the nuclear target of Hippo signaling, stimulates heart growth through cardiomyocyte proliferation but not hypertrophy. Proc. Natl. Acad. Sci. USA 109, 2394–2399. [DOI] [PMC free article] [PubMed] [Google Scholar]
- Vuga LJ, Ben-Yehudah A, Kovkarova-Naumovski E, Oriss T, Gibson KF, Feghali-Bostwick C, and Kaminski N (2009). WNT5A is a regulator of fibroblast proliferation and resistance to apoptosis. Am. J. Respir. Cell Mol. Biol 41, 583–589. [DOI] [PMC free article] [PubMed] [Google Scholar]
- Wang M, Hu S, Nie Y, and Song J (2019a). Proteomic profiling of key transcription factors in the process of neonatal mouse cardiac regeneration capacity loss. Cell Biol. Int 43, 1435–1442. [DOI] [PubMed] [Google Scholar]
- Wang Z, Cui M, Shah AM, Ye W, Tan W, Min Y-L, Botten GA, Shelton JM, Liu N, Bassel-Duby R, and Olson EN (2019b). Mechanistic basis of neonatal heart regeneration revealed by transcriptome and histone modification profiling. Proc. Natl. Acad. Sci. USA 116, 18455–18465. [DOI] [PMC free article] [PubMed] [Google Scholar]
- Wang L, Yu P, Zhou B, Song J, Li Z, Zhang M, Guo G, Wang Y, Chen X, Han L, and Hu S (2020). Single-cell reconstruction of the adult human heart during heart failure and recovery reveals the cellular landscape underlying cardiac function. Nat. Cell Biol 22, 108–119. [DOI] [PubMed] [Google Scholar]
- Xiao Y, Hill MC, Zhang M, Martin TJ, Morikawa Y, Wang S, Moise AR, Wythe JD, and Martin JF (2018). Hippo signaling plays an essential role in cell state transitions during cardiac fibroblast development. Dev. Cell 45, 153–169. e6. [DOI] [PMC free article] [PubMed] [Google Scholar]
- Xie T, Wang Y, Deng N, Huang G, Taghavifar F, Geng Y, Liu N, Kulur V, Yao C, Chen P, et al. (2018). Single-cell deconvolution of fibroblast heterogeneity in mouse pulmonary fibrosis. Cell Rep. 22, 3625–3640. [DOI] [PMC free article] [PubMed] [Google Scholar]
- Xin M, Kim Y, Sutherland LB, Murakami M, Qi X, McAnally J, Porrello ER, Mahmoud AI, Tan W, Shelton JM, et al. (2013). Hippo pathway effector Yap promotes cardiac regeneration. Proc. Natl. Acad. Sci. USA 110, 13839–13844. [DOI] [PMC free article] [PubMed] [Google Scholar]
- Ye L, D’Agostino G, Loo SJ, Wang CX, Su LP, Tan SH, Tee GZ, Pua CJ, Pena EM, Cheng RB, et al. (2018). Early Regenerative Capacity in the Porcine Heart. Circulation 138, 2798–2808. [DOI] [PubMed] [Google Scholar]
- Zhang H, Pu W, Li G, Huang X, He L, Tian X, Liu Q, Zhang L, Wu SM, Sucov HM, and Zhou B (2016). Endocardium Minimally Contributes to Coronary Endothelium in the Embryonic Ventricular Free Walls. Circ. Res 118, 1880–1893. [DOI] [PubMed] [Google Scholar]
- Zhou B, Honor LB, He H, Ma Q, Oh JH, Butterfield C, Lin RZ, Melero-Martin JM, Dolmatova E, Duffy HS, et al. (2011). Adult mouse epicardium modulates myocardial injury by secreting paracrine factors. J. Clin. Invest 121, 1894–1904. [DOI] [PMC free article] [PubMed] [Google Scholar]
- Zhou Y, Zhou B, Pache L, Chang M, Khodabakhshi AH, Tanaseichuk O, Benner C, and Chanda SK (2019). Metascape provides a biologist-oriented resource for the analysis of systems-level datasets. Nat. Commun 10, 1523. [DOI] [PMC free article] [PubMed] [Google Scholar]
- Zhu M, Goetsch SC, Wang Z, Luo R, Hill JA, Schneider J, Morris SM Jr., and Liu Z-P (2015). FoxO4 promotes early inflammatory response upon myocardial infarction via endothelial Arg1. Circ. Res 117, 967–977. [DOI] [PMC free article] [PubMed] [Google Scholar]
- Zhu W, Zhang E, Zhao M, Chong Z, Fan C, Tang Y, Hunter JD, Borovjagin AV, Walcott GP, Chen JY, et al. (2018). Regenerative Potential of Neonatal Porcine Hearts. Circulation 138, 2809–2816. [DOI] [PMC free article] [PubMed] [Google Scholar]
- Zilionis R, Engblom C, Pfirschke C, Savova V, Zemmour D, Saatcioglu HD, Krishnan I, Maroni G, Meyerovitz CV, Kerwin CM, et al. (2019). Single-cell transcriptomics of human and mouse lung cancers reveals conserved myeloid populations across individuals and species. Immunity 50, 1317–1334. e10. [DOI] [PMC free article] [PubMed] [Google Scholar]
Associated Data
This section collects any data citations, data availability statements, or supplementary materials included in this article.
Supplementary Materials
Data Availability Statement
All data, including raw sequencing data and processed data, have been deposited in the Gene Expression Omnibus (https://www.ncbi.nlm.nih.gov/geo/) under the superseries GSE153481. The accession number for the scRNA-seq data reported in this study is GSE153480. The accession number for the scATAC-seq data reported in this study is GSE153479. The code generated during this study are available from the Lead Contact upon request.