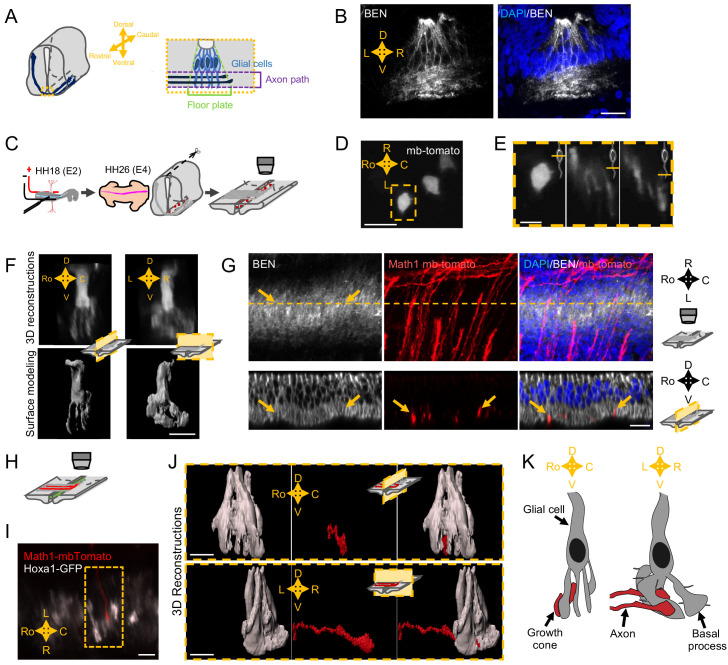
Figure 4. Spatial organization of the commissural axon navigation path.
(A) Schematic drawings of a spinal cord at E12.5 when commissural axons cross the floor plate (FP) (left) and close-up of the FP (right) with glial cells (light blue) and crossing axons (dark blue). (B) Immunostaining of an E4 FP transverse section with FP specific BEN antibody (left) and merged with DAPI staining (right). (C) In ovo FP electroporation procedure. Sparse electroporated mbTomato electroporated cells are visualized in red. (D) Open-book imaging of E4 chick FP with sparse mbTomato electroporation. The dashed rectangle highlights a glial cell. (E) Close-up of the single glial cell observed in (D), at three different positions along the dorso-ventral axis, as shown by the schematic representation on the upper right corner of each image. (F) 3D reconstruction (upper) and surface modeling (lower) of a single FP cell seen in a sagittal (left) or transverse (right) section. (G) 3D reconstruction of axons (electroporated with mbTomato, red) navigating through the FP stained with DAPI (blue) and BEN (white). The yellow dashed line corresponds to the cut plane resulting in the sagittal optic section shown in the lower panel. Yellow arrows point growth cones intercalated between BEN labeled glial cell processes when they navigate the FP (see also Videos 9–13). (H) Schematic drawings of an open-book with a sparse electroporation of commissural axons and a broad FP electroporation. Two plasmids are used: Math1-mbTomato in commissural neurons and HoxA1-GFP in the FP. (I) Ventral longitudinal view from an open-book electroporated as described in (H). The yellow dashed rectangle delineates a close-up of a crossing growth cone electroporated with Math1-mbT omato (red) navigating along the basal feet of glial cells electroporated with Hoxa1-GFP (white). (J) Surface reconstruction of a growth cone electroporated with Math1-mbTomato (red) navigating along the basal feet of glial cells electroporated with Hoxa1-GFP (white) as seen in a sagittal section (upper) or transversal section (lower). (K) Schematic drawing of a glial cell and two axons crossing through its basal end-feet, in a sagittal view (left) or transverse view (right). Scale bars: 5 μm in (D–G, I, and J), 20 μm in (B).

