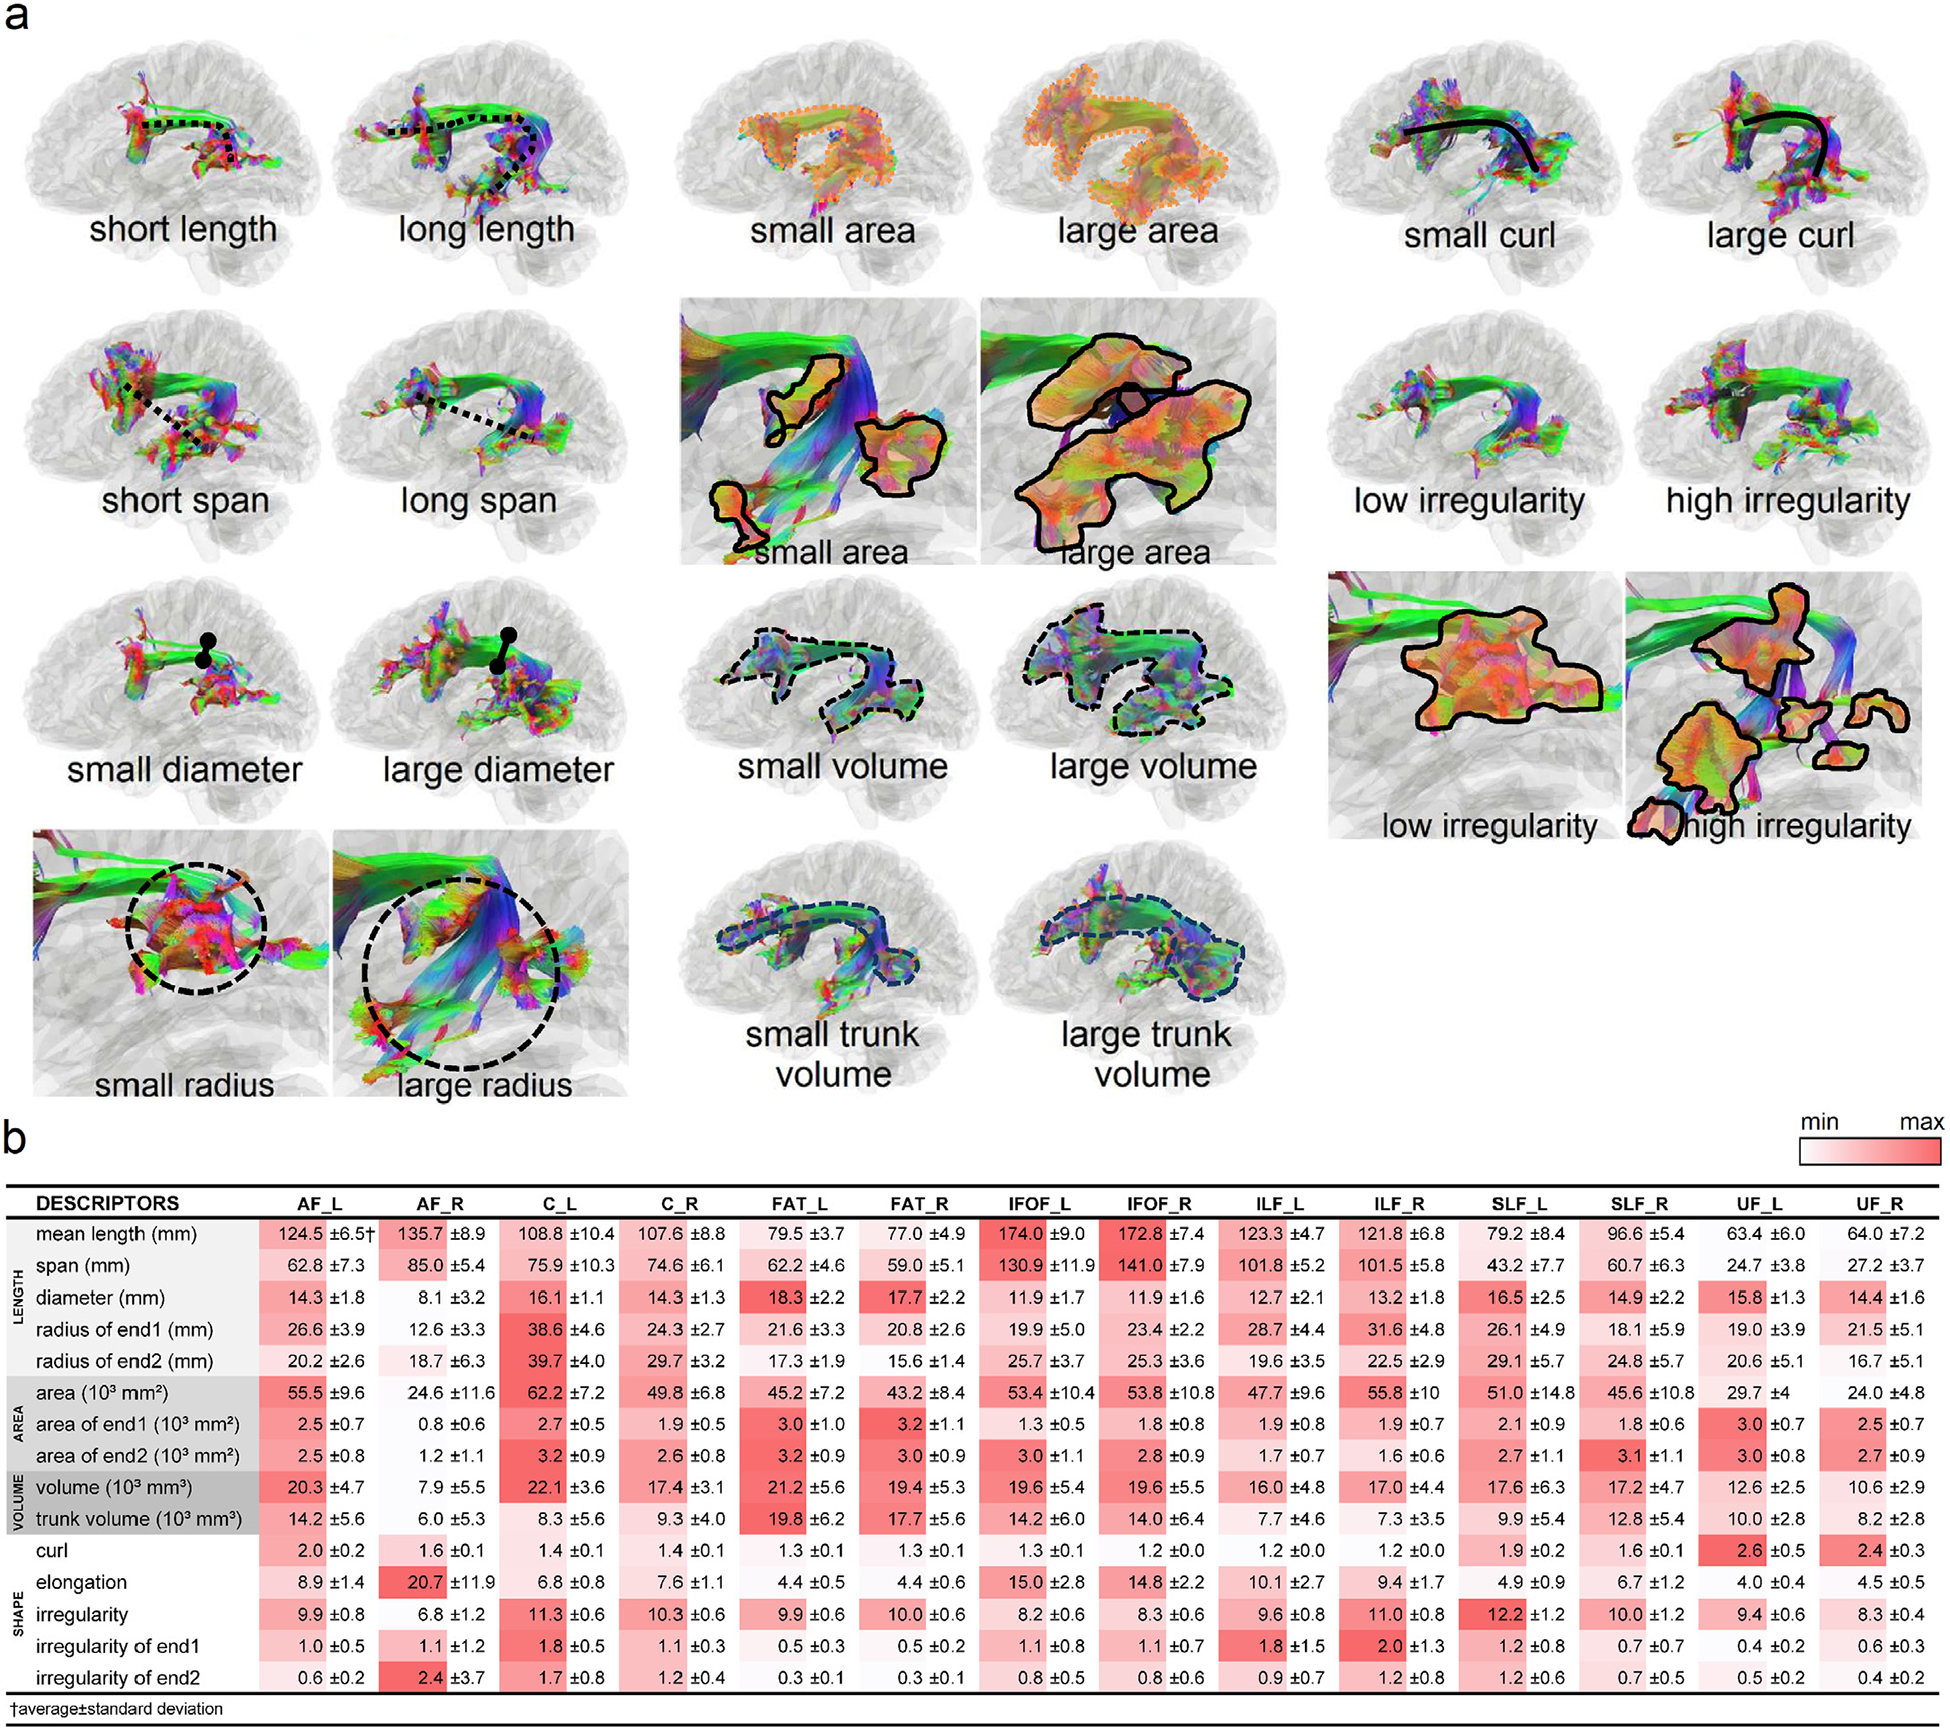
Fig. 4.

(a) Representative cases of shape descriptors are shown using the left arcuate fasciculus as an example. (b) Mean values and standard deviations of shape descriptors are listed for each association pathway. The red colors are those with relatively large values in comparison with other pathways.
