

Abstract
Magnetic resonance imaging (MRI)-only radiotherapy treatment planning is attractive since MRI provides superior soft tissue contrast without ionizing radiation compared with computed tomography (CT). However, it requires the generation of pseudo CT from MRI images for patient setup and dose calculation. Our machine-learning-based method to generate pseudo CT images has been shown to provide pseudo CT images with excellent image quality, while its dose calculation accuracy remains an open question. In this study, we aim to investigate the accuracy of dose calculation in brain frameless stereotactic radiosurgery (SRS) using pseudo CT images which are generated from MRI images using the machine learning-based method developed by our group. We retrospectively investigated a total of 19 treatment plans from 14 patients, each of whom has CT simulation and MRI images acquired during pretreatment. The dose distributions of the same treatment plans were calculated on original CT simulation images as ground truth, as well as on pseudo CT images generated from MRI images. Clinically-relevant DVH metrics and gamma analysis were extracted from both ground truth and pseudo CT results for comparison and evaluation. The side-by-side comparisons on image quality and dose distributions demonstrated very good agreement of image contrast and calculated dose between pseudo CT and original CT. The average differences in Dose-volume histogram (DVH) metrics for Planning target volume (PTVs) were less than 0.6%, and no differences in those for organs at risk at a significance level of 0.05. The average pass rate of gamma analysis was 99%. These quantitative results strongly indicate that the pseudo CT images created from MRI images using our proposed machine learning method are accurate enough to replace current CT simulation images for dose calculation in brain SRS treatment. This study also demonstrates the great potential for MRI to completely replace CT scans in the process of simulation and treatment planning.
Keywords: MRI, Treatment planning, Pseudo CT
Introduction
Magnetic resonance imaging (MRI) is one of the most important imaging modalities to utilize for patients requiring radiation therapy. In most cases, both MRI and computed tomography (CT) are performed on patients before treatment planning. MRI images allow excellent soft tissue visualization, which is useful for delineation of the tumor and organs at risk (OARs),1 while CT images provide electron density maps for dose calculation and reference images for pretreatment positioning. Typically, the contours from MRI images are transferred to CT simulation images for treatment planning after CT-MRI image fusion.
However, such a workflow involving multiple imaging modalities not only leads to additional cost and time for the patient but also introduces systematic positioning errors up to 2 mm during the CT-MRI image fusion process,2–4 which will affect the accuracy of the treatment. Moreover, patients receive non-negligible radiation dose from the CT scan,5 especially for those requiring resimulation. It is highly desirable to eliminate CT scans from the radiation treatment planning process and develop a solely MRI-based treatment planning workflow. Emerging MR-Linac technology also motivates the exclusive use of MRI in radiotherapy.6,7
The main difficulty in the introduction of MRI-based treatment planning is that, unlike CT images, MRI images cannot provide material attenuation coefficients which can be easily converted into electron density after calibration for subsequent dose calculation. To overcome this obstacle, many methods have been proposed in the literature. A common method is to assign different electron density on MRI images based on segmentation of materials. The segmentation can be done by either manually-drawn contours8–10 or automatic classification methods.11–13 However, these methods are limited by misclassification and inaccurate prediction of bone and air regions caused by their ambiguous relations in MRI image intensities, and they cannot provide realistic digitally reconstructed radiographs. Instead of segmentation, other methods use single or multiple atlases with deformable registration or pattern recognition techniques to estimate electron density, but their efficacy is limited by the performance of the registration.14–16
With the development of machine learning in recent several years, novel methods have been developed such that accurate CT equivalent images (pseudo CT) can be generated based on MRI images.17–19 In these algorithms, a model is trained by a large number of pairs of CT and MRI images, each pair of which belongs to the same patient and is well-registered with each other. Thus, the model learns the conversion between MRI image signal and attenuation coefficients in CT images, and then predicts pseudo CT images when new MRI images are input. Such pseudo CT images share the same structure information with MRI but in terms of Hounsfield units (HU), and are expected to be directly used in treatment planning for dose calculation as well as for generating digitally reconstructed radiographs to assist patient setup. Recently, we developed a novel machine-learning based method which considers anatomical features as the representation of image patch.20 Compared with other machine-learning based methods, our advantages include the use of discriminative feature selection, the joint information gain combining both MR and CT information, and the alternating random forest which consider both the global loss of training model and the uncertainty of training data falling into child nodes. For image quality, we compared our method with a state-of-the-art dictionary-learning methods. It has been shown that our method has superior mean absolute error, peak signal-to-noise ratio, and normalized cross correlation.
In this paper, we aim to study the feasibility of dose calculation in brain frameless stereotactic radiosurgery (SRS) using pseudo CT images which are generated from MRI images by the machine-learning-based method developed by our group. We retrospectively investigated patient data of SRS brain treatment with both CT simulation and MRI images acquired during pretreatment. The dose maps of the same treatment plans were calculated on original CT simulation images as ground truth, as well as on pseudo CT images generated from MRI images. Clinically relevant DVH metrics and gamma analysis were extracted from both ground truth and pseudo CT results for comparison and evaluation on a total of 19 treatment plans from 14 patients.
Methods and Materials
In this retrospective study, we analyzed the dataset of 14 patients receiving brain frameless SRS treatments. The 14 patients were randomly selected; each patient had at least one SRS treatment plan with both CT simulation and MRI images acquired as part of the standard treatment pathway. Each treatment plan may include multiple target sites, and some patients had multiple treatment plans with different isocenters. Our study was performed on each individual plan, and a total of 19 plans from 14 patients were analyzed. The specific lesion sites varied from patient to patient.
The CT images were acquired using a Siemens SOMATOM Definition AS CT scanner at 120 kVp and 220 mAs with the patient in treatment position; each 0.6-mm-thick slice had a resolution of 512 ×512 pixels, with pixel spacing of 0.586 mm. The MRI images were acquired using a Siemens Avanto 1.5T with T1 GR/IR sequence and each 1-mm-thick slice had a resolution of 256 ×256 pixels, with pixel spacing of 0.977 mm. Note that the patient setup in MRI was different from that of CT and treatment. Experienced physicians rigidly registered the CT and MRI image datasets, defined the target volume on MRI images, and prescribed dose ranging from 18 Gy to 21 Gy. Dosimetrists created SRS treatment plans on the CT images with either a volumetric arc therapy or dynamic conformal arc technique, depending on the relative positions of lesion sites and critical structures, using Eclipse 13.6 (Varian Medical Systems, Palo Alto, CA).
We have already developed a learning-based method to derive pseudo CT from routine anatomical MR images.20 The MR images of each patient were into a well-trained machine learning model to generate corresponding pseudo CT images which share the same anatomical structure as MRI images but in values of HU. The related study on this machine learning model developed by our group has been published, and we would like to briefly introduce it here. We initially built a set of paired training MRI and CT images with the CT images serving as the regression target of the MRI. Then we performed a procedure which involves removing uninformative regions and reducing noise, followed by aligning MRI and CT images with a rigid registration. The generation of pseudo CT images consists of two major stages: the training stage and the prediction stage. In the training stage, we first extract anatomical features on voxel, sub-region, and whole-patch levels from each MR image, identify the most salient and informative features using a feature selection strategy, and utilize them together with the corresponding CT image to train an initial structured random forest based on an integrated auto-context model. We then use the resulting forest to predict the pseudo CT image for each MR image in the training set, leading to an initial set of predictions. Together with the features from original CT images, we can further extract context features from the predicted pseudo CT images to train a new structured random forest and perform prediction again. By repeating this process until convergence, we can finally obtain a sequence of trained forests. In the predicting stage, we extract features from the new MR image (target) and feed them into the trained forests for the pseudo CT image generation.
To evaluate the performance of the pseudo CT images in brain SRS treatment planning, we compared the difference between dose maps calculated on the pseudo CT and those on the original CT, using the same plan parameters. Note that in this retrospective study, the MRI scans were not acquired for the purpose of simulation and thus the imaging parameters and patient setup differed from the CT simulation. Therefore, rigid registration was needed between the original CT volume and its corresponding pseudo CT (generated from MRI) to align the patient anatomy. In this study, we performed rigid registration using commercial image registration software, VelocityAI 3.2.1 (Varian Medical Systems, Palo Alto, CA). The aligned pseudo CT images were interpolated into the same voxel size as the original CT images and were then imported into the treatment planning system. The structures and treatment plan from the original CT volumes were duplicated onto the pseudo CT volumes for dose calculation using the same algorithm (analytical anisotropic algorithm), grid size (0.1 cm) and HU calibration.
For each plan, we visually checked the similarity of the dose distributions calculated on pseudo CT and original CT. Quantitatively, clinically relevant DVH metrics were extracted for comparison of dose to PTVs and relevant OARs. For plans with multiple PTVs, the DVH for a “total PTV” which combines all PTVs was used. Gamma analysis using the 3%/3 mm criteria was performed on the axial dose plane at isocenter to compare the dose distributions computed on the pseudo CT and the original CT.
Results
In Fig. 1, the image quality of pseudo CT and original CT is shown using a side-by-side comparison with original CT in the same window level from one of the 14 patients as an example. It is seen that the pseudo CT images feature good image quality, and maintain very similar contrast and most of the details as the original CT. Image errors can be observed in some small volumes around air and bones.
Fig. 1.
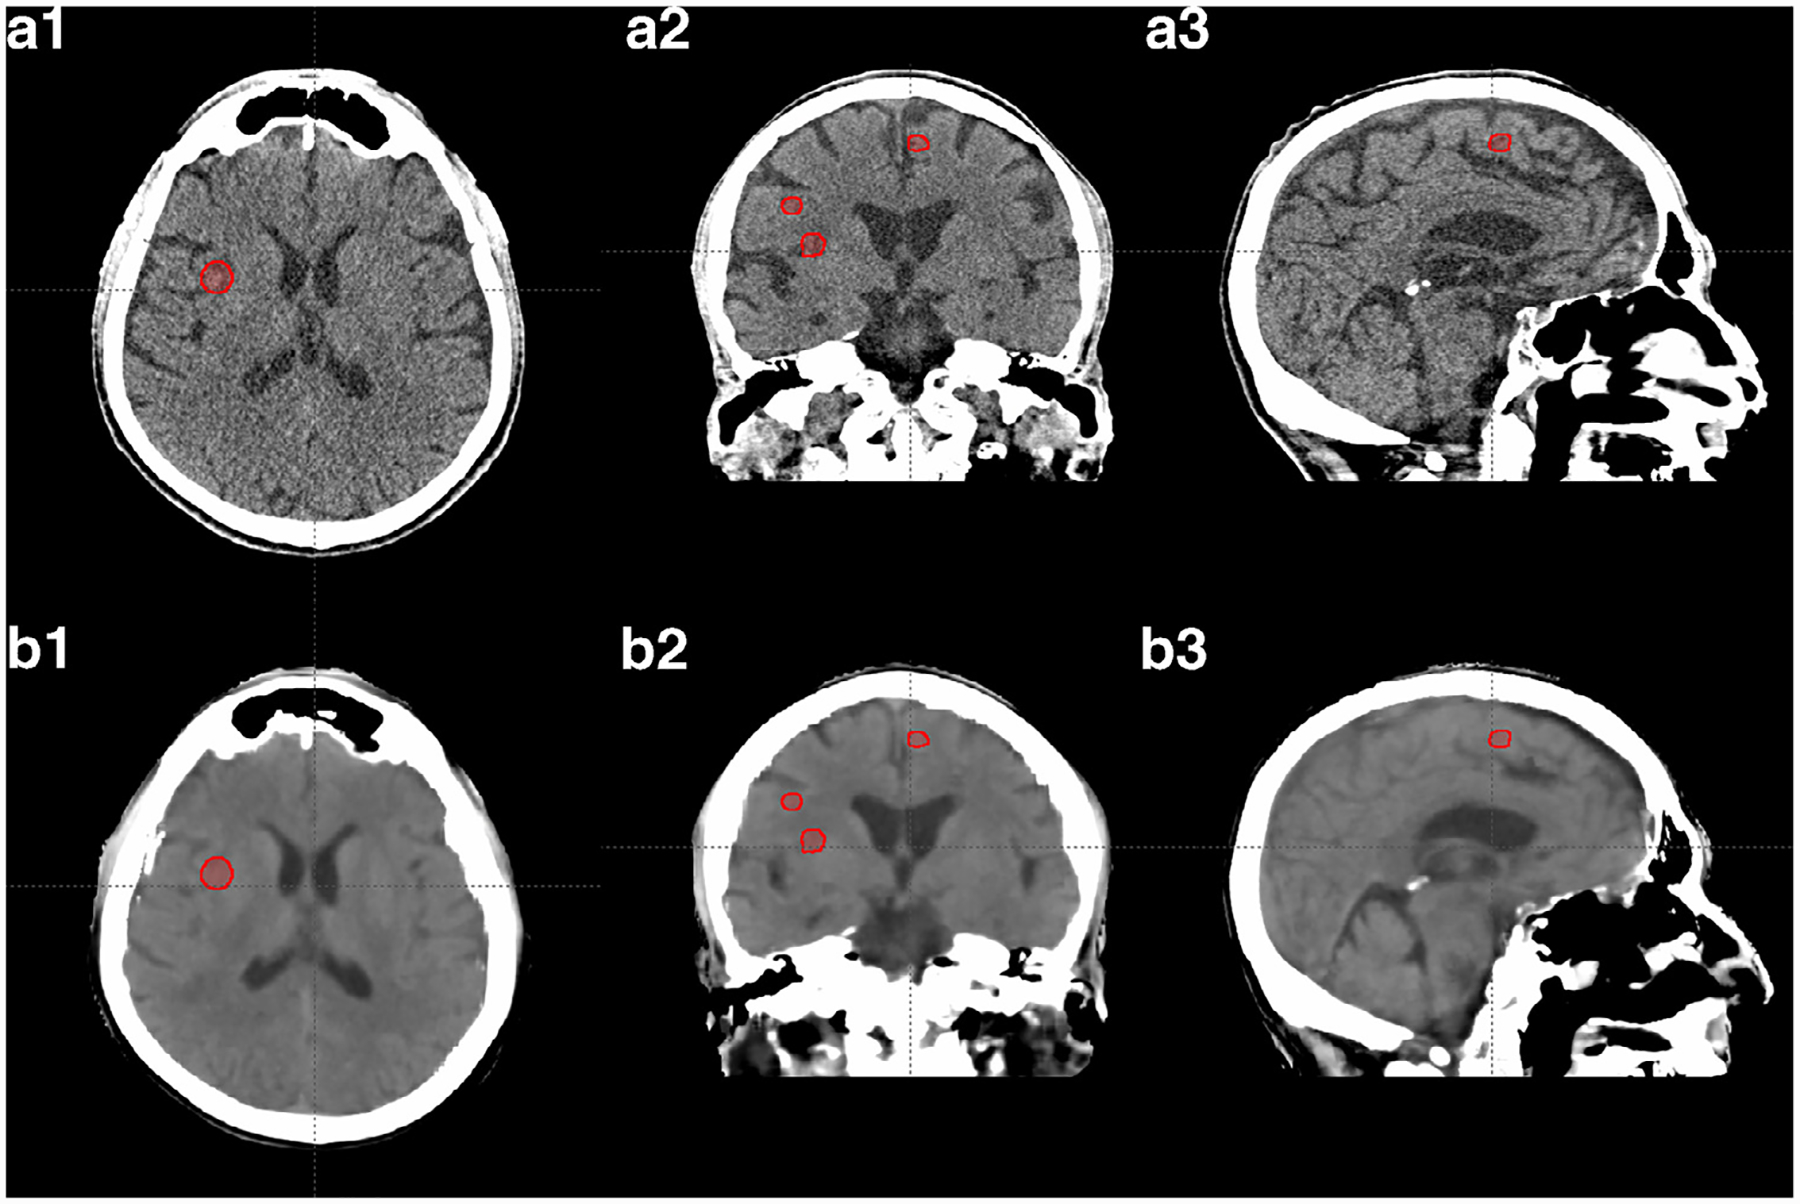
The axial, sagittal, and coronal view of CT images of one of the 14 patients. Rows (a) and (b) show the original CT images (from simulation) and the pseudo CT images generated from MRI, respectively. The red contours indicate PTVs. Display window: [−20 100] HU.
Figure 2 compares the dose distribution at the axial plane of one of PTVs in the patient shown in Fig. 1. The dose maps in color wash (Fig. 2 (a1) and (a2)) on original CT and pseudo CT qualitatively appear to be very similar. The dose profiles in Fig. 2 (b1) and (b2) across one of the PTVs match each other very well. The dose difference map in Fig. 2 (a3) shows that the differences between the dose distributions are very low for the majority of the volume, with most differences occurring at the outer boundary between body and air. The corresponding DVH curves of PTV (combining multiple PTVs) and relevant OARs shown in Fig. 3 indicate that the dose differences in structures are minimal. Note that we present the result of one patient as an example, but similar results can be seen on the other patients.
Fig. 2.
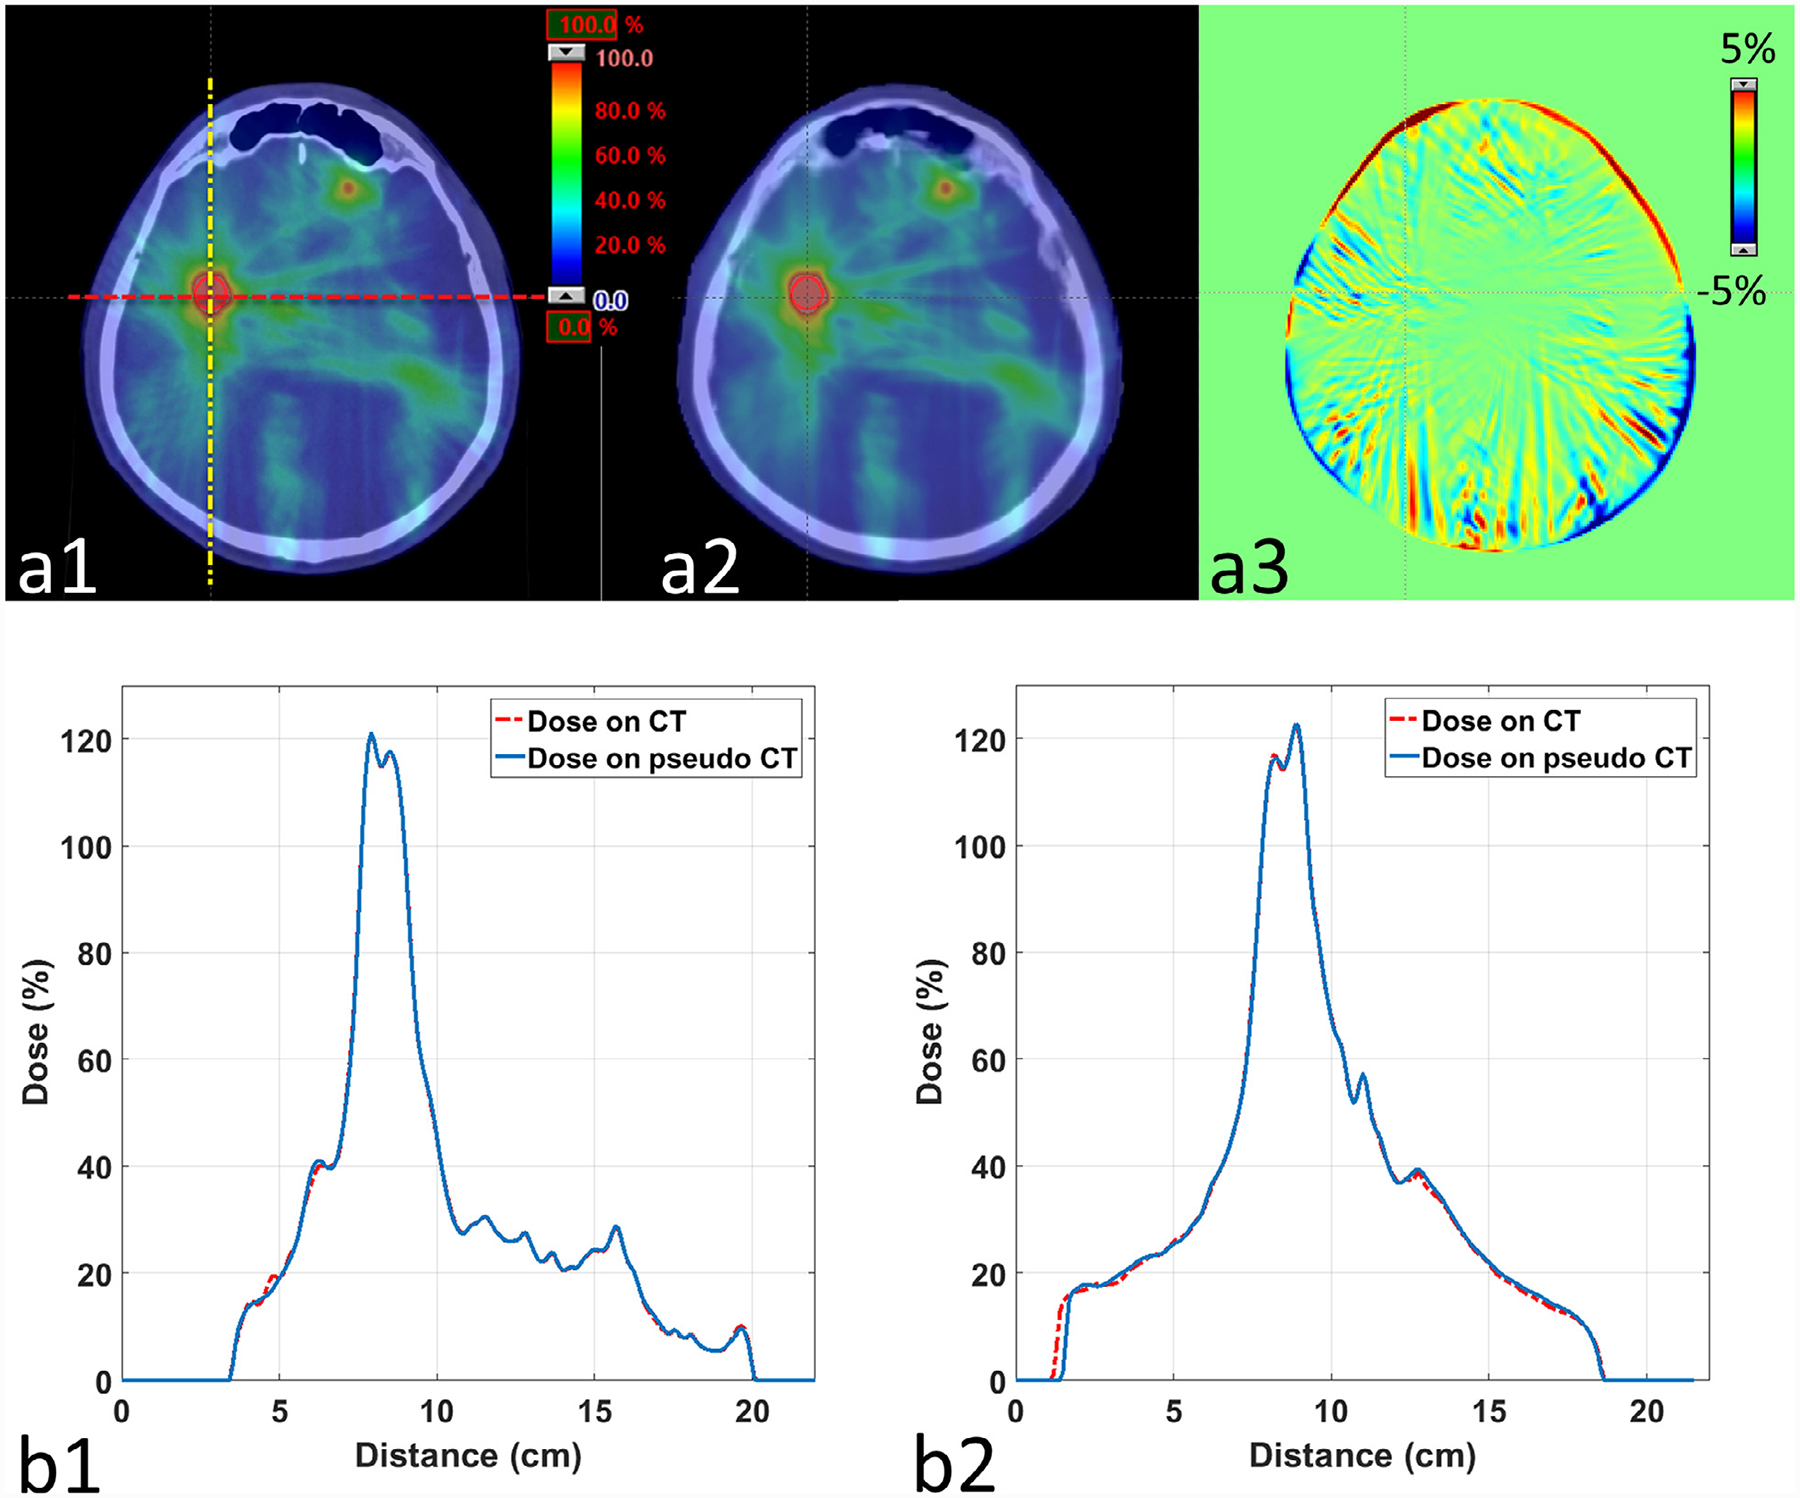
Dose distribution calculated on original CT and pseudo CT. Row (a) shows the dose maps in color wash on (1) original CT and (2) pseudo CT on the axial plane of one of the PTVs in the patient of Fig. 1. The dose difference map between (a1) and (a2) is shown in (a3). The red dashed line and yellow dashed-dot line on (a1) indicate the positions of profiles displayed in (b1) and (b2), respectively.
Fig. 3.
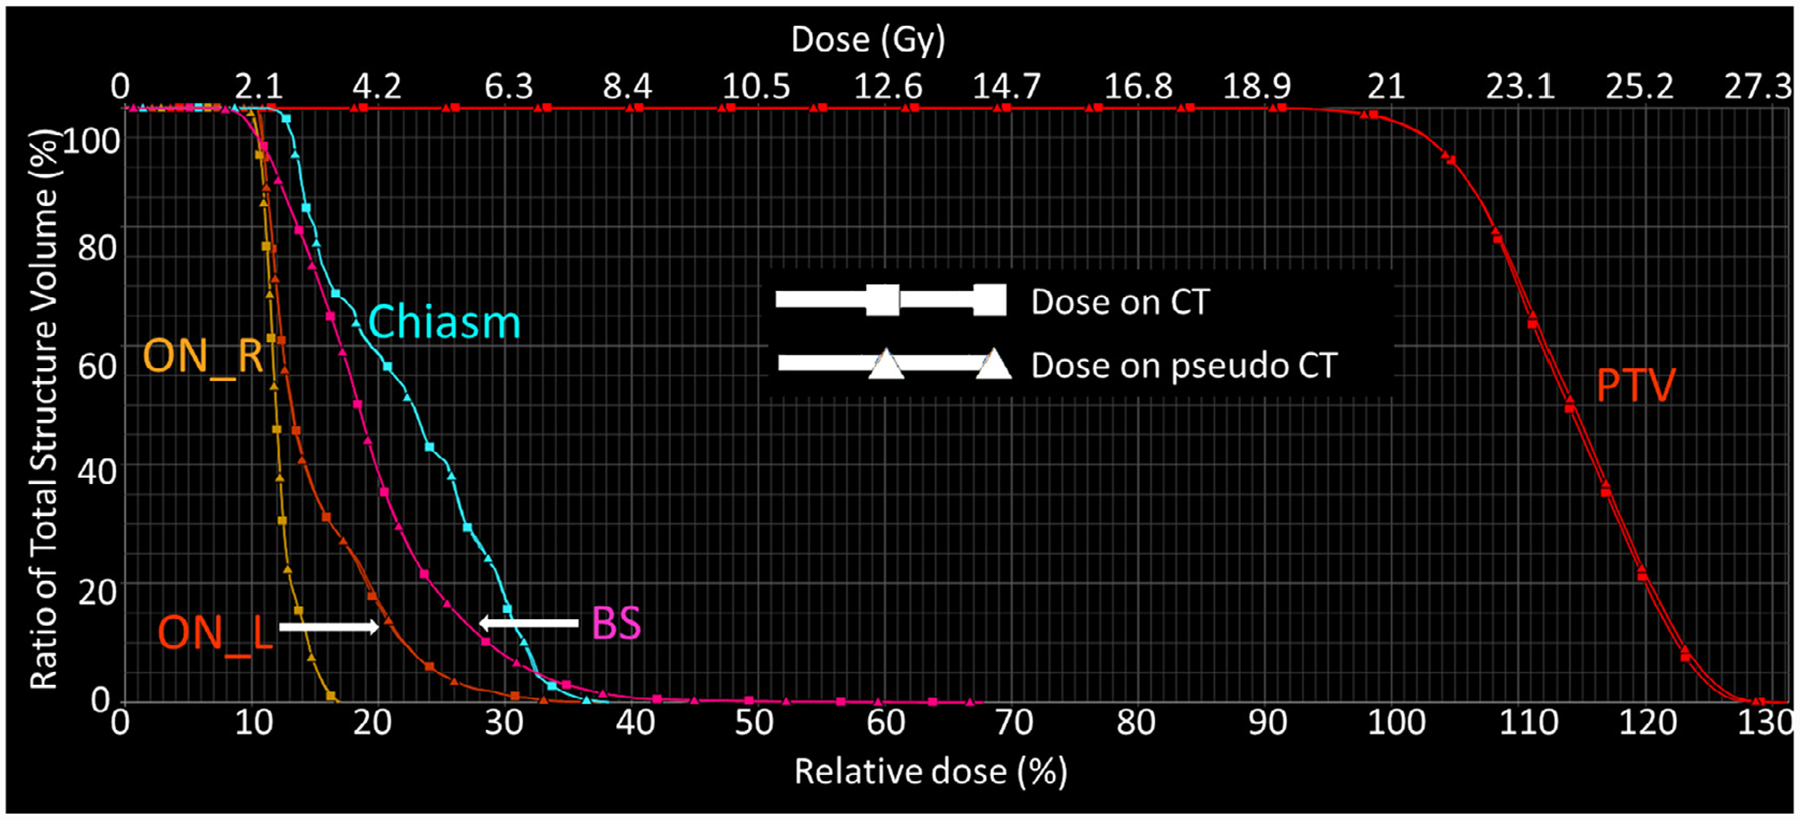
The DVH curves for the PTV, chiasm, brain stem, left optic nerve (ON_L), and right optic nerve (ON_R) of the patient in Fig. 1.
The differences in DVH metrics of PTVs and OARs among all 19 plans are shown by the box plots in Fig. 4 and Fig. 5, respectively. The central mark of each box indicates the median, and the bottom and top edges of the box indicate the 25th and 75th percentiles, respectively. The whiskers extend to the most extreme data points not considered outliers, and the outliers are plotted individually using the “+” symbol. The statistics of DVH metric differences among all 19 plans are summarized in Table 1. STD stands for standard deviation, and the p values we calculated are with null hypothesis of zero dose difference between pseudo CT and original CT. For PTVs, the average differences among 19 plans are less than 0.2 Gy or 0.6% for all metrics. Although the p values of some metrics are less than 0.05 which indicate statistically significant differences, such differences with absolute values less than 0.2 Gy are negligible when compared to the clinically-prescribed dose of around 20 Gy. For selected OARs, the average differences are less than 0.02 Gy and the p values are larger than 0.05 for all metrics, both of which demonstrate the high accuracy of dose calculated for OARs based on pseudo CT.
Fig. 4.
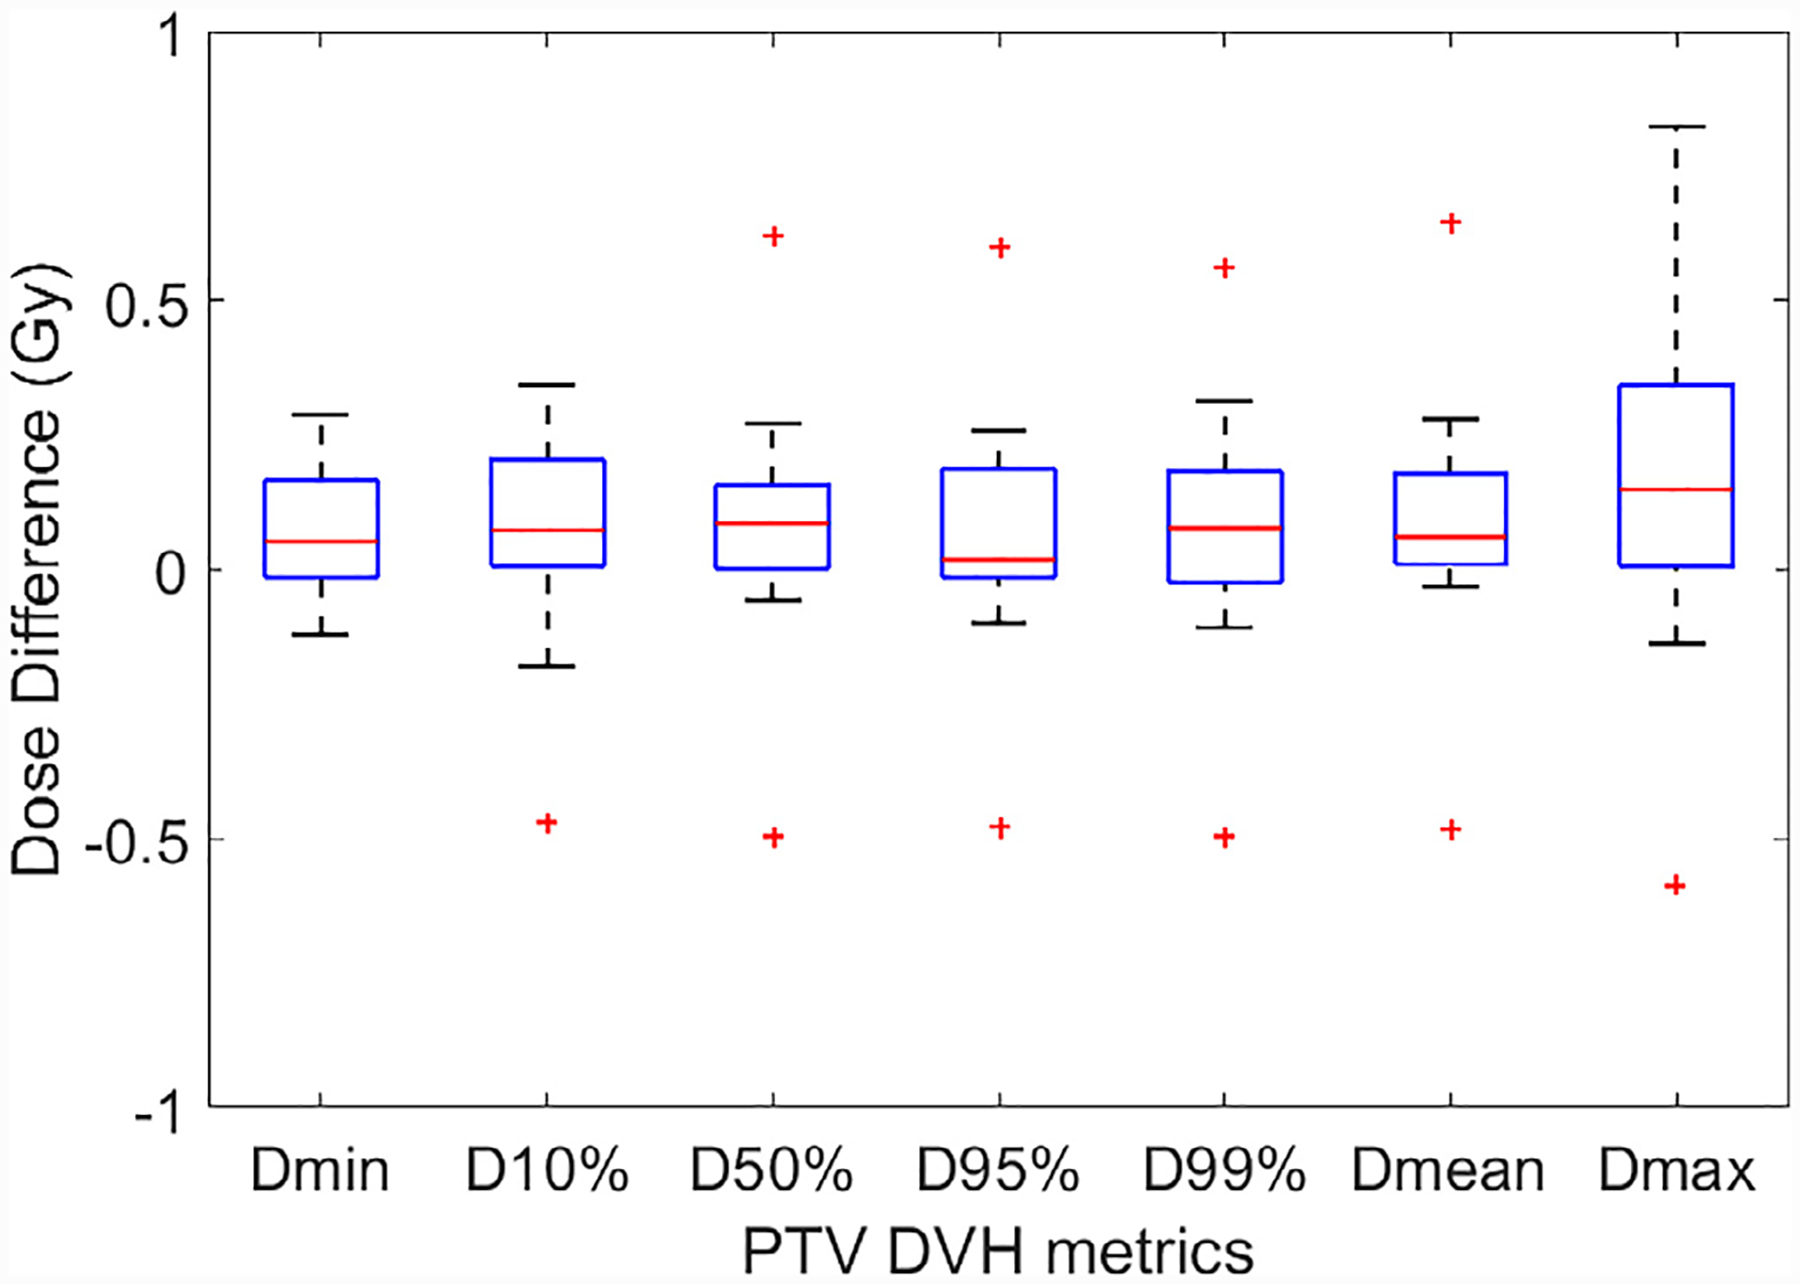
DVH metrics comparison for the PTVs for all 19 plans. The central mark indicates the median, and the bottom and top edges of the box indicate the 25th and 75th percentiles, respectively. The whiskers extend to the most extreme data points not considered outliers, and the outliers are plotted individually using the “+ ” symbol.
Fig. 5.
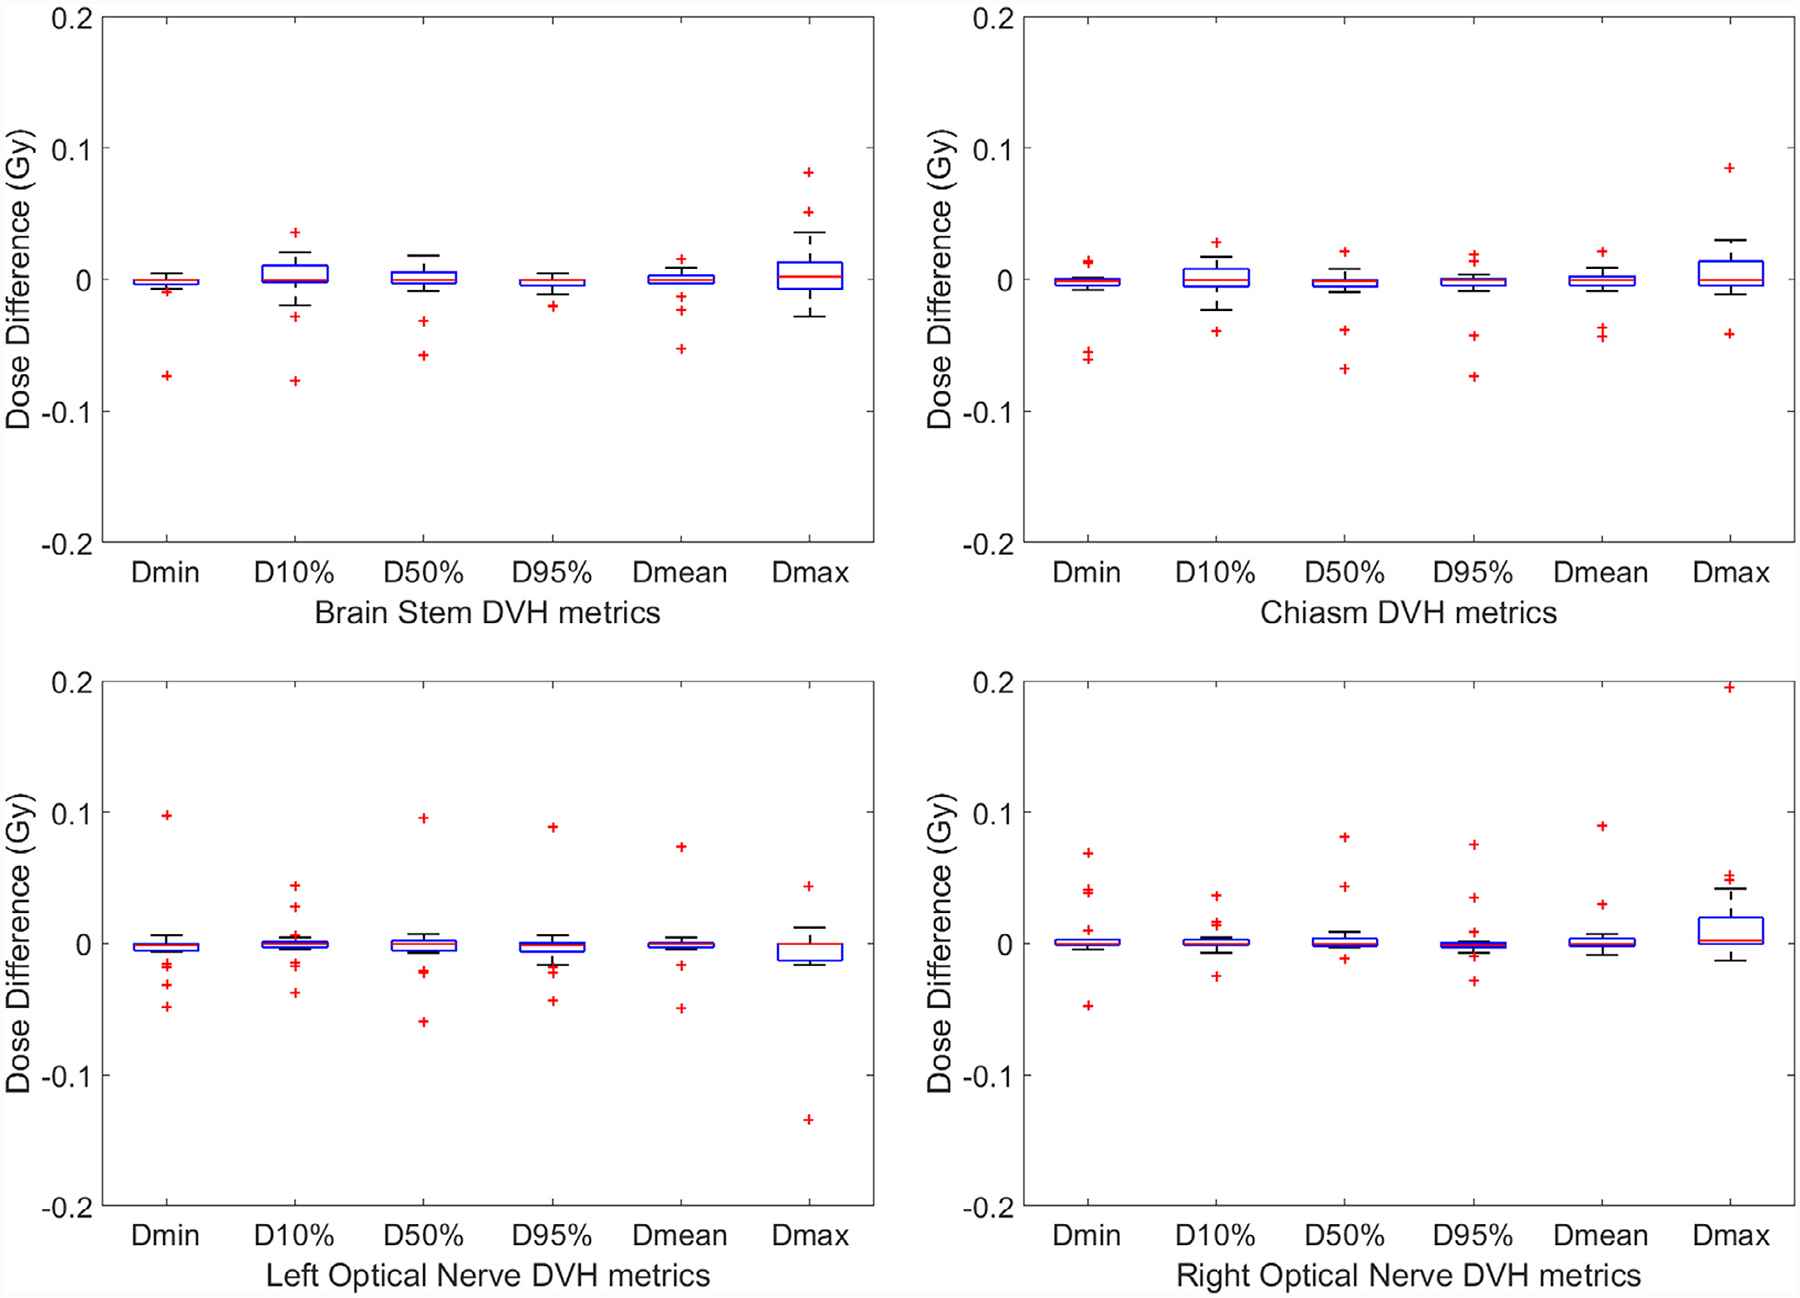
DVH metrics comparison for the chiasm, brain stem, left optic nerve and right optic nerve for all 19 plans. The central mark indicates the median, and the bottom and top edges of the box indicate the 25th and 75th percentiles, respectively. The whiskers extend to the most extreme data points not considered outliers, and the outliers are plotted individually using the “+ ” symbol.
Table 1.
Differences in DVH metrics of PTVs and OARs among all 19 plans
| PTV | Dmin | D10% | D50% | D95% | D99% | Dmean | Dmax |
|---|---|---|---|---|---|---|---|
| Mean | 0.081 | 0.084 | 0.084 | 0.068 | 0.075 | 0.090 | 0.171 |
| ±STD (Gy) | ±0.121 | ±0.191 | ±0.208 | ±0.205 | ±0.210 | ±0.211 | ±0.307 |
| Relative mean | 0.342 | 0.337 | 0.314 | 0.267 | 0.298 | 0.338 | 0.582 |
| ±STD (%) | ±0.542 | ±0.665 | ±0.672 | ±0.718 | ±0.744 | ±0.686 | ±0.940 |
| p value | 0.009 | 0.072 | 0.095 | 0.167 | 0.137 | 0.079 | 0.025 |
| Brain stem | Dmin | D10% | D50% | D95% | Dmean | Dmax | |
| Mean | −0.005 | −0.001 | −0.003 | −0.003 | −0.003 | −0.011 | |
| ±STD (Gy) | ±0.017 | ±0.023 | ±0.016 | ±0.007 | ±0.014 | ±0.089 | |
| p value | 0.202 | 0.844 | 0.442 | 0.062 | 0.408 | 0.596 | |
| Chiasm | Dmin | D10% | D50% | D95% | Dmean | Dmax | |
| Mean | −0.006 | 0.000 | −0.006 | −0.005 | −0.003 | 0.015 | |
| ±STD (Gy) | ±0.019 | ±0.015 | ±0.019 | ±0.020 | ±0.014 | ±0.054 | |
| p value | 0.196 | 0.869 | 0.210 | 0.250 | 0.313 | 0.231 | |
| Left optic nerve | Dmin | D10% | D50% | D95% | Dmean | Dmax | |
| Mean | −0.001 | 0.000 | −0.001 | −0.001 | 0.000 | −0.008 | |
| ±STD (Gy) | ±0.027 | ±0.016 | ±0.028 | ±0.025 | ±0.021 | ±0.033 | |
| p value | 0.824 | 0.912 | 0.915 | 0.855 | 0.949 | 0.328 | |
| Right optic nerve | Dmin | D10% | D50% | D95% | Dmean | Dmax | |
| Mean | 0.005 | 0.002 | 0.007 | 0.003 | 0.006 | 0.019 | |
| ±STD (Gy) | ±0.023 | ±0.012 | ±0.021 | ±0.021 | ±0.022 | ±0.046 | |
| p value | 0.319 | 0.419 | 0.176 | 0.497 | 0.259 | 0.086 |
The dose accuracy of pseudo CT is further evaluated by gamma analysis using 3%/3mm criteria on the axial dose plane at isocenter between pseudo CT and original CT for each plan. The passing rates ranges from 97.5% to 100% with an average of 99.0% and STD of 1.1%.
Conclusions and Discussion
In this study, we evaluated the dose calculation accuracy on pseudo CT images generated from MRI images using our machine-learning-based method in the context of SRS treatments. The side-by-side comparisons on image quality and dose distributions demonstrated very good agreement of image contrast and calculated dose between pseudo CT and original CT. Based on the statistical analysis of comparative DVH metrics between pseudo CT and original CT among 19 SRS plans from 14 patients, we showed that the average differences in DVH metrics for PTVs were less than 0.6%, and no differences in those for OARs at a significance level at 0.05. The high accuracy in dose calculation on pseudo CT is further supported by the gamma analysis study with an average pass rate of 99%. These quantitative results strongly indicate that the pseudo CT images created from MRI images using our machine-learning-based method are accurate enough to replace current CT simulation images for dose calculation in brain SRS treatment. It also demonstrates the great potential of MRI in completely replacing CT scans in the process of simulation and treatment planning.
Currently, the main challenges for MRI-only treatment planning are lack of electron density information for dose calculation by treatment planning systems and geometric distortion in MRI images.21 Our method focuses on solving the first problem, i.e. synthesizing CT images from MRI images to provide electron density information. The second problem has been a very active research topic for decades, since MRI was introduced into clinical practice. In our study, all MRI images were preprocessed using existing software to effectively reduce distortion before training or synthesizing CT. Other novel methods such as real-time image distortion correction method have been reported to have excellent performance, and its combination with our method would definitely facilitate MRI-only simulation.22
In the presented study, we found that the difference of dose distributions in Fig. 2 (a3) was very minimal for the majority of the volume, even in small areas with minor error on the pseudo CT images. It indicates that the dose accuracy on pseudo CT is not sensitive to image errors inside the volume. Slightly larger errors were observed at the surface of body; this could be because dose calculation was not performed outside the body contour and therefore, minimal image differences at the body surface on pseudo CT could lead to the observed dose differences. One cause of image differences in the pseudo CTs could be attributable to residual MRI distortions.23 Moreover, we align the pseudo CT with original CT for evaluation in the same plan. Such alignment could not be perfect and may also contribute to the image difference, especially at the surface of body.
In this current feasibility study, we evaluated our method on brain SRS patients. Although photon plans are more forgiving on certain treatment sites that have relatively homogeneous anatomy (such as the brain) than other sites due to its homogeneity, it is still a challenging but worthy case for evaluation since brain SRS delivers a large amount of dose in to a very small volume, which is very sensitive to any errors in pseudo CT. A variety of lesion sites of brain and both volumetric arc therapy and dynamic conformal arc plans were included in our dataset. The dose differences between pseudo CT and original CT seems very minimal among different plans and patients, and we do not observe noticeable differences among certain types of lesion sites or techniques. Thus, we can conclude that the accuracy of calculated dose on pseudo CT varies little among different plans and patients, and pseudo CT can be used for dose calculation for various treatment sites and techniques for brain SRS. For other sites which have a considerable amount of anatomical heterogeneities (e.g., bone-tissue or air–tissue interfaces), additional challenges may be expected. Future work will extend this study to include more treatment regions such as pelvis, more techniques such as Stereotactic Body Radiation Therapy (SBRT), and exploring the optimal imaging sequence for MRI to achieve best dose calculation accuracy.
Acknowledgement
This research is supported in part by the National Cancer Institute of the National Institutes of Health under Award Number R01CA215718, the Department of Defense (DoD) Prostate Cancer Research Program (PCRP) Award W81XWH-13-1-0269 and Dunwoody Golf Club Prostate Cancer Research Award, a philanthropic award provided by the Winship Cancer Institute of Emory University.
Footnotes
Conflict of Interest
The author declares no conflicts of interest.
References
- 1.Khoo VS; Joon DL New developments in MRI for target volume delineation in radiotherapy [published online ahead of print 2006/09/19]. Br. J. Radiol 79 (Spec No 1):S2–15; 2006. [DOI] [PubMed] [Google Scholar]
- 2.Nyholm T; Nyberg M; Karlsson MG; et al. Systematisation of spatial uncertainties for comparison between a MR and a CT-based radiotherapy workflow for prostate treatments. Radiat. Oncol 4 :54; 2009. [DOI] [PMC free article] [PubMed] [Google Scholar]
- 3.Ulin K; Urie MM; Cherlow JM Results of a multi-institutional benchmark test for cranial CT/MR image registration. Int. J. Radiat. Oncol. Biol. Phys 77 :1584–9; 2010. [DOI] [PMC free article] [PubMed] [Google Scholar]
- 4.van der Heide UA; Houweling AC; Groenendaal G; et al. Functional MRI for radiotherapy dose painting. Magn. Reson. Imaging 30 :1216–23; 2012. [DOI] [PMC free article] [PubMed] [Google Scholar]
- 5.Devic S MRI simulation for radiotherapy treatment planning. Med. Phys 39 :6701–11; 2012. [DOI] [PubMed] [Google Scholar]
- 6.Lagendijk JJW; Raaymakers BW; Raaijmakers AJE; et al. MRI/linac integration. Radiother. Oncol 86 :25–9; 2008. [DOI] [PubMed] [Google Scholar]
- 7.Fallone BG; Murray B; Rathee S; et al. First MR images obtained during megavoltage photon irradiation from a prototype integrated linac-MR system. Med. Phys 36 :2084–8; 2009. [DOI] [PubMed] [Google Scholar]
- 8.Lee YK; Bollet M; Charles-Edwards G; et al. Radiotherapy treatment planning of prostate cancer using magnetic resonance imaging alone. Radiother. Oncol 66 :203–16; 2003. [DOI] [PubMed] [Google Scholar]
- 9.Jonsson JH; Karlsson MG; Karlsson M; et al. Treatment planning using MRI data: an analysis of the dose calculation accuracy for different treatment regions. Radiat. Oncol 5 :62; 2010. [DOI] [PMC free article] [PubMed] [Google Scholar]
- 10.Lambert J; Greer PB; Menk F; et al. MRI-guided prostate radiation therapy planning: Investigation of dosimetric accuracy of MRI-based dose planning. Radiother. Oncol 98 :330–4; 2011. [DOI] [PubMed] [Google Scholar]
- 11.Kristensen BH; Laursen FJ; Løgager V; et al. Dosimetric and geometric evaluation of an open low-field magnetic resonance simulator for radiotherapy treatment planning of brain tumours. Radiother. Oncol 87 :100–9; 2008. [DOI] [PubMed] [Google Scholar]
- 12.Johansson A; Karlsson M; Nyholm T CT substitute derived from MRI sequences with ultrashort echo time. Med. Phys 38 :2708–14; 2011. [DOI] [PubMed] [Google Scholar]
- 13.Hsu S-H; Cao Y; Huang K; et al. Investigation of a method for generating synthetic CT models from MRI scans of the head and neck for radiation therapy. Phys. Med. Biol 58 :8419; 2013. [DOI] [PMC free article] [PubMed] [Google Scholar]
- 14.Dowling JA; Lambert J; Parker J; et al. An atlas-based electron density mapping method for magnetic resonance imaging (MRI)-alone treatment planning and adaptive MRI-based prostate radiation therapy. Int. J. Radiat. Oncol. Biol. Phys 83 :e5–e11; 2012. [DOI] [PubMed] [Google Scholar]
- 15.Uh J; Merchant TE; Li Y; et al. MRI-based treatment planning with pseudo CT generated through atlas registration. Med. Phys 41 :051711; 2014. n/a. [DOI] [PMC free article] [PubMed] [Google Scholar]
- 16.Sjölund J; Forsberg D; Andersson M; et al. Generating patient specific pseudo-CT of the head from MR using atlas-based regression. Phys. Med. Biol 60 :825; 2015. [DOI] [PubMed] [Google Scholar]
- 17.Aouadi S; Vasic A; Paloor S; et al. Sparse patch-based method applied to mri-only radiotherapy planning. Phys. Med 32 (Supplement 3):309; 2016. [Google Scholar]
- 18.Huynh T; Gao Y; Kang J; et al. Estimating CT image from mri data using structured random forest and auto-context model. IEEE Trans. Med. Imaging 35 :174–83; 2016. [DOI] [PMC free article] [PubMed] [Google Scholar]
- 19.Han X MR-based synthetic CT generation using a deep convolutional neural network method [published online ahead of print 2017/02/14]. Med Phys 44 :1408–19; 2017. [DOI] [PubMed] [Google Scholar]
- 20.Yang X; Lei Y; Shu H-K; et al. Pseudo CT estimation from MRI using patch-based random forest Paper presented at: SPIE Medical Imaging; 2017. [DOI] [PMC free article] [PubMed] [Google Scholar]
- 21.Blomqvist L, Bäck A, Ceberg C, et al. MR in radiotherapy—an important step towards personalized treatments. Report from the SSM’s Scientific Council on Ionizing Radiation within Oncology SSM. 2013. [Google Scholar]
- 22.Crijns SP; Raaymakers BW; Lagendijk JJ Real-time correction of magnetic field inhomogeneity-induced image distortions for MRI-guided conventional and proton radiotherapy. Phys. Med. Biol 56 :289–97; 2011. [DOI] [PubMed] [Google Scholar]
- 23.Walker A; Liney G; Metcalfe P; et al. MRI distortion: considerations for MRI based radiotherapy treatment planning. Australas. Phys. Eng. Sci. Med 37 :103–13; 2014. [DOI] [PubMed] [Google Scholar]