Abstract
Background
To evaluate the impact of respiratory-averaged computed tomography attenuation correction (RACTAC) compared to standard single-phase computed tomography attenuation correction (CTAC) map, on the quantitative measures of coronary atherosclerotic lesions of 18F-sodium fluoride (18F-NaF) uptake in hybrid positron emission tomography and computed tomography (PET/CT).
Methods
This study comprised 23 patients who underwent 18F-NaF coronary PET in a hybrid PET/CT system. All patients had a standard single-phase CTAC obtained during free-breathing and a 4D cine-CT scan. From the cine-CT acquisition, RACTAC maps were obtained by averaging all images acquired over 5 seconds. PET reconstructions using either CTAC or RACTAC were compared. The quantitative impact of employing RACTAC was assessed using maximum target-to-background (TBRMAX) and coronary microcalcification activity (CMA). Statistical differences were analyzed using reproducibility coefficients and Bland-Altman plots.
Results
In 23 patients, we evaluated 34 coronary lesions using CTAC and RACTAC reconstructions. There was good agreement between CTAC and RACTAC for TBRMAX (median [Interquartile range]): CTAC= 1.65[1.23–2.38], RACTAC= 1.63[1.23–2.33], p=0.55), with coefficient of reproducibility of 0.18, and CMA: CTAC= 0.10 [0–1.0], RACTAC= 0.15[0–1.03], p=0.55 with coefficient of reproducibility of 0.17
Conclusion
Respiratory-averaged and standard single-phase attenuation correction maps provide similar and reproducible methods of quantifying coronary 18F-NaF uptake on PET/CT.
Keywords: Respiration-averaged CT attenuation correction, Motion correction, PET/CT, Cardiac PET, 18F-sodium fluoride, Vulnerable plaque, Coronary Microcalcification Activity
Introduction
Hybrid positron emission tomography and computed tomography (PET/CT) imaging with 18F-sodium fluoride (18F-NaF) has been successfully employed for the assessment of atherosclerotic disease activity in the coronary arteries and can potentially identify high-risk plaques (1–4). Currently, hybrid 18F-NaF PET/CT scans are obtained utilizing a 30-min PET acquisition in listmode format, followed by PET image reconstructions employing four or ten cardiac phases with either breath-hold or free-breathing CT attenuation correction (CTAC) maps (5–7). Previous studies on myocardial perfusion and viability have shown that misalignment of the PET emission data and the CTAC maps pose risks of false-positive findings in the clinical setting (8, 9), with loss in the predictive value if not corrected for motion (10). To ameliorate this problem, realignment of the CTAC maps and PET emission data before PET image reconstruction is sometimes required to obtain optimal predictive value (11). However, single-phase CTAC maps affect the quantitative accuracy of myocardial viability studies owing to the continuous respiratory translations during the PET emission acquisitions(12–15). Previous studies employing respiratory averaged CTAC maps (RACTAC), obtained from cine-CT scans can improve the quantitative accuracy in myocardial perfusion and viability studies(16, 17). Recently, 18F-NaF PET has been established as a non-invasive imaging modality to identify high-risk and ruptured coronary atherosclerotic plaques(1, 3, 18, 19). Quantitative accuracy and reproducibility of imaging this tracer will be critical to establish its clinical value. However, the quantitative accuracy of lesion micro-calcification activity assessed with 18F-NaF PET and RACTAC for attenuation correction has not yet been evaluated.
In this study, we aimed to evaluate the quantitative impact of using RACTAC on 18F-NaF uptake measurements, and to compare RACTAC and CTAC maps for the reconstruction of PET images (Figure 1). To this end, we aimed to compare the quantification of individual lesions using target-to-background ratios (TBR) and whole-vessel and entire coronary tree microcalcification burden using coronary microcalcification activity (CMA) assessments (2, 20, 21).
Figure 1.
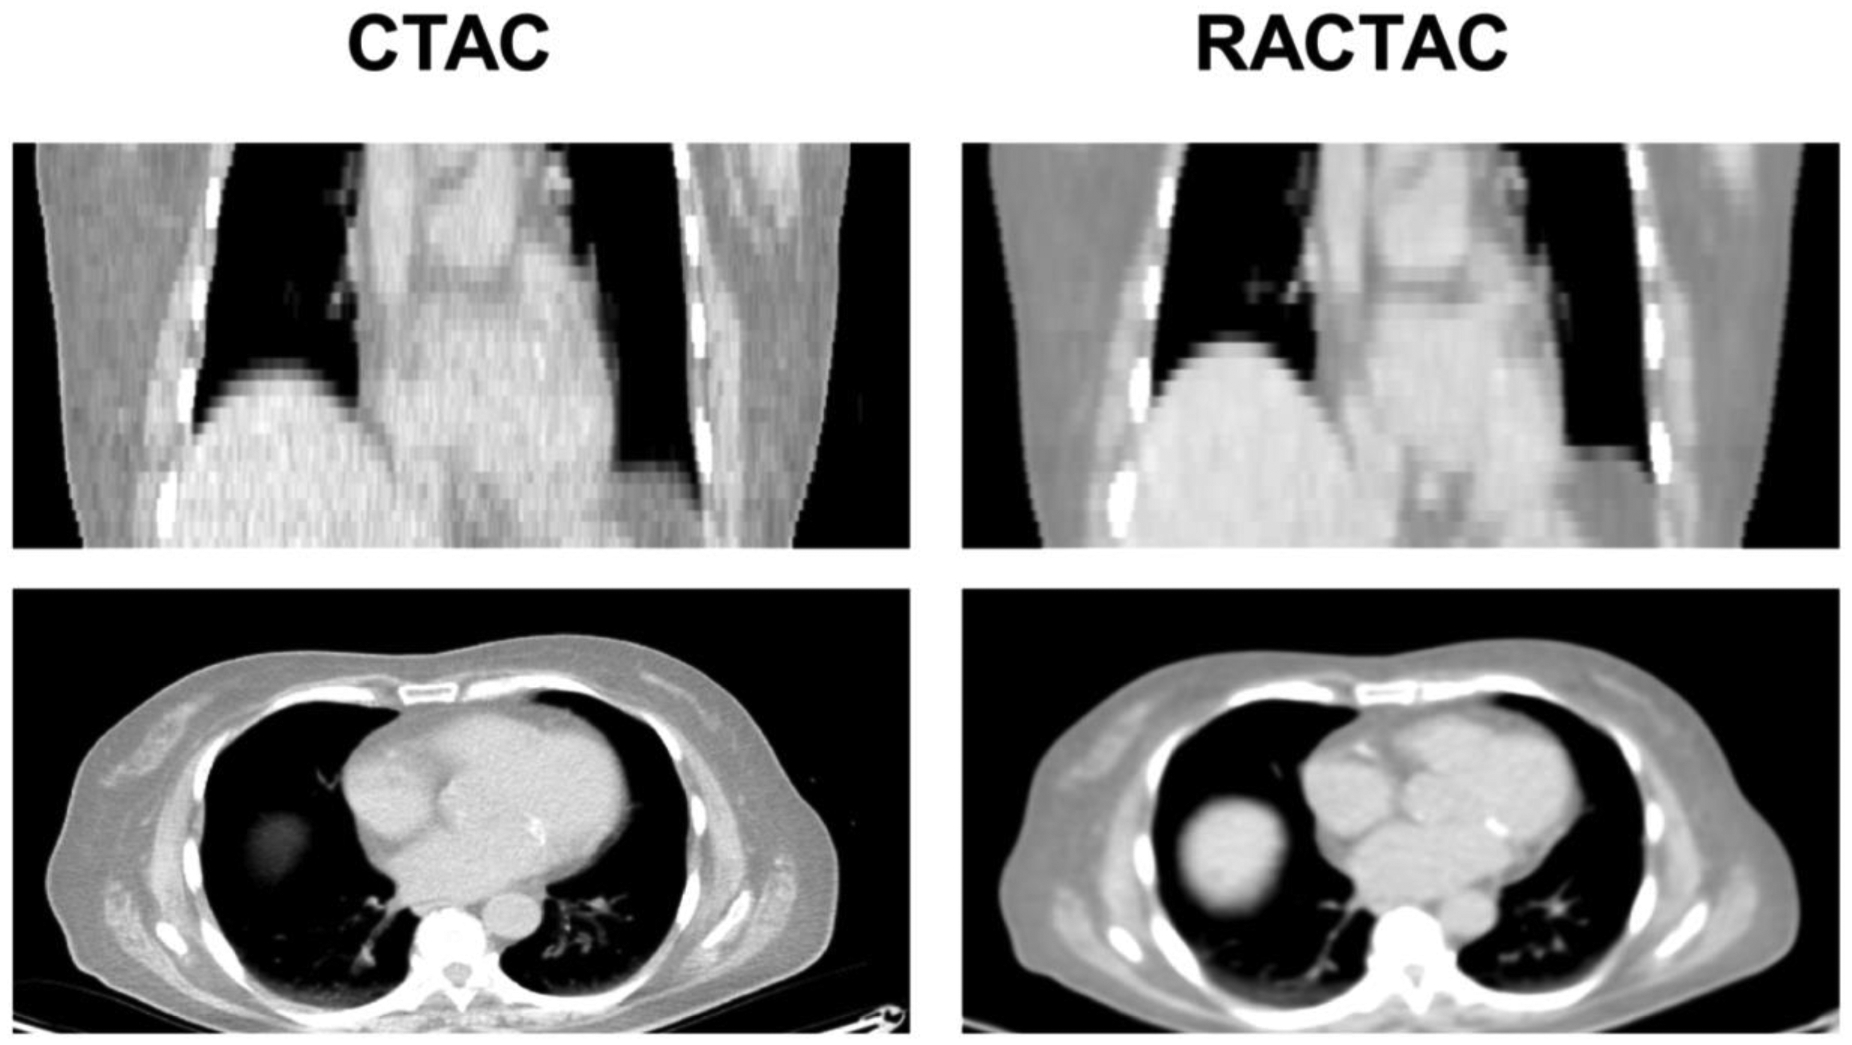
Standard attenuation map-CTAC (left) vs respiratory average CT attenuation maps-RACTAC (right). Coronal (top) and transverse (bottom) images.
Materials and Methods
Study population
Twenty-three patients underwent hybrid 18F-NaF PET/CT examinations of the coronary arteries as part of the ongoing Effect of Evolocumab on Coronary Artery Plaque Volume and Composition by CCTA and Microcalcification by 18F-NaF PET study (NCT03689946)(22). Patient demographics are shown in Table 1. Inclusion in the study required a Coronary Computed Tomography Angiography (CCTA) defined high non-calcified coronary artery plaque volume (>440 mm3). Exclusion criteria were as follows: renal dysfunction (serum creatinine > 1.5 mg/dL) prior to imaging, history of allergy to iodine contrast agents, allergy to evolocumab, women who are breastfeeding, active atrial fibrillation, history of coronary artery bypass graft surgery , inability to lie flat, inability or unwilling to give informed consent, major illness or life expectancy <1 year, planned coronary revascularization or major non-cardiac surgery in the next 12 months, previous or current evolocumab use.
Table 1.
| Age (SD) | 66±10 |
| Sex (Males) | 21 (78%) |
| BMI (SD) | 27±4 |
| Hyperlipidemia | 24 (89%) |
| Hypertension | 14 (52%) |
| Diabetes | 5 (18%) |
| Smoker/ex-smoker | 7 (26%) |
| Total Plaque Volume (mm3) | 837 [620–1066] |
| Total NCP Volume (mm3) | 711 [55—859] |
| Total Calcified Volume (mm3) | 103 [43–205] |
Continuous variables reported as mean ± SD or median [interquartile range]; categorical variables reported as n (%), BMI: Body mass index, NCP: Non-calcified plaque
Imaging protocol
CCTA acquisition
The CCTA was acquired the same day as the PET scan for 13 patients, while the remaining cases (n=10) had the CCTA within 21 days (range=2–21 days). All patients were scanned with arms positioned above the head in a 192-slice Somatom Force Dual Source mCT system (Siemens Healthineers, Knoxville, TN, USA). The CCTA imaging parameters included prospective gating, 250 ms rotation time, body-mass index (BMI) dependent voltage (<25 kg/m2, 100 kV; ≥25 kg/m2, 120 kV), and tube-current time product of 160–245 mAs. Patients were administered beta-blockers (orally or intravenously) to achieve a target heart rate of <60 beats/min, followed by a BMI-dependent bolus-injection of contrast media (400 mg/mL) with a flow of 5–6 mL/s after determining the appropriate trigger delay defined by a test bolus of 20 mL of contrast material.
PET acquisition
Following the CCTA acquisition (at the same day or different day within a 21 days period as described above), all patients underwent 18F-NaF positron emission tomography (PET), with arms positioned above the head on a hybrid PET-CT scanner (Discovery 710, GE Healthcare, Milwaukee, WI, USA). Prior to imaging, subjects were administered with a target dose of 250 MBq of 18F-NaF and rested in a quiet environment for 180 min (Figure 2). All patients underwent 30 min PET emission acquisitions, using a standard 3-lead electrocardiogram using a free-breathing protocol, where the patients were advised to relax.
Figure 2.
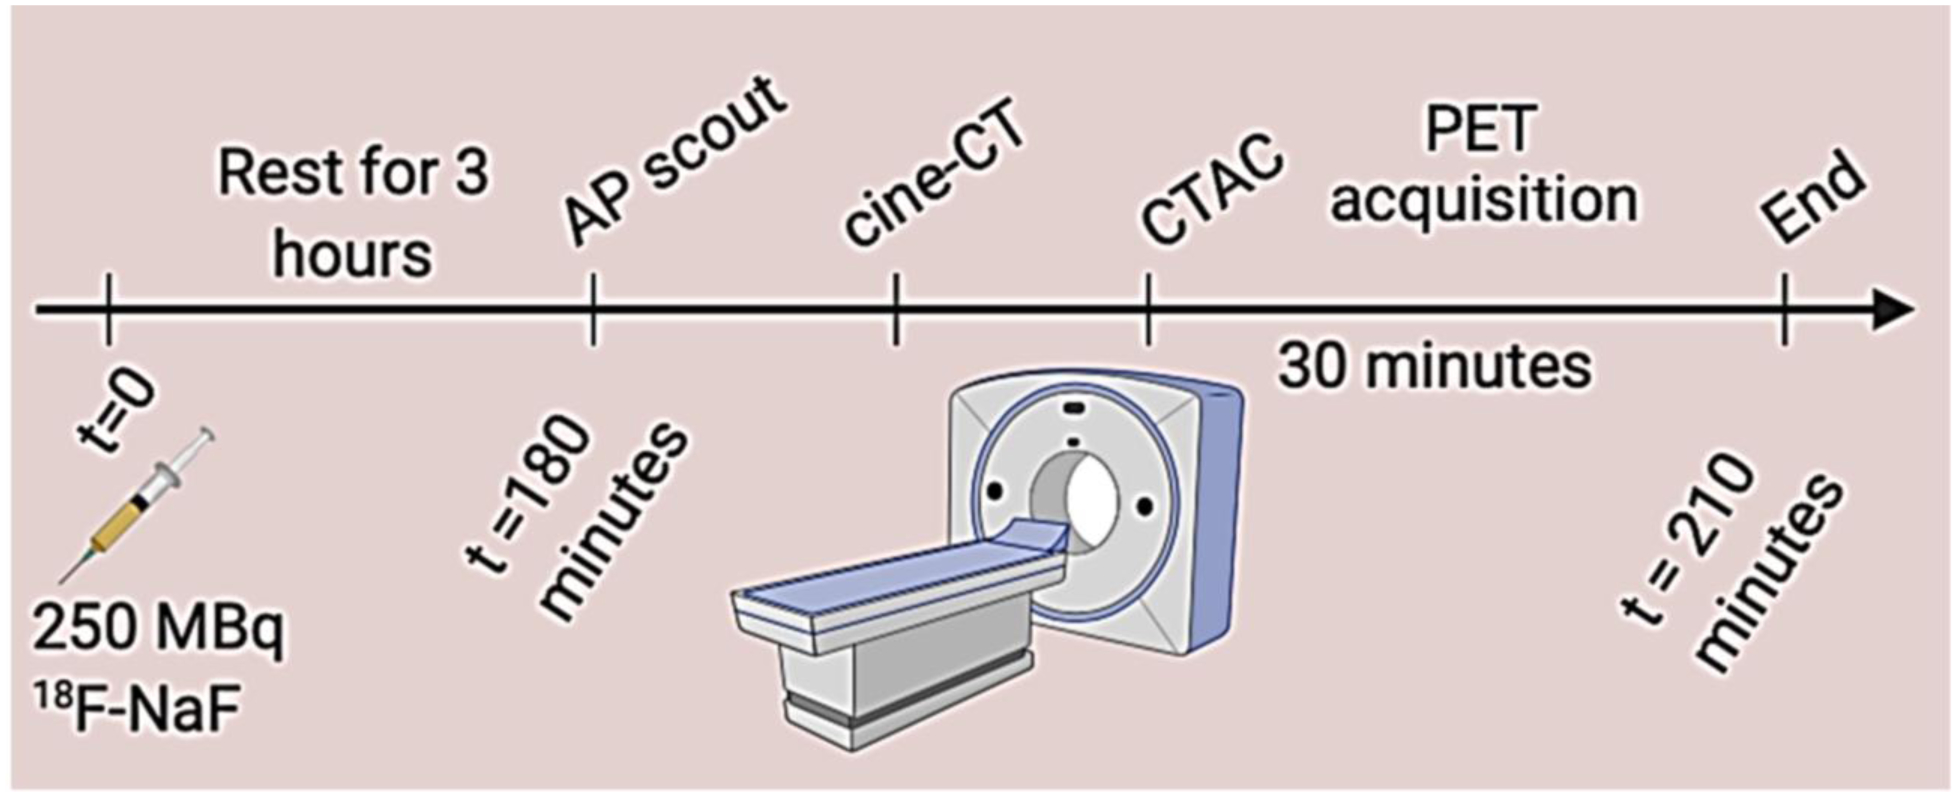
Imaging protocol for PET acquistion. All patients were scanned with arms positioned above the head.
AP: anteroposterior, CTAC: coronary tomography attenuation correction, PET: positron emission tomography
Cine-CT and standard CT attenuation correction acquisitions.
Prior to the PET scans, an anteroposterior scout at 100 kV and 10 mA was obtained starting from the pulmonary artery bifurcation and extending to the diaphragm. Using the anatomical information, 4D cine-CT data were acquired with the following settings: 120 kV, 10 mA, slice thickness 2.5 mm, 0.8 sec/rotation, axial coverage of 14 cm, 7 cine acquisitions, and cine duration of 5 sec. Simultaneously with the cine-CT scan, we acquired information on the respiratory signal and its periodicity to perform quality-checks on the respiratory averaged CTAC maps using the Varian RPM system (Varian Medical Systems). In addition to the cine-CT scan, a standard AC map was acquired at the following settings: 100 kV, 40 mA, 0.5 second/rotation, 1.375 pitch factor, 5-mm slice thickness with an axial field of view of 15.4 cm, and acquisition time of 1.5 sec. The total radiation doses of 4D cine-CT and standard AC maps were 1.4 mSv and 0.8 mSv, respectively.
RACTAC map.
From the CINE CT acquisition, we created RACTAC maps from averaging the CT images acquired over 5 seconds (Figure 1). To compensate for the reduced field-of-view, the RACTAC (axial coverage = 14 cm) was patched with the standard CT AC map (axial coverage = 15.4cm) for the missing 1.4 cm. In addition, the RACTAC maps were interpolated to obtain the same resolution in the axial direction as the standard CTAC map to preserve accurate attenuation correction of the PET images. Both the CTAC and the RACTAC maps were used for attenuation correction using a vendor-provided reconstruction toolbox.
PET reconstruction.
The acquired electrocardiography-gated raw data (list mode dataset) were reconstructed using a standard ordered expectation-maximization algorithm with time of flight, and resolution recovery using 4 cardiac bins. All images were reconstructed using a 256 × 256 matrix (47 slices) employing 4 iterations and 24 subsets, followed by a 5-mm Gaussian post-filtering.
Two series of PET images, one employing CTAC and another with RACTAC, were reconstructed into using a vendor-provided software (REGRECON-REL5, General Electric, Wisconsin, USA).
Post reconstruction Cardiac motion correction
Cardiac motion-corrected images were obtained from the gated PET reconstructions through PET-PET image co-registration using a diffeomorphic registration(23). This technique enables alignment of all gates to the end-diastolic position and as a result, allows for inclusion of all PET counts acquired. We used dedicated coronary PET imaging software for image analysis (FusionQuant, Cedars-Sinai Medical Center)(18).
PET quantification
Background blood pool clearance correction
To minimize the impact of variations in background blood pool activity introduced by variations in the injection-to-scan delays (6), we standardized the background blood pool activity to an injection-to-scan delay of 180 minutes using a previously described correction factor (6) (Eq. 1)
| (1) |
where t represents the injection-to-scan delay in minutes.
TBRMAX quantification
TBRMAX was obtained using a previously described protocol (2). In brief, for individual atherosclerotic lesions, the 18F-NaF uptake was evaluated employing maximum standardized uptake values (SUVmax) obtained within 3D spherical volumes of interest (VOI) (radius 5 mm) placed on the lesions with 18F-NaF focal uptake. TBRMAX values were calculated by normalizing the atherosclerotic SUVMAX values by the injection-to-scan delay corrected blood pool activity measured in the right atrium (cylindrical volume of interest radius 10 mm and thickness 5 mm) at the level of the right coronary artery ostium. Lesion SUVmax and TBRmax were evaluated using the same VOIs for both reconstructions, using VOIs inserted on PET images reconstructed using CTAC as reference.
CMA quantification
To obtain the CMA(2) values, two distinct steps were performed. First, we selected the proximal and distal end of the vessel (>2 mm) and applied a vessel tracking algorithm to extract whole-vessel tubular 3D volumes of interest from CCTA using dedicated semi-automated Autoplaque software (Cedars-Sinai Medical Center, Los Angeles, CA)(24). In a tubular VOI, along the extracted centerlines, with 4-mm diameter, we measured the coronary microcalcification activity (CMA) on the PET/CT co-registered images. CMA was defined as the average SUV within the activity volume above a threshold established as the mean background SUV +2 standard deviations. The background activity was measured in the right atrium. In order to evaluate the total uptake, we added the CMA activity of all epicardial vessels (CMAtotal).
Offset calculation between CTAC and RACTAC
Offsets obtained for the two attenuation correction maps were measured in 3D, using the aortic valve as a point of reference for the translations observed in the heart. All offsets were calculated using the standard CTAC maps as the reference, serving as a gold standard for the assessments.
Statistical analysis
The data were tested for normality using the Shapiro–Wilk test. Statistical analysis was performed using MedCalc Statistical Software version 19.1.7 (MedCalc Software bv, Ostend, Belgium). Continuous, normally distributed variables were presented as mean ±SD (standard deviation), whereas non-normally distributed continuous data were presented as median [range]. We assessed CMA and TBRMAX, using descriptive statistics and Bland–Altman plots, as well as coefficients of reproducibility. Boxplots were designed using R 3.5.0 and statistical significance of the difference between the correlated variances was calculated using the Pitman Morgan test; a two-sided p value <0.05 was considered significant.
Results
Twenty-three patients underwent hybrid 18F-NaF PET/CT examinations of the coronary arteries. A total of 34 coronary lesions were identified on reconstructions on both PET corrected with CTAC and RACTAC maps (Figure 3). Across all patients, the median (IQR) offset for the CTAC and RACTAC maps were calculated to be 5.4 mm (2.2 mm – 9.9mm).
Figure 3.
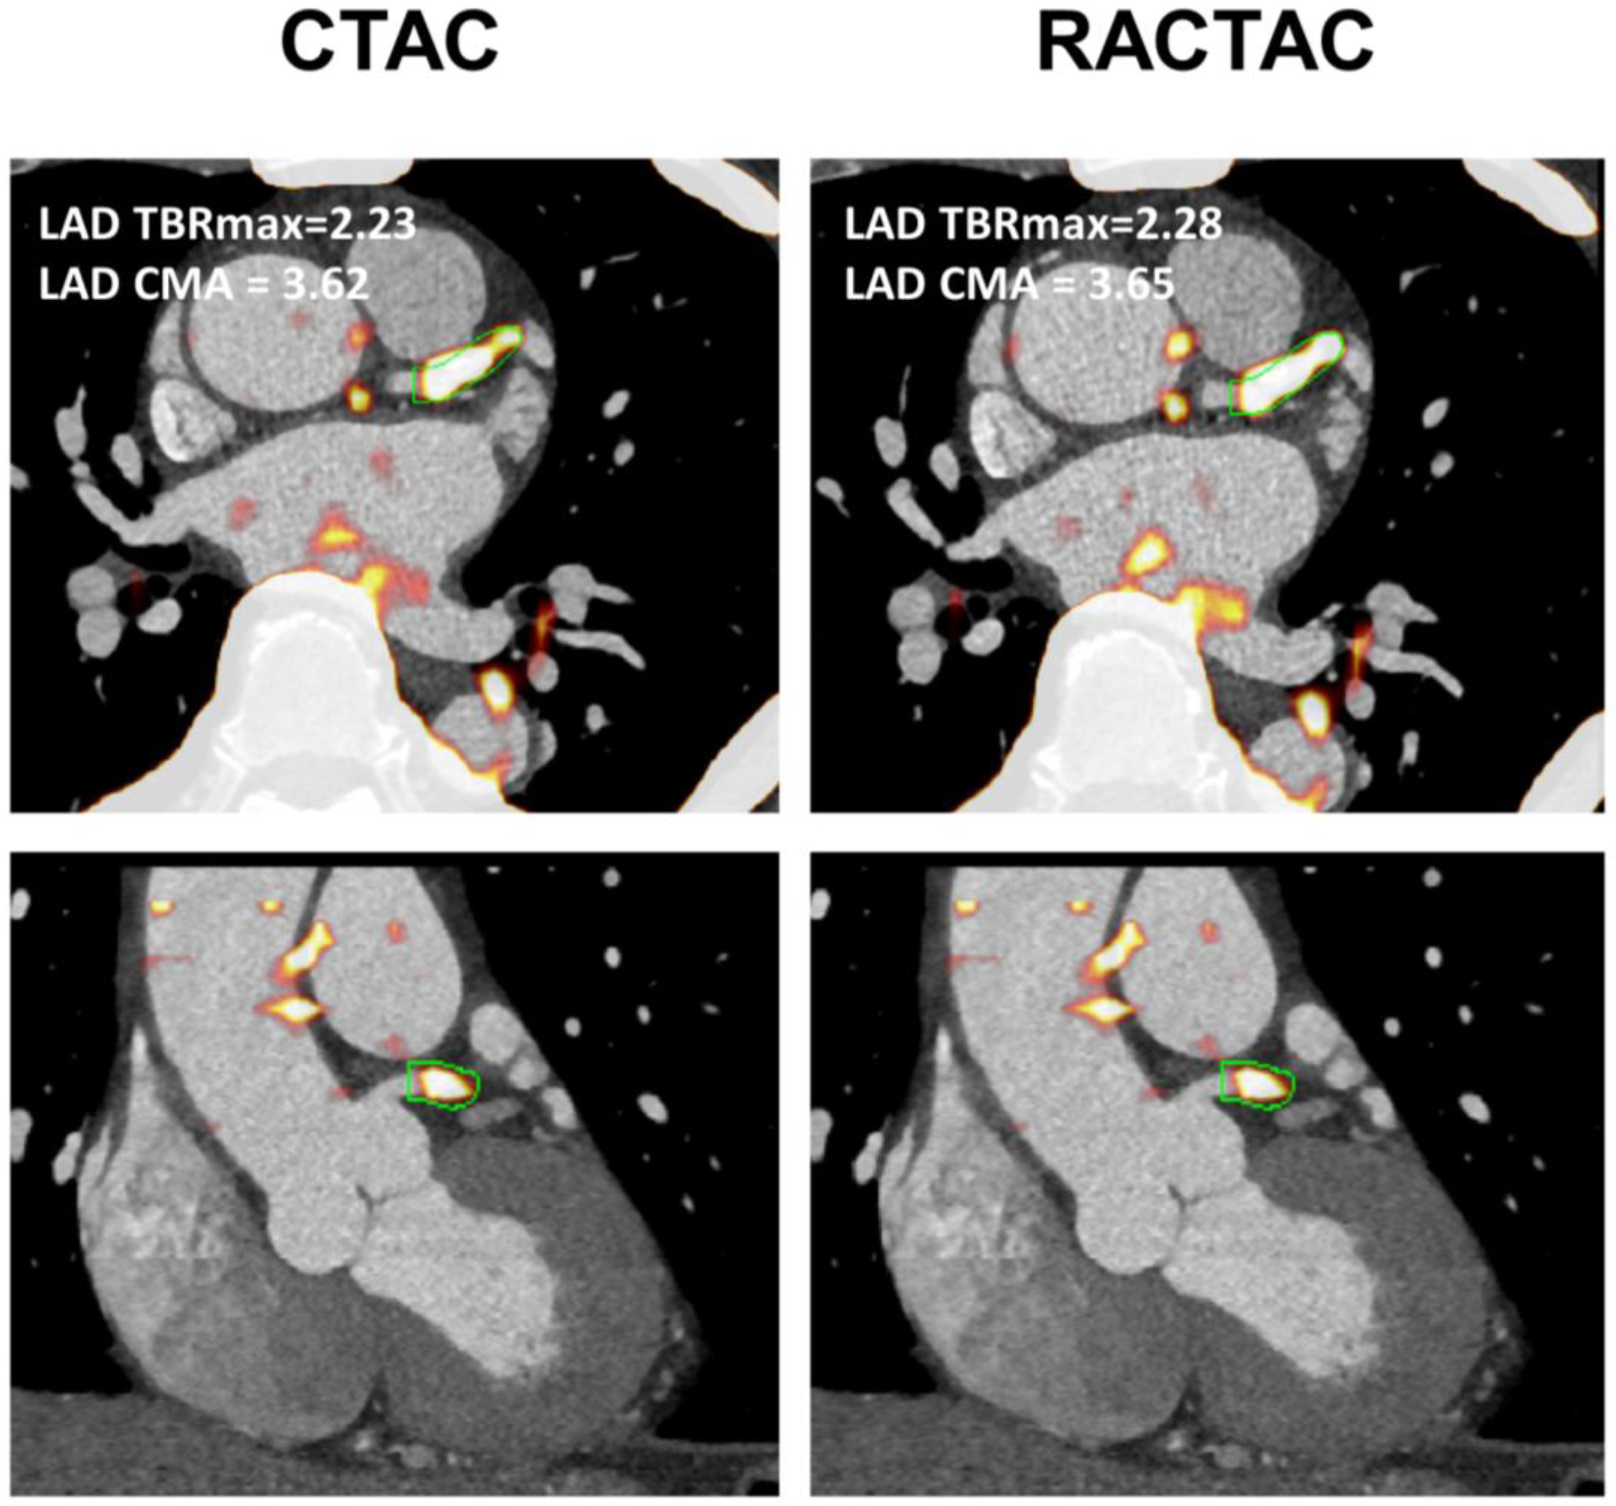
Left anterior descending artery 18F-NaF uptake. Left panel shows fused CTA and PET images reconstructed using the CTAC maps, whereas right shows the same CTA fused with PET an image reconstructed using RACTAC. There is good agreement between the measurements.
CTA = computed tomography angiography, CTAC = Computed Tomography Attenuation Correction and RACTAC = Respiratory averaged computed tomography attenuation correction.
Per-lesion analyses (TBR)
TBR values obtained using the same delineation of the lesions for reconstructions employing CTAC and RACTAC were similar (median TBRmax [Interquartile range; IQR]: CTAC = 1.65 [1.23–2.38], RACTAC = 1.63 [1.23–2.33], p =0.55). (Figure 4, A). Good agreement of the TBR measures obtained using the two different attenuation correction techniques was observed with coefficient of reproducibility of 0.18 (Figure 4, B).
Figure 4.
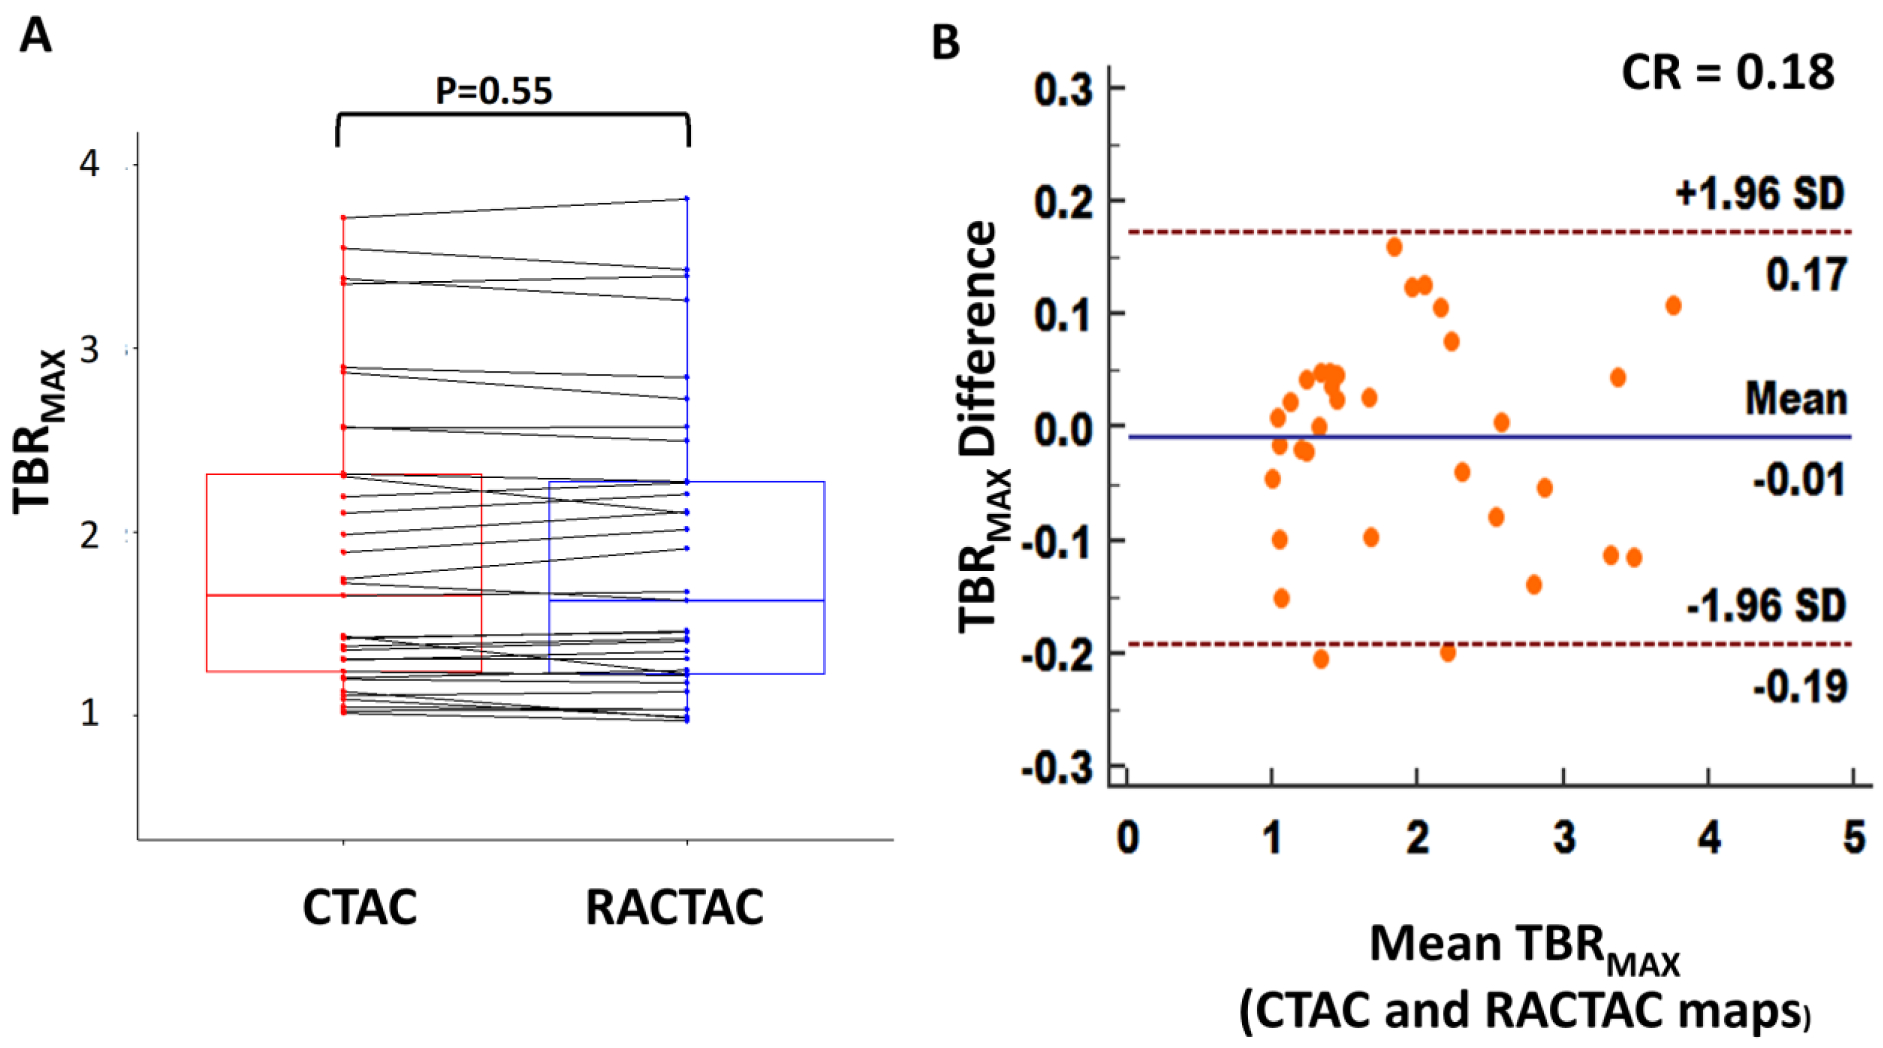
A) Boxplot with connecting lines between the TBRmax measurements using the RACTAC maps vs CTAC maps (blue and red boxes represent interquartile range, with a thick solid line inside represents the median), B) Bland-Altman plot of the differences between the TBRmax measured using RACTAC maps vs CTAC maps.
TBRmax = maximum Target to background ratio, CTAC = Computed Tomography Attenuation Correction and RACTAC = Respiratory averaged computed tomography attenuation correction, CR = coefficient of reproducibility
Per vessel analyses (CMA)
Assessments of the individual vessel microcalcification burden (CMA) revealed no major differences between PET images reconstructed using CTAC and RACTAC scans (median [IQR] CMA: CTAC = 0.10 [0–1.0], RACTAC = 0.15 [0–1.03], p=0.19) (Figure 5, A). Bland-Altman plots of the CMA values revealed a high degree of agreement when comparing the per vessel burden (Figure 5, B), with coefficient of reproducibility of 0.17.
Figure 5.
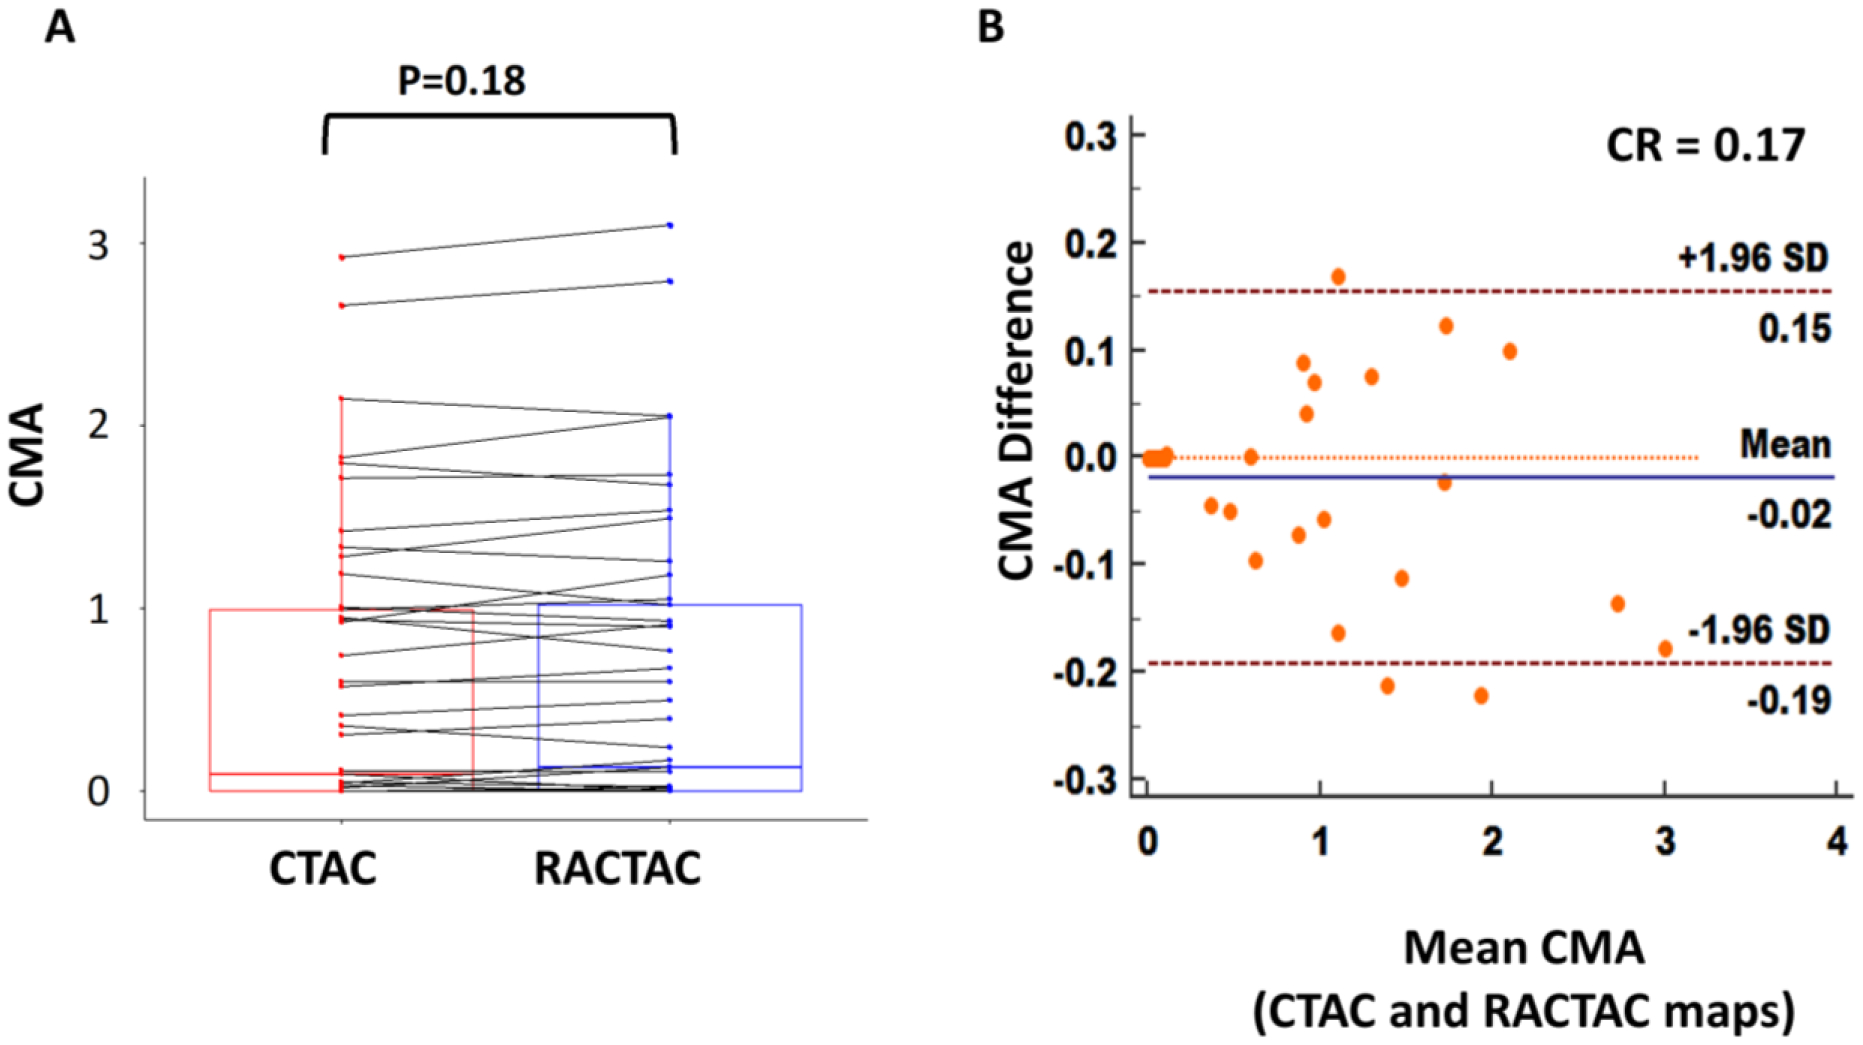
A) Boxplot with connecting lines between the CMA measurements using the RACTAC maps vs CTAC maps (blue and red boxes represent interquartile range, with thick solid line inside represents the median), B) Bland-Altman plot of the differences between the CMA measured using RACTAC maps vs CTAC maps.
CMA = coronary microcalcification activity, CTAC = Computed Tomography Attenuation Correction and RACTAC = Respiratory averaged computed tomography attenuation correction, CR = coefficient of reproducibility
Coronary tree analyses (CMA)
Whole-coronary tree microcalcification burden (CMA for all three vessels combined), was comparable for the two series of reconstructions (CMAtotal: median [IQR]: CTAC = 1.01 [0–1.83], RACTAC = 1.05 [0–1.95], p=0.42) (Figure 6, A). In concordance with the single-vessel CMA burden, the data reconstructed using the two attenuation correction protocols were in agreement (Figure 6, B), with a coefficient of reproducibility of 0.17.
Figure 6.
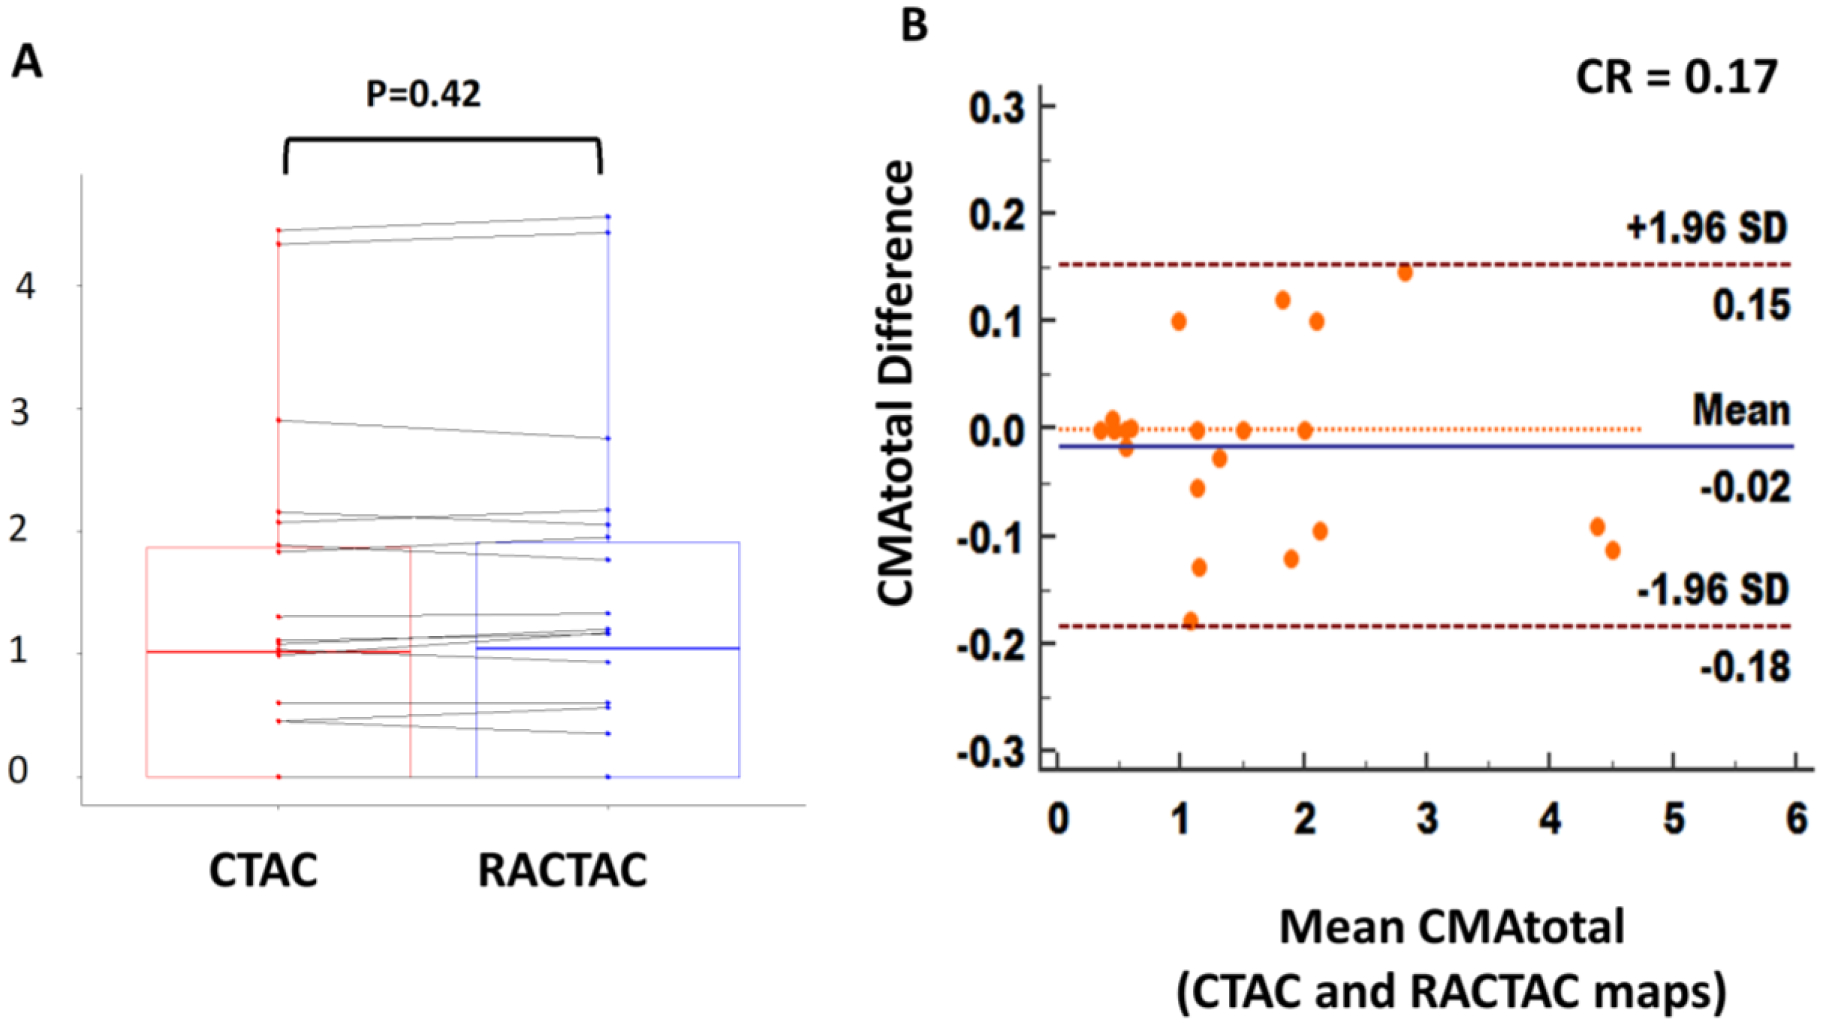
A) Boxplot with connecting lines between the CMA total measurements using the RACTAC maps vs CTAC maps (blue and red boxes represent interquartile range, with thick solid line inside represents the median), B) Bland-Altman plot of the differences between the CMAtotal measured using RACTAC maps vs CTAC maps.
CMAtotal = whole coronary tree microcalcification activity, CTAC = Computed Tomography Attenuation Correction and RACTAC = Respiratory averaged computed tomography attenuation correction, CR = coefficient of reproducibility
Correlation of lesion activity according to their location
Of the 34 coronary lesions, 2 were recognized in the left main stem (LMS), 15 in the left anterior descending artery, 8 in the right coronary artery and 9 in the left circumflex artery. There was excellent correlation among all lesions (R2=0.97) and there was no difference between different vessels (Figure 7).
Figure 7.
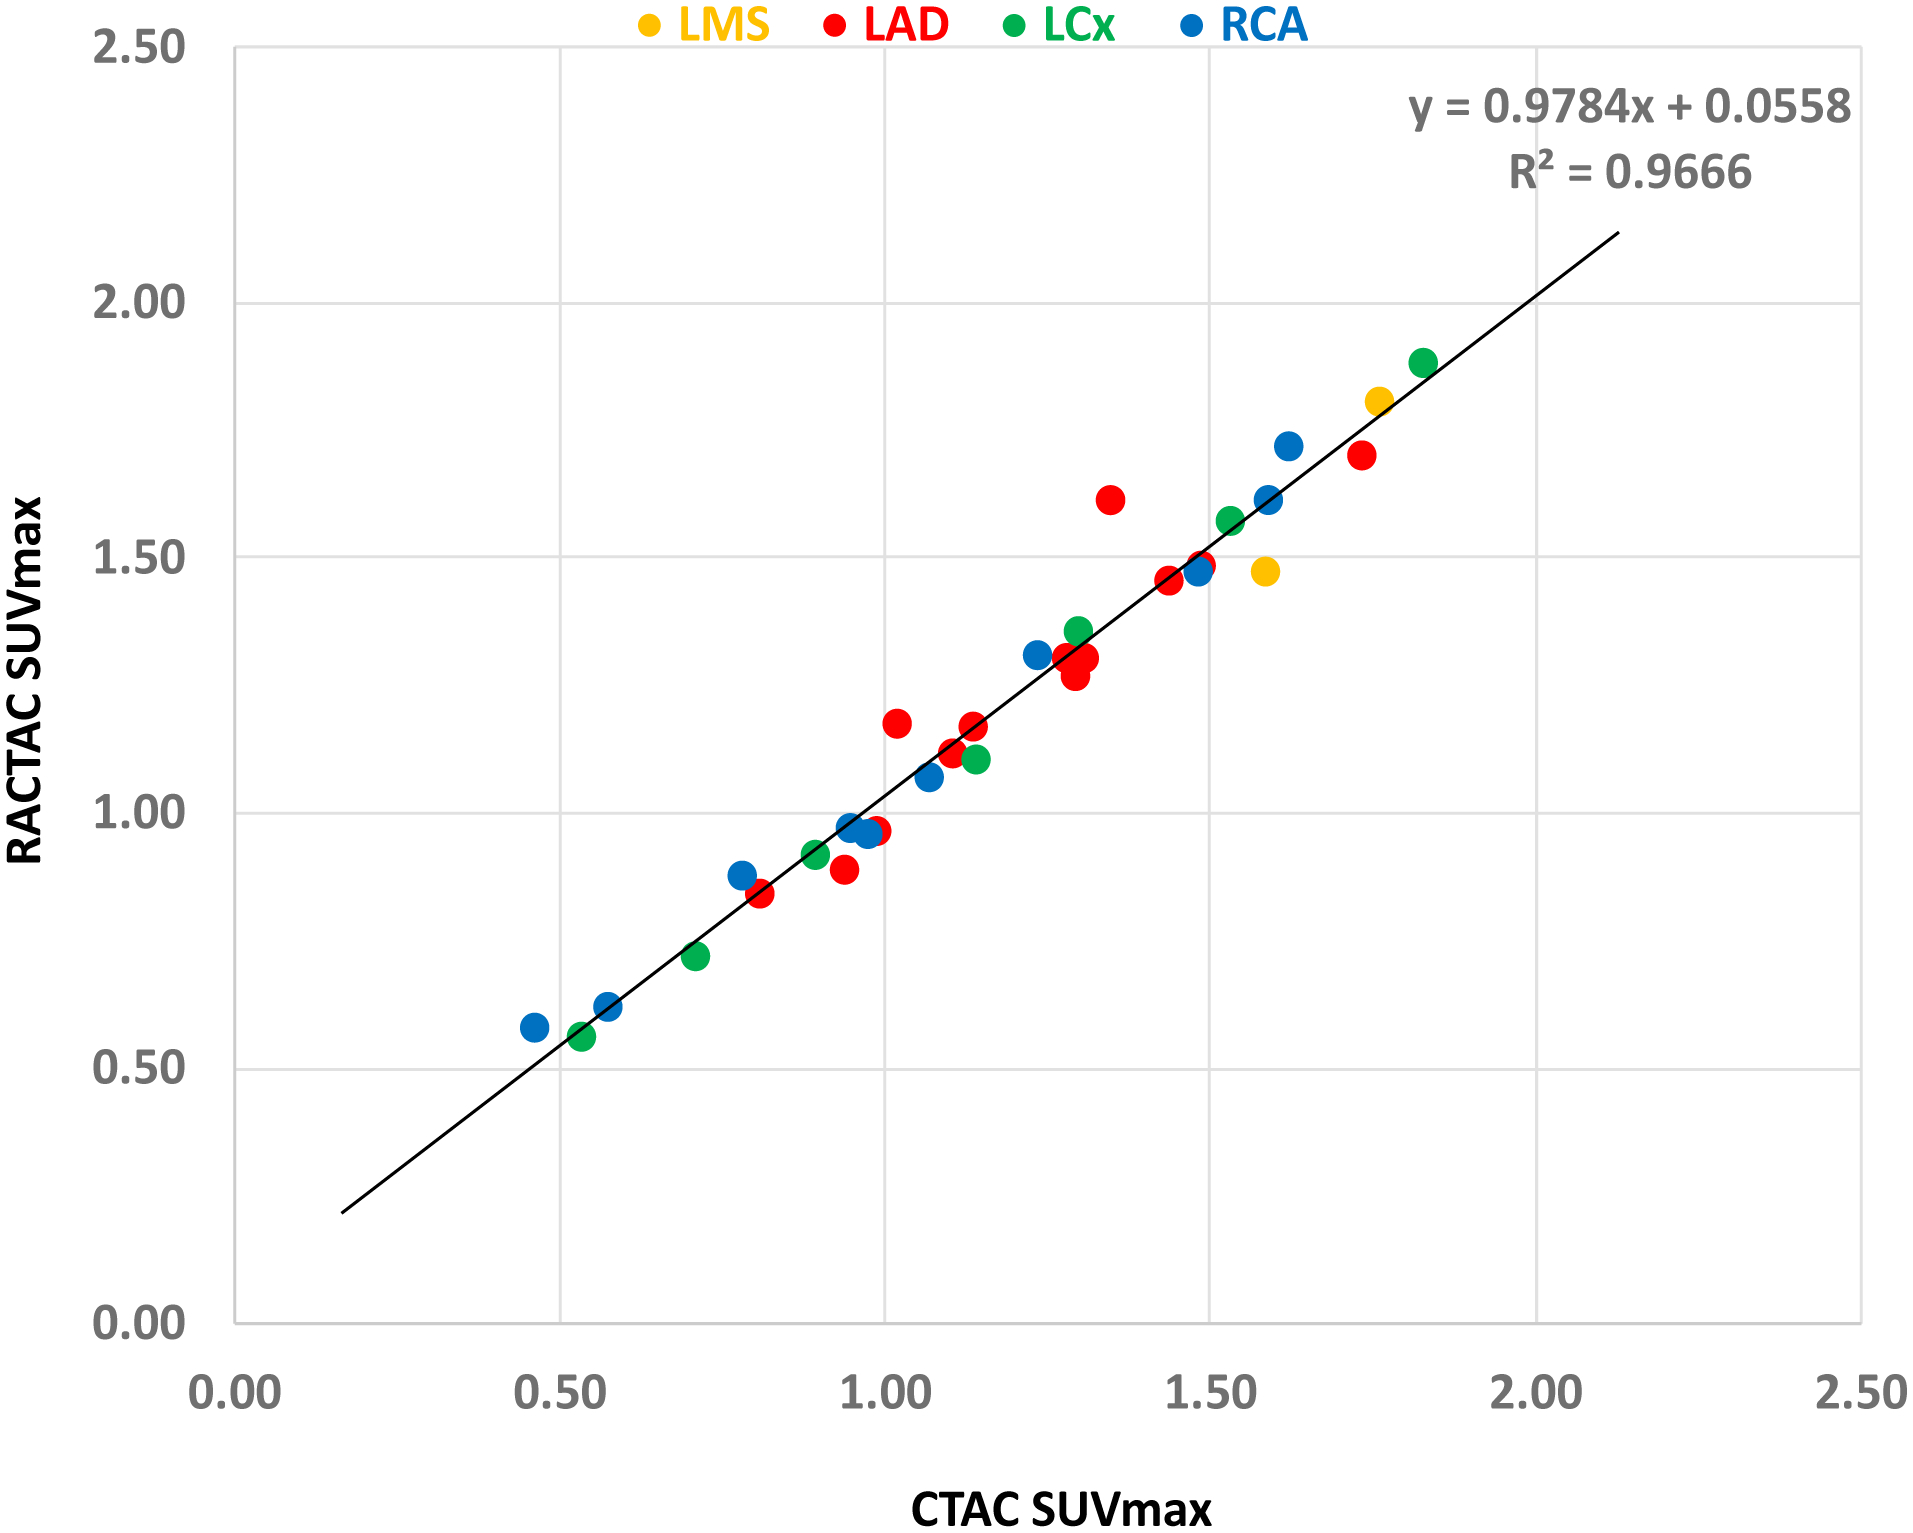
Correlation plot of SUVmax across the different lesion location. Excellent correlation (R2) shown indendent of the cornary artery involved.
LMS= left main stem, LAD= left anterior descending artery, RCA= right coronary artery and LCx= left circumflex artery, SUVmax= maximum standardized uptake value, CTAC = Computed Tomography Attenuation Correction and RACTAC = Respiratory averaged computed tomography attenuation correction
Discussion
In this study, we evaluated the impact of using standard CTAC maps and RACTAC maps obtained from cine-CT maps through respiratory averaging of CT data obtained in 4D on coronary PET. Our main finding was that using RACTAC did not introduce any significant changes in the quantitative comparisons, both when comparing single lesion activities and vessel and the whole coronary tree microcalcification burden. To our knowledge, this is the first study evaluating RACTAC maps in the assessment of coronary PET/CT.
Quantitative accuracy is of high importance in the assessment of both the singular vulnerable plaque and in the overall assessment of the coronary tree microcalcification burden (2). Previous studies have shown that both inter-reader and inter-scan variabilities are within acceptable ranges(6, 25). However, the quantitative accuracy can be impaired by significant respiratory and patient motion shifts during the acquisition (6, 26). Despite improvements in the test-retest reproducibility and reclassification of singular lesions following the introduction of sophisticated motion correction techniques, the quantitative accuracy might still be impaired by respiratory translations of the PET images during the 30-min long PET acquisitions. Current attenuation correction protocols employ a single-phase CT scan (free breathing, or end-expiratory breathing) (5, 12–15). The use of single-phase CTAC maps may change the observed uptake patterns in the heart, with deviations between 6% in canine models (27), and as much as 35% in human studies (28). In addition to the impact of the respiratory averaged CTAC maps, we also need to account for potential problems between co-registered PET and CTAC maps which have shown to affect myocardial perfusion assessments (8, 9, 11). The impact of misregistration of PET emission data and transmission scans (CTAC maps) have not been evaluated in-depth yet. However, as many CTAC maps are acquired using free breathing protocols, the CTAC maps are likely acquired in an expiratory breathing phase, which is similar to the averaged respiratory position during the PET acquisitions. Several efforts to minimize potential mismatches have been proposed, hereunder the feasibility of scanning at the optimal time during respiration (29–31). Additionally, the sizes of coronary lesions are often of the same magnitude as the PET system resolution, which leaves the attenuation correction issues less dominant than partial volume effects.
Unfortunately, even with perfect breath instructions, it is challenging to state the optimal breath protocol applicable for all patients and even if the CT scan was obtained at the optimal breathing state. Pan et al.(17, 32) demonstrated that potential misalignment caused by different breathing phases during helical CT and PET affects both the quantitative and qualitative accuracy. By utilizing RACTAC for attenuation correction instead of the commonly employed CTAC, the frequency and impact of breathing artefacts were reduced, with improved tumor quantification as a result (16). It was argued that by utilizing, fast-scan cine CT acquisition of 5 seconds it is possible to bring together the temporal resolutions of CT and PET (16, 17, 32).
In this study, we did not observe any significant changes in PET uptake values between the reconstructions obtained using CTAC and RACTAC. This finding contrasts with previous reports (8, 17, 27), in which up to 40% of the false-positive results normalized with the use of respiratory averaged CTAC maps (8). Several reasons could explain this. First, the investigators were measuring the activity of the myocardium and because of the higher diaphragmatic position at end-expiration they observed more misregistration artefacts resulting in decreased emission activity in inferior, inferoseptal, and inferolateral walls and compromised quantitative accuracy and the interpretation of myocardial viability. These artifacts were corrected by using respiratory-gated average attenuation maps. In our study, we concentrated on a focal activity away from the diaphragm and did not observe a difference in coronary 18F-NaF uptake between the single-phase CTAC and respiratory averaged CTAC. Second, in these studies, the investigators measured the average activity, while we measured maximum activity (TBRMAX) or activity above a specific threshold (CMA). By measuring maximum activity, we have encountered less variability by potential motion-driven misregistration as our volume of interest had a diameter of 5 mm. Gould et al. (8) showed that it was the transaxial misregistration of >6 mm that frequently caused artefactual defects and therefore by applying a volume of interest of 5 mm and measuring maximal activity we encountered less variability in our measurements. Third, the median offset of the CTAC and RACTAC images were of magnitude of 5.4mm (3D), with only 5 patients having translations of more than 10mm between the CTAC and RACTAC maps. These minor offsets combined with the averaging of the attenuation correction maps result in a relatively small impact of RACTAC images when compared to the CTAC maps. Finally, we used cardiac motion-corrected reconstructions(5) improving our ability to discriminate activity coming from the corresponding plaque lesion and improving our co-registration. We have previously shown that cardiac motion causes attenuation artifact and therefore correcting for cardiac motion improves our ability to detect coronary artery disease on myocardial perfusion scans (33). Such cardiac motion correction was not used in previous RACTAC work with myocardial perfusion scans (34). In particular, the effects of cardiac contraction exceed that of respiration with regards to the displacement of the coronaries (cardiac contraction displaces the coronary arteries 8–26mm during the cardiac cycle, while normal respiration leads to movement of the heart of approximately 6–13mm (35).
The coefficient of reproducibility reported in this study is similar to findings reported in test-retest reproducibility studies where both similar interscan variations (6), and inter-reader variations we observed(25). While these results have focused on the test-retest and inter-reader variability for two different studies, our current study reports variations occurring as a result of the attenuation correction. The main finding of this study is that the variations added to the quantitative assessments of the per-lesion and whole coronary tree microcalcification burden are within the range of the reported variations. Therefore, RACTAC applied to the coronary plaque assessments does not seem to change the quantitative 18F-NaF PET results when compared to the standard CTAC technique.
One concern in terms of employing the cine-CT in the routine clinical assessment is the added radiation dose, which conflicts with the as low as reasonably achievable (ALARA) principle. The ALARA principle might be compromised in studies of 18F-NaF studies, as we in this study did not find any diagnostic relevant changes in the lesion assessment using the RACTAC corrected reconstructions. Based on the calculations, the dose-burden given to a standard 70kg man equals 9.1mSv. This dose can be divided into the dose of the PET emission data (6.7mSv) and corresponding low-dose CTAC map (1mSv) and an additional 1.4mSv (15.2% extra dose) obtained for the cine-CT scan. While the difference between RACTAC and the regular CTAC is relatively low, the findings of this study indicate that the increased dose does not improve the quantification of coronary plaque scans using 18F-NaF and, thus, should be omitted in future studies to comply with ALARA.
Limitations
Our study has limitations. First, our sample is small (23 patients). Despite that, we showed that our reproducibility coefficient is below the previously reported interobserver and interscan variation (25). Second, we report results obtained using cardiac motion correction which have less noise and lower TBR values than the commonly presented end-diastolic imaging reconstruction (1, 19). However, previous studies from our group have shown that both end-diastolic and cardiac motion corrected images can be used for 18F-NaF coronary uptake assessments (5, 6). Third, a correlation between the volume with active microcalcification and the SUVmax or TBR measurements as the volume of activity is unknown. This limitation, although of clinical importance, is not affected by the attenuation correction, as shown in Figure 7 and, thus, not considered to affect the results of this paper. Fourth, it is a single-center study and we used only scanners from one vendor, thus, vendor-specific variations cannot be ruled out. A bigger study involving multiple centers and readers would be required to confirm our findings. Finally, the results presented in this study apply to the coronary PET imaging only, the effect of using RACTAC maps in other studies relying on absolute SUV measurements such as sarcoid PET/CT will need to be evaluated in future studies.
New Knowledge Gained
Using RACTAC instead of CTAC maps does affect quantitative accuracy of 18F-NaF PET/CT uptake. This finding is important to ensure the optimal quantitative accuracy in studies utilizing 18F-NaF PET with standard CTAC maps, such as in Prediction of Recurrent Events With 18F-Fluoride [PREFFIR; NCT02278211] study, where investigators use 18F-NaF PET/CT as a marker of coronary plaque vulnerability to detect culprit and non-culprit unstable coronary plaques in patients with recent myocardial infarctions to determine the prognostic significance of coronary 18F-NaF uptake. Based on this finding, given a comparable quantitative accuracy of CTAC and RACTAC maps, both approaches can be used depending on the institutional acquisition protocols.
Conclusion
Applying respiration-averaged CT attenuation correction (RACTAC) maps do not affect the quantification of the coronary lesions as read in fusion PET/CT images. Current protocols utilizing single-shot CTAC maps provide equivalent corrections for the clinical reading of the patients.
Conflict of Interest
This research was supported in part by Grant R01HL135557 from the National Heart, Lung, and Blood Institute/National Institutes of Health (NHLBI/NIH) (PI: Piotr Slomka). The content is solely the responsibility of the authors and does not necessarily represent the official views of the National Institutes of Health. The study was also supported by a grant (“Cardiac Imaging Research Initiative”) from the Miriam & Sheldon G. Adelson Medical Research Foundation. DEN (CH/09/002, RE/18/5/34216, RG/16/10/32375) and MRD (FS/14/78/31020) are supported by the British Heart Foundation. DEN is the recipient of a Wellcome Trust Senior Investigator Award (WT103782AIA) and MRD of Sir Jules Thorn Award for Biomedical Research Award (2015). Authors DD, PS, SC and DB received software royalties from Cedars-Sinai Medical Center for Autoplaque software and DD, PS, DB hold a patent, while FusionQuant is not commercially available. None of the other authors have any conflict of interest relevant to this study.
Abbreviations
- RACTAC
respiration-averaged CT attenuation correction
- CTAC
CT attenuation correction
- CMA
coronary microcalcification activity
- 18F-NaF
18F-sodium fluoride
- PET
positron emission tomography
- CTA
computed tomography angiography
- ECG-MC
cardiac motion corrected
- BC
background blood pool clearance correction
- TBRMAX
maximum target to background ratio
- SUVMAX
maximum standardized uptake value
- VOI
volume of interest
References
- (1).Joshi NV, Vesey AT, Williams MC, Shah AS, Calvert PA, Craighead FH et al. 18F-fluoride positron emission tomography for identification of ruptured and high-risk coronary atherosclerotic plaques: a prospective clinical trial. Lancet 2014;383:705–13. [DOI] [PubMed] [Google Scholar]
- (2).Kwiecinski J, Cadet S, Daghem M, Lassen ML, Dey D, Dweck MR et al. Whole-vessel coronary (18)F-sodium fluoride PET for assessment of the global coronary microcalcification burden. Eur J Nucl Med Mol Imaging 2020. [DOI] [PMC free article] [PubMed]
- (3).Kwiecinski J, Dey D, Cadet S, Lee SE, Tamarappoo B, Otaki Y et al. Predictors of 18F-sodium fluoride uptake in patients with stable coronary artery disease and adverse plaque features on computed tomography angiography. Eur Heart J Cardiovasc Imaging 2019. [DOI] [PMC free article] [PubMed]
- (4).Kwiecinski J, Slomka PJ, Dweck MR, Newby DE, Berman DS. Vulnerable plaque imaging using 18F-sodium fluoride positron emission tomography. The British Journal of Radiology 2019:20190797. [DOI] [PMC free article] [PubMed] [Google Scholar]
- (5).Doris MK, Otaki Y, Krishnan SK, Kwiecinski J, Rubeaux M, Alessio A et al. Optimization of reconstruction and quantification of motion-corrected coronary PET-CT. J Nucl Cardiol 2018. [DOI] [PMC free article] [PubMed]
- (6).Lassen ML, Kwiecinski J, Dey D, Cadet S, Germano G, Berman DS et al. Triple-gated motion and blood pool clearance corrections improve reproducibility of coronary (18)F-NaF PET. Eur J Nucl Med Mol Imaging 2019;46:2610–20. [DOI] [PMC free article] [PubMed] [Google Scholar]
- (7).Kwiecinski J, Berman DS, Lee SE, Dey D, Cadet S, Lassen ML et al. Three-Hour Delayed Imaging Improves Assessment of Coronary (18)F-Sodium Fluoride PET. J Nucl Med 2019;60:530–5. [DOI] [PMC free article] [PubMed] [Google Scholar]
- (8).Gould KL, Pan T, Loghin C, Johnson NP, Guha A, Sdringola S. Frequent diagnostic errors in cardiac PET/CT due to misregistration of CT attenuation and emission PET images: a definitive analysis of causes, consequences, and corrections. J Nucl Med 2007;48:1112–21. [DOI] [PubMed] [Google Scholar]
- (9).Martinez-Moller A, Souvatzoglou M, Navab N, Schwaiger M, Nekolla SG. Artifacts from misaligned CT in cardiac perfusion PET/CT studies: frequency, effects, and potential solutions. J Nucl Med 2007;48:188–93. [PubMed] [Google Scholar]
- (10).Slomka PJ, Rubeaux M, Le Meunier L, Dey D, Lazewatsky JL, Pan T et al. Dual-Gated Motion-Frozen Cardiac PET with Flurpiridaz F 18. J Nucl Med 2015;56:1876–81. [DOI] [PubMed] [Google Scholar]
- (11).Slomka PJ, Diaz-Zamudio M, Dey D, Motwani M, Brodov Y, Choi D et al. Automatic registration of misaligned CT attenuation correction maps in Rb-82 PET/CT improves detection of angiographically significant coronary artery disease. Journal of nuclear cardiology : official publication of the American Society of Nuclear Cardiology 2015;22:1285–95. [DOI] [PubMed] [Google Scholar]
- (12).Loghin C, Sdringola S, Gould KL. Common artifacts in PET myocardial perfusion images due to attenuation-emission misregistration: clinical significance, causes, and solutions. J Nucl Med 2004;45:1029–39. [PubMed] [Google Scholar]
- (13).Koshino K, Fukushima K, Fukumoto M, Sasaki K, Moriguchi T, Hori Y et al. Breath-hold CT attenuation correction for quantitative cardiac SPECT. EJNMMI Res 2012;2:33. [DOI] [PMC free article] [PubMed] [Google Scholar]
- (14).Kovalski G, Israel O, Keidar Z, Frenkel A, Sachs J, Azhari H. Correction of heart motion due to respiration in clinical myocardial perfusion SPECT scans using respiratory gating. J Nucl Med 2007;48:630–6. [DOI] [PubMed] [Google Scholar]
- (15).Fricke H, Fricke E, Weise R, Kammeier A, Lindner O, Burchert W. A method to remove artifacts in attenuation-corrected myocardial perfusion SPECT Introduced by misalignment between emission scan and CT-derived attenuation maps. J Nucl Med 2004;45:1619–25. [PubMed] [Google Scholar]
- (16).Pan T, Lee TY, Rietzel E, Chen GT. 4D-CT imaging of a volume influenced by respiratory motion on multi-slice CT. Medical physics 2004;31:333–40. [DOI] [PubMed] [Google Scholar]
- (17).Pan T, Mawlawi O, Luo D, Liu HH, Chi PC, Mar MV et al. Attenuation correction of PET cardiac data with low-dose average CT in PET/CT. Medical physics 2006;33:3931–8. [DOI] [PubMed] [Google Scholar]
- (18).Kwiecinski J, Adamson PD, Lassen ML, Doris MK, Moss AJ, Cadet S et al. Feasibility of Coronary (18)F-Sodium Fluoride Positron-Emission Tomography Assessment With the Utilization of Previously Acquired Computed Tomography Angiography. Circ Cardiovasc Imaging 2018;11:e008325. [DOI] [PMC free article] [PubMed] [Google Scholar]
- (19).Dweck MR, Chow MW, Joshi NV, Williams MC, Jones C, Fletcher AM et al. Coronary arterial 18F-sodium fluoride uptake: a novel marker of plaque biology. J Am Coll Cardiol 2012;59:1539–48. [DOI] [PubMed] [Google Scholar]
- (20).Kwiecinski J*, Tzolos E*, Adamson PD, Cadet S, Moss AJ, Joshi N et al. 18F-Sodium Fluoride Coronary Uptake Predicts Outcome in Patients with Coronary Artery Disease. JACC; 2020. (In press). [DOI] [PMC free article] [PubMed]
- (21).Tzolos EKJ, Lassen ML, Cadet S, Adamson P, Moss A et al. Observer repeatability and interscan reproducibility of 18F-sodium fluoride coronary microcalcification activity. JNC 2020. [DOI] [PMC free article] [PubMed]
- (22).ClinicalTrials.gov. Effect of Evolocumab on Coronary Artery Plaque Volume and Composition by CCTA and Microcalcification by F18-NaF 2018.
- (23).Rubeaux M, Joshi NV, Dweck MR, Fletcher A, Motwani M, Thomson LE et al. Motion Correction of 18F-NaF PET for Imaging Coronary Atherosclerotic Plaques. J Nucl Med 2016;57:54–9. [DOI] [PubMed] [Google Scholar]
- (24).Dey D, Schepis T, Marwan M, Slomka PJ, Berman DS, Achenbach S. Automated Three-dimensional Quantification of Non-calcified Coronary Plaque from Coronary CT Angiography: comparison with Intravascular Ultrasound Radiology 2010;257:516–22. [DOI] [PubMed] [Google Scholar]
- (25).Moss AJ, Doris MK, Andrews JPM, Bing R, Daghem M, van Beek EJR et al. Molecular Coronary Plaque Imaging Using (18)F-Fluoride. Circ Cardiovasc Imaging 2019;12:e008574. [DOI] [PMC free article] [PubMed] [Google Scholar]
- (26).Lassen ML, Kwiecinski J, Cadet S, Dey D, Wang C, Dweck MR et al. Data-Driven Gross Patient Motion Detection and Compensation: Implications for Coronary (18)F-NaF PET Imaging. J Nucl Med 2019;60:830–6. [DOI] [PMC free article] [PubMed] [Google Scholar]
- (27).Chin BB, Nakamoto Y, Kraitchman DL, Marshall L, Wahl R. PET-CT evaluation of 2-deoxy-2-[18F]fluoro-D-glucose myocardial uptake: effect of respiratory motion. Molecular imaging and biology : MIB : the official publication of the Academy of Molecular Imaging 2003;5:57–64. [DOI] [PubMed] [Google Scholar]
- (28).Goerres GW, Burger C, Kamel E, Seifert B, Kaim AH, Buck A et al. Respiration-induced attenuation artifact at PET/CT: technical considerations. Radiology 2003;226:906–10. [DOI] [PubMed] [Google Scholar]
- (29).Goerres GW, Kamel E, Heidelberg TN, Schwitter MR, Burger C, von Schulthess GK. PET-CT image co-registration in the thorax: influence of respiration. European journal of nuclear medicine and molecular imaging 2002;29:351–60. [DOI] [PubMed] [Google Scholar]
- (30).Beyer T, Antoch G, Blodgett T, Freudenberg LF, Akhurst T, Mueller S. Dual-modality PET/CT imaging: the effect of respiratory motion on combined image quality in clinical oncology. European journal of nuclear medicine and molecular imaging 2003;30:588–96. [DOI] [PubMed] [Google Scholar]
- (31).Nakamoto Y, Osman M, Cohade C, Marshall LT, Links JM, Kohlmyer S et al. PET/CT: comparison of quantitative tracer uptake between germanium and CT transmission attenuation-corrected images. J Nucl Med 2002;43:1137–43. [PubMed] [Google Scholar]
- (32).Chi PC, Mawlawi O, Luo D, Liao Z, Macapinlac HA, Pan T. Effects of respiration-averaged computed tomography on positron emission tomography/computed tomography quantification and its potential impact on gross tumor volume delineation. Int J Radiat Oncol Biol Phys 2008;71:890–9. [DOI] [PMC free article] [PubMed] [Google Scholar]
- (33).Suzuki Y, Slomka PJ, Wolak A, Ohba M, Suzuki S, De Yang L et al. Motion-frozen myocardial perfusion SPECT improves detection of coronary artery disease in obese patients. J Nucl Med 2008;49:1075–9. [DOI] [PMC free article] [PubMed] [Google Scholar]
- (34).Dawood M, Buther F, Stegger L, Jiang X, Schober O, Schafers M et al. Optimal number of respiratory gates in positron emission tomography: a cardiac patient study. Medical physics 2009;36:1775–84. [DOI] [PubMed] [Google Scholar]
- (35).Shechter G, Resar JR, McVeigh ER. Displacement and velocity of the coronary arteries: cardiac and respiratory motion. IEEE Trans Med Imaging 2006;25:369–75. [DOI] [PMC free article] [PubMed] [Google Scholar]


