

Abstract
Hexafluoropropylene oxide dimer acid (HFPO-DA or GenX) is an industrial replacement for the straight-chain perfluoroalkyl substance (PFAS), perfluorooctanoic acid (PFOA). Previously we reported maternal, fetal, and postnatal effects from gestation day (GD) 14–18 oral dosing in Sprague-Dawley rats. Here, we further evaluated the perinatal toxicity of HFPO-DA by orally dosing rat dams with 1–125 mg/kg/d (n=4 litters per dose) from GD16–20 and with 10–250 mg/kg/d (n=5) from GD8 – postnatal day (PND) 2. Effects of GD16–20 dosing were similar to those previously reported for GD14–18 dosing and included increased maternal liver weight, altered maternal serum lipid and thyroid hormone concentrations, and altered expression of peroxisome proliferator-activated receptor (PPAR) pathway genes in maternal and fetal livers. Dosing from GD8-PND2 produced similar effects as well as dose-responsive decreased pup birth weight (≥30 mg/kg), increased neonatal mortality (≥62.5 mg/kg), and increased pup liver weight (≥10 mg/kg). Histopathological evaluation of newborn pup livers indicated a marked reduction in glycogen stores and pups were hypoglycemic at birth. Quantitative gene expression analyses of F1 livers revealed significant alterations in genes related to glucose metabolism at birth and on GD20. Maternal serum and liver concentrations were similar between dosing intervals, indicating rapid clearance, however dams dosed GD8 – PND2 had greater liver weight and gestational weight gain effects at lower doses than GD16–20 dosing, indicating the importance of exposure duration. Comparison of neonatal mortality dose-response curves between HFPO-DA and previously published perfluorooctane sulfonate (PFOS) data indicated that, based on serum concentration, the potency of these two PFAS are similar in the rat. Overall, HFPO-DA is a developmental toxicant in the rat and the spectrum of adverse effects is consistent with prior PFAS toxicity evaluations, such as PFOS and PFOA.
Keywords: PFAS, developmental toxicity, in utero exposure, peroxisome proliferator-activated receptor, low birthweight, glucose metabolism
1. INTRODUCTION
Hexafluoropropylene oxide dimer acid (HFPO-DA) is a perfluoroalkyl ether carboxylic acid (PFECA) that is used as a polymerization aid in the manufacturing of high performance fluoropolymers following the phase out of PFOA (Beekman et al. 2016). HFPO-DA and its ammonium salt are referred to as “GenX Chemicals” because they are the two compounds primarily associated with GenX processing aid technology (USEPA 2018). Environmental monitoring studies in North Carolina, Ohio, and West Virginia (USA), Germany, China, the Netherlands, England, South Korea, and Sweden have reported detections of HFPO-DA, among other PFAS, in a range of matrices including air, ground water, rain water, surface water, and drinking water (Galloway et al. 2020; Gebbink et al. 2017; McCord et al. 2018; Strynar et al. 2015; Sun et al. 2016). Despite the widespread occurrence, there remains relatively little peer-reviewed experimental toxicity data for HFPO-DA or other PFECAs (or perfluoroalkyl ether sulfonic acids (PFESAs)) that have been recently detected. Guideline registration studies from the manufacturer of HFPO-DA are publicly available (USEPA-HERO 2018); however, data gaps exist in the evaluation of potential developmental toxicity for HFPO-DA. Specifically, no studies have been conducted in which dams were exposed from implantation throughout gestation then allowed to deliver for postnatal evaluation of offspring.
Previously, we reported on a range of effects following short-term (GD14–18) in utero exposure to HFPO-DA in the Sprague-Dawley rat (Conley et al. 2019). Observed, dose-responsive effects included lower gestational weight gain, higher maternal liver weights, lower maternal serum thyroid hormone and lipid concentrations, and up-regulated expression of genes associated with peroxisome proliferator-activated receptor (PPAR) signaling pathways in maternal and fetal livers. We further reported that in a low sample size pilot study with a relatively high oral dose (125 mg/kg) we observed indications of potential adverse postnatal effects including reduced female offspring body weight at multiple timepoints, altered weights of testes and epididymides in male offspring at necropsy, and altered ano-genital distance and liver weight in female offspring at necropsy. These preliminary data provided the rationale for further HFPO-DA testing, along with existing data in the literature highlighting the importance of late term (i.e., GD19 & 20) dosing for PFOS-induced developmental toxicity (Grasty et al. 2003), and the absence of a similar postnatal study for HFPO-DA.
Developmental toxicity is the basis for reference doses used in the risk assessment of multiple PFAS in the US (USEPA 2016b, c) and other nations (NHMRC 2011); however, the specific mechanisms and modes of action for developmental effects are not well described. Based on earlier studies of the developmental toxicity of PFOA and PFOS using peroxisome proliferator-activated receptor alpha (PPARα) knockout mice (Abbott et al. 2007; Abbott et al. 2009), it appears that multiple molecular initiating events (MIEs) are likely involved in the developmental toxicity of some PFAS. In order to facilitate current and future screening of additional PFAS, including emerging PFECAs and PFESAs among others, it is important to identify and characterize the Adverse Outcome Pathways (AOPs), including critical MIEs and key events (KEs), that are relevant to the adverse effects of PFAS on developing mammals.
The goal of the present study was to determine if HFPO-DA, like other PFAS, produces early-life adverse effects on offspring bodyweight and/or survival. Further, we wanted to quantify internal dosimetry in order to reduce the uncertainty in extrapolating laboratory rat toxicity studies across chemicals and to potential human health effects. We conducted experiments with pregnant rats dosed from GD16–20 (to evaluate key events during the critical window described above) and from GD8 – postnatal day (PND) 2 (to assess early life effects including measurement of ano-genital distance on PND2). We evaluated and report on a range of effects primarily related to the maternal and fetal livers, neonatal health, and serum and liver HFPO-DA concentrations in dams and offspring.
2. METHODS
2.1. Dosing solutions
Dosing solutions were prepared using high performance liquid chromatography-grade water purchased from Honeywell Research Chemicals (Muskegon, MI, USA) and HFPO-DA ammonium salt (CAS: 62037–80-3; Product No.: 2122–3-09; Lot: 00005383) purchased from SynQuest Laboratories (Alachua, FL, USA). HFPO-DA purity was 100% as determined by the supplier via perchloric acid titration. Dosing was administered once daily via oral gavage at 2.5 mL/kg body weight across a range of 1 – 250 mg HFPO-DA/kg-bw/d (specific dosing regimes described below). Dosing solutions are reported as nominal and not corrected for the ammonium counterion, which accounts for 5.2% of the dose on a mass basis. The ammonium counterion was present at levels (13 mg/kg at the top dose) considerably below those expected to impart any toxic effects (Lina and Kuijpers 2004).
2.2. Animals
Time-mated Sprague-Dawley rats (Crl:CD(SD)), approximately 90 days old, were purchased from Charles River Laboratories (Raleigh, NC, USA) and shipped to USEPA (Research Triangle Park, NC, USA) on GD2 (GD0 = bred date; GD1 = plug positive date). Dams and their offspring were housed individually in clear polycarbonate cages (20 × 25 × 47 cm) with heat-treated, laboratory-grade pine shavings (Northeast Products, Warrensburg, NY) and fed NIH07 Rat Chow and filtered (5 µm) municipal tap water (Durham, NC) ad libitum. Dams were weight-ranked and stratified then randomly assigned to treatment groups to produce similar mean weights and variances given the range of dam body weights (typically ~10% coefficient of variation). This study was conducted in accordance with a protocol approved by the USEPA Center for Public Health and Environmental Assessment Institutional Animal Care and Use Committee. Animals were housed in a facility accredited by the Association for Assessment and Accreditation of Laboratory Animal Care and maintained at 20–22°C, 45–55% humidity, and a 12:12 h photoperiod (lights off 18:00).
2.3. Evaluation of neonatal effects (GD 8 – PND 2)
One block of 30 dams was used to assess the neonatal effects of in utero and short-term postnatal exposure to HFPO-DA. Dams were exposed daily via oral gavage to either water vehicle, 10, 30, 62.5, 125, or 250 mg/kg HFPO-DA (n=5 for each) from GD8 – PND2 (PND0 = day of parturition). One dam in the 62.5 mg/kg dose group died during dose administration (not treatment related), reducing the sample size to n=4 for that group. Dams gave birth naturally and were checked for parturition hourly beginning at 6AM on the morning of GD22 (i.e., PND0) until all dams had delivered. Hourly checks on maternal and neonatal pup health continued until 5PM on PND1 and dead pups were removed and those that were moribund were removed and euthanized via decapitation. As dams delivered, we recorded the time the first pup was observed in a cage and then the assumed time of completion of delivery based on normal maternal behaviors (e.g., retrieving pups to the nest, licking/grooming of pups, hovering over nest to stimulate nursing). Upon assumed completion of delivery, all pups were removed, counted and whole litter weight was recorded. All pups were returned to their nest except for two randomly selected pups, which were euthanized via decapitation and pooled trunk blood was collected. One pup had the thoracic and abdominal cavities exposed and then the whole pup was fixed in 10% formalin. Subsequently, livers from formalin fixed pup carcasses were removed and shipped to Experimental Pathology Laboratories, Inc. (Durham, NC) where they were embedded, sectioned, stained with hematoxylin and eosin (H&E) and periodic acid-Schiff (PAS), and evaluated by a Diplomate of the American College of Veterinary Pathology. For the second euthanized pup we removed liver tissue for RNA extraction and gene expression (described below).
Three recently deceased newborn pups (1 each from 30, 125, and 250 mg/kg dose groups) were also collected at the request of the EPA Attending Veterinarian, preserved in 10% formalin, and whole carcasses were sent to IDEXX BioAnalytics (Columbia, MO) for diagnostic histopathology (bones, brain, eyes, heart, intestines, kidney, limbs, liver, lungs, nasal cavity, spinal cord/vertebral column, spleen, stomach, vasculature).
Dams were weighed and dosed on the morning of PND2 and time of dosing was recorded. Dams were euthanized via decapitation and necropsied 2 – 5.5 hr after dosing and time of euthanasia was recorded. Euthanasia order was stratified such that the timing of necropsy was equally distributed across dose groups. Maternal trunk blood was collected for serum isolation, liver weight was recorded and subsamples of maternal liver were collected for RNA extraction and HFPO-DA determination (described below). The uterus was removed and implantation sites were scored. All pups were sexed, weighed, and ano-genital distance (AGD) was measured using a Leica MZ6 stereomicroscope (Leica Microsystems, Wetzlar, Germany) fitted with an ocular micrometer. Following AGD measurement all pups were euthanized via decapitation and trunk blood was collected for serum isolation, liver weight was recorded for 1 male and 1 female pup per litter, and a liver subsample was collected for determination of HFPO-DA concentration. Maternal serum (PND2) was analyzed for thyroid hormone concentrations (described below) and maternal and neonatal (both PND0 and PND2) serum were analyzed for clinical chemistry parameters (described below).
2.4. Evaluation of fetal and maternal effects during gestation (GD 16–20)
Two blocks of 15 dams per block were dosed once daily from GD 16–20 with either water vehicle or HFPO-DA to evaluate fetal and maternal effects and HFPO-DA concentrations in serum and liver. In each block dams were dosed with water vehicle (n=3) or 1, 3, 10, 30, 62.5, or 125 mg/kg HFPO-DA (n=2 per treatment). Total sample sizes were n=6 for vehicle control and n=4 for HFPO-DA treated dams. In both blocks all dams were pregnant and we evaluated maternal weight gain during dosing, reproductive output (# fetuses, resorptions), maternal liver weight, collected maternal and fetal liver mRNA, and measured maternal and fetal serum and liver HFPO-DA concentrations (fetal serum only collected in one of two experimental blocks). Dams and fetuses were euthanized by decapitation beginning 2 hours after the final oral dose and ending ~4 hours after the final oral dose (~8:30–10:30AM Eastern Standard Time (EST)). Euthanasia order was stratified such that the timing of necropsy was equally distributed across dose groups. Trunk blood was collected from both dams and fetuses and serum isolated. Fetal serum was pooled across all fetuses within a litter. In the first block we randomly selected two male and two female fetuses per litter and recorded bodyweight and liver weight, collected subsamples from livers to determine HFPO-DA concentration, and then recorded the individual bodyweights of all remaining fetuses irrespective of sex. There was no indication of an effect of sex on fetal body weight from the prior block, therefore in the second block we recorded the bodyweight of three randomly selected fetuses (irrespective of sex); of those, we randomly selected one fetus and the liver weight was measured and a liver subsample was collected to determine HFPO-DA concentration.
2.5. Liver gene expression
Subsamples of liver tissue (~30–50 mg) were collected into polypropylene microcentrifuge tubes containing 500 µL TRIzol Reagent (Invitrogen, Carlsbad, CA, USA) on ice, then individually homogenized using a Bullet Blender (Next Advance, Troy, NY, USA) with 1mm zirconium oxide beads, transferred to clean tubes, and stored at −80°C prior to RNA extraction. RNA extraction was conducted according to TRIzol Reagent manufacturer specifications using chloroform and isopropanol. Following extraction, RNA was purified using RNeasy Mini Kit (Cat no. 74104; Qiagen, Hilden, Germany). RNA concentration and purity (260:280 ratio ≥1.8) were determined with a NanoDrop 2000 spectrophotometer (Thermo Scientific, Waltham, MA, USA). Gene expression was assessed using reverse transcriptase real-time polymerase chain reaction (RT-qPCR) of cDNA synthesized from RNA extracted from sample homogenates. Maternal, fetal, and neonatal livers were evaluated using the RT2 Profiler PCR Array for Rat PPAR Targets by Qiagen (Cat. no. 330231 PARN-149ZA), which contains 84 target genes relevant to PPAR alpha (α), beta/delta (β/δ), and gamma (γ) signaling pathways (complete list of genes in Supplemental Table 1). Fetal and neonatal liver samples were also evaluated using the RT2 Profiler PCR Array for Rat Glucose Metabolism by Qiagen (Cat. no. 330231 PARN-006Z), which contains 84 genes involved in the regulation and enzymatic pathways of glucose and glycogen metabolism (complete list of genes in Supplemental Table 2). PCR reactions were run using RT2 SYBR Green qPCR Master Mix (SABiosciences Corp., Frederick, MD, USA). PPAR Target arrays were run on an iCycler iQ Real-Time Detection System (Bio-Rad, Hercules, CA, USA) and Glucose Metabolism arrays were run on a CFX96 Touch Real-Time Detection System (Bio-Rad).
2.6. Analytical chemical determination of HFPO-DA concentrations
Maternal and offspring serum and liver samples were analyzed for HFPO-DA concentrations using similar methodology to that reported by McCord et al. (2018) and Conley et al. (2019). Serum was isolated from trunk blood via centrifugation (10,000 x g for 15 min at 4°C) in vacutainer tubes, transferred to 1.5 mL microcentrifuge tubes and stored at −80°C. Liver tissue subsamples were individually weighed then transferred to clean polypropylene microcentrifuge tubes and HPLC-grade water was added at a ratio of 3:1 (water:liver, weight basis). Tissues were then homogenized and stored at 4°C prior to chemical analysis. Briefly, samples were denatured using 100 µL 0.1 M formic acid followed by a 500 µL cold (−20°C) acetonitrile protein crash. Denatured samples were centrifuged at 10,000 x g for 5 min and 200 µL supernatant was transferred to screw-cap chromatography vials with 200 µL ammonium acetate buffer. Sample extracts were separated using a Waters ACQUITY ultra performance liquid chromatograph (UPLC) (Waters Corporation, Milford, MA, USA) fitted with a Waters ACQUITY UPLC BEH C18 column (2.1 mm x 50 mm; 1.7 µm; 130 Å). Detection was performed using a Waters Quattro Premier XE tandem quadrupole mass spectrometer in negative ionization mode. A stable isotope of HFPO-DA (13C3, Wellington Laboratories, Guelph, Ontario, Canada) was used as an internal standard for quantitation. Separate calibration curves were prepared for the ranges 5–100 ng/mL, 100–5000 ng/mL, and 5000–200000 ng/mL to account for expected concentration differences between control, fetus, and dam concentrations. Limits of quantitation (LOQ) were 5 ng/mL (serum) and 0.1 µg/g (liver). Samples below LOQ were estimated at LOQ/2 for the purpose of calculating means and standard errors (only vehicle controls had samples <LOQ).
2.7. Determination of thyroid hormone concentrations and clinical chemical parameters
Maternal serum was analyzed for thyroid hormone concentrations (total triiodothyronine (T3) and thyroxine (T4)) by radioimmunoassay according to manufacturer specifications (IVD Technologies) and as previously described (Conley et al. 2019). Clinical chemistry was analyzed in maternal serum using a Rx daytona+ (Randox Laboratories, Kearneysville, WV) according to manufacturer specifications. Clinical chemistry parameters included: ALT, AST, triglycerides, cholesterol, albumin, and glucose (non-fasting).
2.8. Data analyses
All values are reported as mean ± standard error of the mean (SEM) and all statistical comparisons were conducted at α=0.05 significance level except for RT-qPCR gene expression which identified significantly altered genes at both α=0.01 and α=0.001 using analysis of variance (ANOVA), followed by pairwise comparison at α=0.05 to determine differences of treatment compared to control for significant genes. Data were log10-transformed and treatment effects were identified by ANOVA using the PROC GLM statement in SAS (v.9.4, SAS Institute, Cary, NC, USA) and pairwise comparison versus control was performed using the least squares means (LSMEANS) statement using the PDIFF option. For all fetal and neonatal data, litter means were used as the statistical unit to account for the nested effects of individuals within litters. Pup liver glycogen accumulation grades were analyzed by non-parametric Kruskal-Wallis test following by Mann-Whitney U test for pairwise comparison to control using GraphPad Prism v8.2.1 (GraphPad, Inc., La Jolla, CA, USA). GraphPad Prism was used to generate all figures and to conduct sigmoidal dose-response curve analyses.
Maternal and fetal/neonatal liver gene expression data were analyzed using the comparative cycle threshold (CT) method. Melt curve analyses were conducted for all genes at all doses, and any well not displaying a clear peak was assigned a CT value of 35. This is critical for the evaluation of genes that are typically unexpressed in control liver, but are upregulated as a result of exposure. Delta CT values were calculated using the equation 2-∆∆CT and normalized to the mean CT value of the appropriate housekeeping genes for each tissue and gene array. We selected housekeeping genes that did not display a significant treatment effect of HFPO-DA exposure (GD20 fetal liver = Actb, B2m, Hprt1, Rplp1; GD20 maternal liver = Actb, Hprt1, Rplp; PND0 neonatal liver = Actb, Hprt1). Delta CT values were then converted to fold-induction by dividing the treated replicate delta CT by the mean delta CT of the control replicates for each gene. Fold induction values were log10 transformed prior to ANOVA. We previously examined PPAR target genes in fetal and maternal livers from GD14–18 HFPO-DA exposure (Conley et al. 2019) and hypothesized that GD16–20 exposure would display similar alteration of the same genes. As such, we analyzed the fetal and maternal PPAR genes from a single block (n=3 for control, n=2 per treatment) of GD16–20 exposure with the GD14–18 data using two-way ANOVA with dose and exposure interval as independent variables.
Fetal and pup body weights were analyzed using litter size as a covariate within PROC GLM. Liver weight was analyzed using body weight as a covariate within PROC GLM and liver weight relative to body weight was also calculated for each individual. Pup survival was scored as the number of live pups on PND2 divided by the total number of live pups born and by the number of uterine implantations sites and presented as percentages. Neonatal serum clinical chemistry was analyzed using two-way ANOVA with dose and postnatal day as independent variables.
HFPO-DA concentrations in maternal and fetal serum from GD16–20 exposure were compared to previously published data for GD14–18 exposure (Conley et al. 2019). Serum concentrations were analyzed using two-way ANOVA with dose and interval as independent variables. There was no effect of interval on fetal serum concentrations so GD18 and GD20 data were combined. Maternal serum concentrations significantly varied from GD18 to GD20 and are reported separately. Fetal (GD20) and neonatal (PND2) liver HFPO-DA concentrations were each analyzed using two-way ANOVA with dose and sex as class variables. There was no effect of sex on fetal liver concentrations so male and female concentrations were combined; however, there was a significant effect of sex on PND2 liver concentrations and data are reported for males and females separately. Maternal and fetal serum and liver concentrations were log-transformed and fit with regression models using GraphPad Prism.
Chemical potency was compared between HFPO-DA and PFOS (data from Lau et al. (2003) and Thibodeaux et al. (2003)) for the effect of neonatal mortality based on oral administered dose, maternal serum concentrations (mass/volume basis), and maternal serum concentrations (molar basis). Potency (ED50 or EC50) parameters and 95% confidence intervals were estimated using four-parameter logistic regression in GraphPad Prism. PFOS serum concentrations were taken as the average of GD7, GD14, and GD21 maternal levels across the 1–10 mg/kg dose range reported in Thibodeaux et al. (2003). HFPO-DA serum concentrations were taken as the average of GD20 maternal levels reported here and GD18 levels previously reported in Conley et al. (2019). Neonatal mortality was modeled based on PND2 values reported here and in Lau et al. (2003).
Dam serum concentrations were also compared to plasma levels reported for fluorochemical workers from a HFPO-DA manufacturing facility in Dordrecht, Netherlands (DuPont 2017). Human plasma samples represented workers who volunteered to participate in the study with the goal of determining whether there were measurable quantities of HFPO-DA in their blood. Some of the workers were in areas with potential for exposure and others were not (17/24 participants had detectable HFPO-DA levels). We calculated the margin of internal exposure (MOIE, as described by Bessems et al. (2017)) as a ratio of mean maternal rat serum concentration to human plasma concentration for each of the 17 workers with detectable levels.
3. RESULTS
3.1. Neonatal effects from GD8-PND2 maternal exposure
In contrast to the shorter-term gestational exposure (GD14–18) we previously reported (Conley et al. 2019), here we observed multiple significant adverse effects of HFPO-DA exposure when dams were dosed from GD8-PND2. All dams began delivering 15.1±1.1 hrs after 12:00AM on PND0 (i.e., GD22) and gave birth to 12.5±0.3 pups (Supplemental Table 3). All pups were alive at birth with no remarkable gross external malformations and all dams displayed typical postpartum nesting and litter maintenance behaviors (i.e., grooming of newborns, placenta consumption, aggregating pups into nest to initiate nursing). At the assumed completion of delivery, pups were counted and weighed as an entire litter. There was a significant (ANOVA p<0.0001) reduction in average pup birthweight at ≥30 mg/kg representing reductions of 8.9, 11.8, 15.2, and 26.2% compared to control in the 30, 62.5, 125, and 250 mg/kg dose groups, respectively (Figure 1A). Shortly after the onset of delivery pups in the higher dose groups began displaying lethargy, were moribund, or were discovered expired in the nest. The time from onset of delivery to first observations of pup mortality were 10.4±8.4, 13.1±11.3, 11.4±2.6, 9.3±1.0, and 5.1±1.9 hrs in the 10, 30, 62.5, 125, and 250 mg/kg dose groups, respectively. Pups continued to perish or require euthanasia throughout PND0 and into PND1. Survival was scored at 10:00AM PND1 and was significantly reduced at ≥62.5 mg/kg with values of 100±0, 98±3, 98±2, 90±4, 49±18, and 5±5% in the 0–250 mg/kg dose groups, respectively. Pup survival continued to decrease on PND1 with afternoon (4PM) assessment of 100±0, 96±2, 97±2, 87±5, 43±15, and 5±5% in the 0–250 mg/kg dose groups, respectively. It was noted that many of the pups that died had visible milk bands, indicating that they had successfully nursed prior to expiration. Final pup survival as scored at necropsy on PND2 was 100±0, 96±2, 97±2, 87±5, 38±13, and 5±5% in the 0–250 mg/kg dose groups, respectively (Figure 1B).
Figure 1.

Violin plots (heavy horizontal line=median, dashed horizontal lines=quartiles) of postnatal effects on pups exposed to maternal oral HFPO-DA from GD8-PND2. (A) Birthweight measured as average pup weight following completion of delivery on GD22/PND0. (B) Pup survival calculated as percent living on PND2 relative to number of liveborn pups. (C) Bodyweight (BW) on PND2 as litter average of all male and female pups. (D) Relative liver weight as average of one male and one female pup per litter on PND2. Asterisks represent significant difference compared to control (*, p<0.05; **, p<0.01; ***, p<0.001; ****, p<0.0001).
At necropsy on PND2 all pups were measured for bodyweight, anogenital distance, and liver weight was measured for one male and one female pup per litter (Supplemental Table 4). There was no significant effect of pup sex on body weight or liver weight. HFPO-DA exposure produced a significant (p<0.0001) reduction in body weight at ≥ 30 mg/kg representing reductions of 17.4, 25.7, 37.6, and 39.5% in the 30, 62.5, 125, and 250 mg/kg dose groups compared to control, respectively (Figure 1C). Pup body weight was down 6.4% in the 10 mg/kg dose group but this was not statistically significant (p=0.0791). Pup growth over the neonatal period (birth to necropsy on PND2) was significantly (p<0.0001) reduced at ≥30 mg/kg with control pups gaining, on average, 2.1±0.7 g compared to gains of 1.2±0.4 and 0.6±0.5 g in the 30 and 62.5 mg/kg groups, while pups in the 125 and 250 groups lost 0.2±0.3 and 0.1 g over this interval, respectively. Pups in the 10 mg/kg dose group gained 1.6±0.4 g but this was not significant (p=0.0673). Given the significant body weight reductions, both AGD and liver weight were analyzed as corrected for body weight. There was no significant difference in AGD for male or female pups in any dose group compared to control. Relative liver weight was significantly (p<0.0001) increased in all dose groups representing 24.5, 42.6, 55.1, 73.0, and 62.5% increases compared to control in the 10, 30, 62.5, 125, and 250 mg/kg dose groups, respectively (Figure 1D).
Liver samples from newborn pups (PND0, prior to initiation of nursing) were collected and preserved for histopathological evaluation. There were no remarkable histological lesions (e.g., necrosis or inflammation), however glycogen accumulation was scored based on the percentage of hepatocytes containing glycogen (Grade 1, ≤10%; Grade 2, 10–25%; Grade 3, 25–50%; Grade 4, >50%) (Figure 2A–D). Glycogen accumulation scores were significantly (Kruskal-Wallis p=0.0065) lower than controls in all dose groups (3.0±0.7, 1.3±0.5, 1.8±0.4, 1.3±0.5, 1.2±0.4, and 1.2±0.4 for 0–250 mg/kg, respectively) (Figure 2E). Further, beginning on PND1 we also observed pups from treated groups displayed purple discoloration of the entire right hind limb beginning at the hip in 3 pups (1 pup each from 30, 125, and 250 mg/kg dose groups). The pups exhibiting right hind limb discoloration were preserved for independent diagnostic histopathology. All three pups were reported to have milk protein in the stomach lumen, vascular thrombi in various vessels, and small dense basophilic cells throughout liver lobes. The two pups from the higher dose groups (125 and 250 mg/kg) both had moderate subcutaneous hemorrhage in the area of the umbilical artery and vein. Subcutaneous edema or vascular congestion of the lower limb was noted in the pups from the 30 and 250 mg/kg dose groups.
Figure 2.

Glycogen accumulation in newborn pup livers was graded by a Board Certified Veterinary Pathologist based on the percentage of hepatocytes containing glycogen. (A-D) Example photomicrographs of newborn pup liver sections stained with PAS from (A) control (grade 4), (B) control (grade 3), (C) exposure to 30 mg/kg HFPO-DA (grade 2), and (D) exposure to 250 mg/kg (grade 1). (E) Glycogen accumulation grade was significantly reduced in all dose groups. (F) Newborn pup serum glucose concentrations. Asterisks represent significant difference compared to control (*, p<0.05; **, p<0.01; ***, p<0.001; ****, p<0.0001).
Serum from newborn and PND2 pups was analyzed for clinical chemistry parameters including cholesterol, triglycerides, ALT, AST, albumin, and glucose (Table 1). Newborn pup glucose (p<0.0001, Figure 2F) was decreased at ≥62.5 mg/kg, albumin (p=0.0047) was significantly decreased at 62.5 and 250 mg/kg, and cholesterol (p<0.0001, Figure 3A) and triglycerides (p=0.0004, Figure 3B) were significantly increased at ≥125 mg/kg. PND2 pups also displayed decreased glucose at ≥125 mg/kg and elevated cholesterol at ≥62.5 mg/kg. In contrast to newborns, PND2 pups did not display alteration of albumin or triglycerides, but did display elevated AST at ≥30 mg/kg.
Table 1.
Serum analyses for neonatal samples collected at birth and at necropsy on PND2, following oral maternal exposure to HFPO-DA from GD8-PND2
| Neonatal serum | ||||||||||||
|---|---|---|---|---|---|---|---|---|---|---|---|---|
| GD8-PIMD0 (mg/kg/d) | GD8-PND2 (mg/kg/d) | |||||||||||
| 0 | 10 | 30 | 62.5 | 125 | 250 | 0 | 10 | 30 | 62.5 | 125 | 250 | |
| (n=5) | (n=5) | (n=5) | (n=4) | (n=5) | (n=5) | (n=5) | (n=5) | (n=5) | (n=4) | (n=3–4) | (n =1) | |
| Albumin (g/dL) | 1.45±0.02 | 1.58±0.08 | 1.31±0.09 | 1.21±0.07* | 1.31±0.04 | 1.16±0.08* | 1.52±0.04 | 1.60±0.01 | 1.61±0.05 | 1.54±0.02 | 1.50±0.01 | 1.48 |
| ALT (U/L) | 45±5 | 44±4 | 47±2 | 52±8 | 50±5 | 54±3 | 29±4 | 24±1 | 24±1 | 26±2 | 30±3 | 32.9 |
| AST (U/L) | 285±29 | 278±23 | 308±16 | 289±22 | 334±32 | 333±25 | 183±64 | 216±11 | 254±33* | 302±46* | 278±59* | 412* |
| Glucose (mg/dL) | 54±11 | 73±7 | 57±5 | 36±6* | 30±3* | 29±4* | 83±12 | 91±3 | 85±6 | 79±10 | 57±15* | 26* |
| Cholesterol (mg/dL) | 46±3 | 55±6 | 45±3 | 56±7 | 82±8* | 80±5* | 83±13 | 99±7 | 99±2 | 137±13* | 122±26* | 164* |
| Triglycerides (mg/dL) | 29±2 | 33±3 | 24±2 | 28±4 | 44±4* | 45±5* | 164±23 | 159±21 | 199±16 | 242±28 | 201±42 | 160 |
Values in bold with (*) significantly different from control. T4=thyroxine, T3=triiodothyronine, ALT=alanine aminotransferase, AST=aspartate aminotransferase
Figure 3.

Violin plots (heavy horizontal line=median, dashed horizontal lines=quartiles) of serum cholesterol (A-C) and triglyceride (D-F) concentrations. (A,D) Newborn (PND0) concentrations following exposure from GD8 through delivery, (B,E) maternal concentrations from GD8-PND2 exposure, and (C,F) maternal concentrations from GD16–20 oral exposure to HFPO-DA. Asterisks represent significant difference compared to control (*, p<0.05; **, p<0.01; ***, p<0.001; ****, p<0.0001)
3.2. Maternal effects from GD8-PND2 exposure
Dam bodyweight was equal across all dose groups beginning on GD8 (Supplemental Table 3). Mean dam body weight and gestational weight gain (Figure 4A) were significantly (p<0.0001) lower than control on GD22 at 125 (31.0±4.4% reduction in weight gain) and 250 mg/kg (36.1±9.0% reduction). At necropsy on PND2, absolute dam body weight was significantly (p=0.0006) reduced at ≥125 mg/kg with dams weighing 14.2±2.6 and 19.4±2.7% less than controls in the 125 and 250 mg/kg dose groups, respectively. There was no significant difference in the number of uterine implants (grand mean, 13.0±0.3). Dam absolute liver weight was significantly (p<0.0001) increased at ≥30 mg/kg, while relative liver weight was significantly (p<0.0001) increased in all dose groups (Figure 4B). Relative liver weight was increased by 15.3±1.0, 34.3±1.8, 47.4±5.8, 65.5±4.5, and 89.1±2.8% compared to controls in the 10–250 mg/kg dose groups, respectively.
Figure 4.

Violin plots (heavy horizontal line=median, dashed horizontal lines=quartiles) of (A) maternal body weight gain and (B) relative liver weight normalized to control, and (C) serum HFPO-DA concentration, and (D) liver HFPO-DA concentration across two dosing intervals, GD16–20 (white bars) and GD8–22 or PND2 (shaded bars). Data for 1 and 3 mg/kg/d exposure during GD16–20 interval not shown (no significant difference from control). Asterisks represent significant difference compared to respective interval control (*, p<0.05; **, p<0.01; ***, p<0.001; ****, p<0.0001). Hashes represent significant difference between intervals within a dose level (#, p<0.05; ##, p<0.01; ###, p<0.001; ####, p<0.0001).
At necropsy on PND2 dams displayed significantly reduced albumin (p<0.0001) at 250 mg/kg, increased triglycerides (p=0.0093, Figure 3E) at ≥125 mg/kg, and increased AST (p=0.0079) at all dose levels. Total T4 (p<0.0001) was reduced at ≥62.5 mg/kg and total T3 (p=0.053) was reduced at 62.5 and 125 mg/kg, but not 250 mg/kg (Table 2).
Table 2.
Serum analyses for maternal samples collected from GD16–20 and GD8-PND2 oral maternal exposure to HFPO-DA
| Maternal serum | |||||||||||||
|---|---|---|---|---|---|---|---|---|---|---|---|---|---|
| GD16–20 (mg/kg/d) | GD8-PND2 (mg/kg/d) | ||||||||||||
| 0 | 1 | 3 | 10 | 30 | 62.5 | 125 | 0 | 10 | 30 | 62.5 | 125 | 250 | |
| (n=6) | (n=4) | (n=4) | (n=4) | (n=4) | (n=4) | (n=4) | (n=5) | (n=5) | (n=5) | (n=4) | (n=5) | (n=5) | |
| Total T4 (ng/mL) | 18.6±1.8 | 16.7±1.2 | 15.3±2.1 | 14.2±2.9 | 15.3±1.4 | 12.1±0.7* | 8.4±0.6* | 32.4±3.6 | 29.7±2.4 | 26.2±1.5 | 16±1.5* | 13.7±1.6* | 10.8±1.0* |
| Total T3 (ng/mL) | 0.69±0.15 | 0.57±0.15 | 0.84±0.16 | 0.63±0.22 | 0.33±0.02 | 0.23±0.04* | 0.22±0.12* | 1.03±0.11 | 1.03±0.15 | 0.68±0.13 | 0.50±0.18* | 0.52±0.21* | 0.87±0.19 |
| Albumin (g/dL) | 3.01±0.13 | 2.85±0.05 | 2.59±0.09* | 3.01±0.14 | 2.85±0.03 | 2.54±0.09* | 2.47±0.06* | 3.92±0.08 | 3.81±0.07 | 3.86±0.14 | 3.73±0.07 | 3.7±0.1 | 3.18±0.07* |
| ALT (U/L) | 58±6 | 53±6 | 50±1 | 60±5 | 57±2 | 51±5 | 56±4 | 53±5 | 57±3 | 68±4 | 61±3 | 59±6 | 60±4 |
| AST (U/L) | 125±19 | 120±16 | 105±8 | 128±11 | 143±7 | 136±9 | 120±10 | 172±17 | 230±16* | 288±16* | 234±22* | 248±23* | 241±26* |
| Glucose (mg/dL) | 98±5 | 92±4 | 83±1 | 102±5 | 95±5 | 93±5 | 93±3 | 128±4 | 130±2 | 126±2 | 124±3 | 126±5 | 123±4 |
| Cholesterol (mg/dL) | 94±5 | 89±10 | 81±2 | 87±3 | 72±5* | 69±5* | 65±3* | 80±5 | 84±9 | 75±6 | 87±8 | 90±11 | 85±7 |
| Triglycerides (mg/dL) | 390±64 | 268±51 | 256±37 | 197±57* | 181±20* | 196±27* | 165±15* | 37±3 | 46±6 | 49±4 | 45±1 | 91±27* | 67±5* |
Values in bold with (*) significantly different from control. T4=thyroxine, T3=triiodothyronine, ALT=alanine aminotransferase, AST=aspartate aminotransferase
3.3. Fetal measurements from GD16–20 maternal exposure
There were no significant differences in male or female fetal body weights or liver weights on GD20 within a litter or across dose groups. When data for male and female body and liver weights were averaged within a litter, there was no significant difference in average fetal body or liver weight across any dose group compared to control (Supplemental Table 5).
3.4. Maternal effects from GD16–20 exposure
There were no significant effects on dam terminal body weight or body weight gain (Figure 4A) in any dose groups compared to control. Dams did display significantly increased relative liver weights in the 62.5 and 125 mg/kg dose groups (p=0.0043 and 0.0046, respectively) representing a 10.3% increase as compared to control for both dose levels (Figure 4B). There were no significant differences in numbers of viable fetuses or resorptions in treated versus control dams (Supplemental Table 5).
Maternal GD20 serum samples displayed dose responsive decreases in albumin (p=0.0013), cholesterol (p=0.0013, Figure 3C), and triglycerides (p=0.015, Figure 3F), but no alteration of ALT, AST, or glucose (non-fasting) (Table 1). Triglycerides were significantly reduced at ≥10 mg/kg, cholesterol was reduced at ≥30 mg/kg, and albumin was significantly reduced at 3 mg/kg and ≥62.5 mg/kg. Further, serum total triiodothyronine (T3, p=0.018) and thyroxine (T4, p=0.0014) were both significantly reduced at ≥ 62.5mg/kg.
3.5. Fetal, neonatal, and maternal liver gene expression
We utilized RT-qPCR gene arrays to investigate the expression of 84 target genes associated with PPAR signaling pathways in fetal (GD20), neonatal (PND0), and maternal (GD20) livers and 84 target genes associated with glucose metabolism in fetal and neonatal livers. Expression of five genes related to glucose metabolism were significantly affected compared to control (Pck1, Pdk4, Ugp2 – ANOVA p<0.001; G6pc and Pdp2 – ANOVA p<0.01; Figure 5A,B; Supplemental Table 6) in the GD20 fetal liver. All genes were significantly different from control at ≥10 mg/kg, except for G6pc which was significant at ≥3 mg/kg. Further, all genes were significantly upregulated, except for Ugp2 which was downregulated up to 5.1-fold compared to control. Pck1 was the most highly affected gene with upregulation of 37.5-fold compared to control in the top dose. No genes were significantly altered in the 1 mg/kg dose group. These genes code for proteins that are critical to gluconeogenesis (Pck1, G6pc), acetyl-CoA formation from pyruvate (Pdk4, Pdp2), and glycogen synthesis (Ugp2).
Figure 5.

Heatmaps of significantly altered Glucose Metabolism array genes in fetal livers from oral maternal exposure to HFPO-DA from GD16–20. (A) Genes with ANOVA p<0.001 and (B) genes with ANOVA p<0.01. Cell values represent significant (pairwise p<0.05) fold induction as compared to control for that dose level. Legend indicates fold-induction compared with control (Ctl, fold=1) with darker shaded genes (with white text) beyond the scale of the legend (> 10-fold).
We hypothesized that fetal livers exposed to HFPO-DA from GD16–20 would display similar alterations of PPAR signaling pathway genes as those we previously reported for GD14–18 exposed fetal livers (Conley et al. 2019). We assessed two fetal livers per dose and then statistically analyzed GD20 data with the GD18 data using dose and exposure interval as factors in two-way ANOVA. All 28 genes that were significantly upregulated on GD18 were also upregulated on GD20 (Supplemental Table 7), however 16 of these genes had a highly significant interval effect (p<0.001) and displayed greater upregulation on GD20 than on GD18 (Acaa2, Acadm, Acox1, Acsl1, Acsl3, Angptl4, Cpt1a, Dgat1, Ech1, Ehhadh, Fads2, Gk, Mlycd, Pck1, Rxrg, Scd1). The remaining upregulated genes did not differ significantly between GD18 and GD20 (Acadl, Acsl3, Acsl4, Aqp7, Cpt1b, Cpt2, Etfdh, Fabp1, Fabp5, Lpl, Slc22a5, Slc27a2). We also identified that the commonly used housekeeping gene Ldha was significantly upregulated on GD18 and was 78% more highly upregulated on GD20. This gene was not used for data normalization. There were no significantly downregulated genes. Overall, HFPO-DA exposure later in gestation produced greater gene expression effects on multiple PPAR pathway genes that code for proteins critical to mitochondrial (Acaa2, Acadm, Cpt1a) or peroxisomal fatty acid β-oxidation (Acox1, Ech1, Ehhadh) or both (Mlycd), gluconeogenesis (Pck1), glycerol metabolism (Gk), fatty acyl-CoA conversion (Acsl1, Acsl3), mediation of triglyceride clearance (Angptl4), triglyceride biosynthesis (Dgat1), fatty acid biosynthesis (Fads2, Scd1), and PPAR coactivation (Rxrg).
Newborn pup (PND0) liver subsamples were assessed for expression of Glucose Metabolism and PPAR Target genes, similar to GD20 fetal livers. Overall, there were 13 upregulated and 15 downregulated glucose metabolism genes, 11 of which were significantly different from control in all dose groups (Figure 6A,C; Supplemental Table 8). Similar to fetal livers, Pdk4 was upregulated and Ugp2 was downregulated, however unlike fetal livers, Pck1 and G6pc were unaffected. The most highly affected genes were associated with upregulated gluconeogenesis (Fbp2), downregulated glycolysis (Aldob), upregulated anaerobic glycolysis (Ldha), and downregulated glycogen degradation (Agl) and glycogen synthesis (Ugp2, Gsk3a). Similarly, there were a total of 21 upregulated and 8 downregulated PPAR signaling pathway genes, 21 of which were significantly different from control in all dose groups (Figure 6B,D; Supplemental Table 9). Many genes were consistently upregulated in GD18, GD20, and PND0 livers including (Acaa2, Acadm, Acox1, Acsl1, Acsl3, Acsl4, Angptl4, Cpt1a, Cpt1b, Dgat1, Ech1, Ehhadh, Fabp1, Fabp5, Fads2, Gk, Mlycd, Rxrg). However, the pattern of upregulation for many of these genes was noticeably different in that the PND0 liver fold induction levels appeared to plateau across most or all dose groups as opposed to a clear, dose-responsive increase. Several genes were unique to the PND0 liver including Apoa1, Apoc3, Cd36, Clu, Crebbp, Fabp2, Fabp7, Ppara, and Slc27a5. The most highly affected of these genes include: Fabp2 (downregulated) which acts a lipid sensor and high affinity long-chain fatty acid binding protein, Slc27a5 (downregulated) which activates very long-chain fatty acids and bile acids, Apoc3 (downregulated) which is associated with metabolism of triglyceride-rich lipoproteins, Ppara (downregulated) which codes for the PPAR alpha nuclear receptor, and Cd36 (upregulated) which has pleiotropic effects associated with angiogenesis, inflammation, and fatty acid metabolism. Overall, many genes associated with critical carbohydrate and lipid metabolism processes were highly affected at multiple life stages from HFPO-DA exposure.
Figure 6.

Heatmaps of significantly altered Glucose Metabolism (A,C) and PPAR Signaling Pathway (B,D) array genes in newborn pup livers from oral maternal exposure to HFPO-DA from GD8 through delivery on GD22. (A,B) Genes with ANOVA p<0.001 and (C,D) genes with ANOVA p<0.01. Cell values represent significant (pairwise p<0.05) fold induction as compared to control for that dose level. Legend indicates fold-induction compared with control (ctl, fold=1) with darker shaded genes (with white text) beyond the scale of the legend (> 10-fold or < −10-fold).
Similar to fetal livers, in maternal livers all 19 PPAR signaling pathway genes that were previously found to be upregulated on GD18 (Conley et al. 2019) were also significantly upregulated on GD20 (Supplemental Table 10). There was a significant interval effect producing greater upregulation of Acox1, Ehhadh, Fabp1, Fabp3, Hmgcs2, Rxrg, and Slc22a5 on GD20 than was found at GD18. The remaining genes that were significantly affected on GD18 did not have a significant interval effect and were upregulated to a similar degree on GD 20 (Acadm, Cpt1b, Cpt2, Ech1, Fads2, Hspd1, Scd1, Slc27a2, Txnip, Acaa2, Acsl3, Acadl). These genes code for proteins critical to both mitochondrial (Cpt1b, Cpt2, Acadl, Acadm, Acaa2) and peroxisomal (Acox1, Ech1, Ehhadh) fatty acid β-oxidation, ketogenesis (Hmgcs2), fatty acid transport (Fabp1, Fabp3, Slc27a2), fatty acyl-CoA conversion (Acsl3), triglyceride turnover (Fads2, Scd1), carnitine transport (Slc22a5), mitochondrial protein import (Hspd1), accumulation of reactive oxygen species (Txnip), and transcriptional coactivation (Rxrg).
3.6. HFPO-DA concentrations in maternal serum, fetal plasma, and pup plasma
Maternal serum and liver HFPO-DA concentrations increased as a function of oral dose during both the GD16–20 and GD8-PND2 dosing intervals (Figure 4C,D; Supplemental Table 11). There was no difference in serum or liver HFPO-DA concentration within a given dose group between the two dosing intervals indicating that longer exposure did not lead to bioaccumulation.
We compared GD20 fetal serum HFPO-DA concentrations with previously published GD18 serum concentrations (Conley et al. 2019) using two-way ANOVA. There was no effect of dosing interval on serum concentration so fetal serum levels were modeled using the means across these intervals. In contrast, there was a significant interval effect (p=0.018) for maternal serum levels with GD20 levels ~40% lower than GD18; therefore, we modeled GD18 and GD20 maternal serum separately. Fetal (y=0.79x+−0.62; R2=0.84) and GD18 (y=0.82x+−0.36; R2=0.88) and GD20 (y=0.92x+−0.25; R2=0.85) maternal serum concentrations increased log-linearly as a function of maternal oral dose (Figure 7A). The slopes of the regressions were statistically similar; however, the y-intercepts were significantly different, indicating that maternal serum concentrations were ~2–3-fold greater than fetal serum concentrations for a given maternal oral dose.
Figure 7.
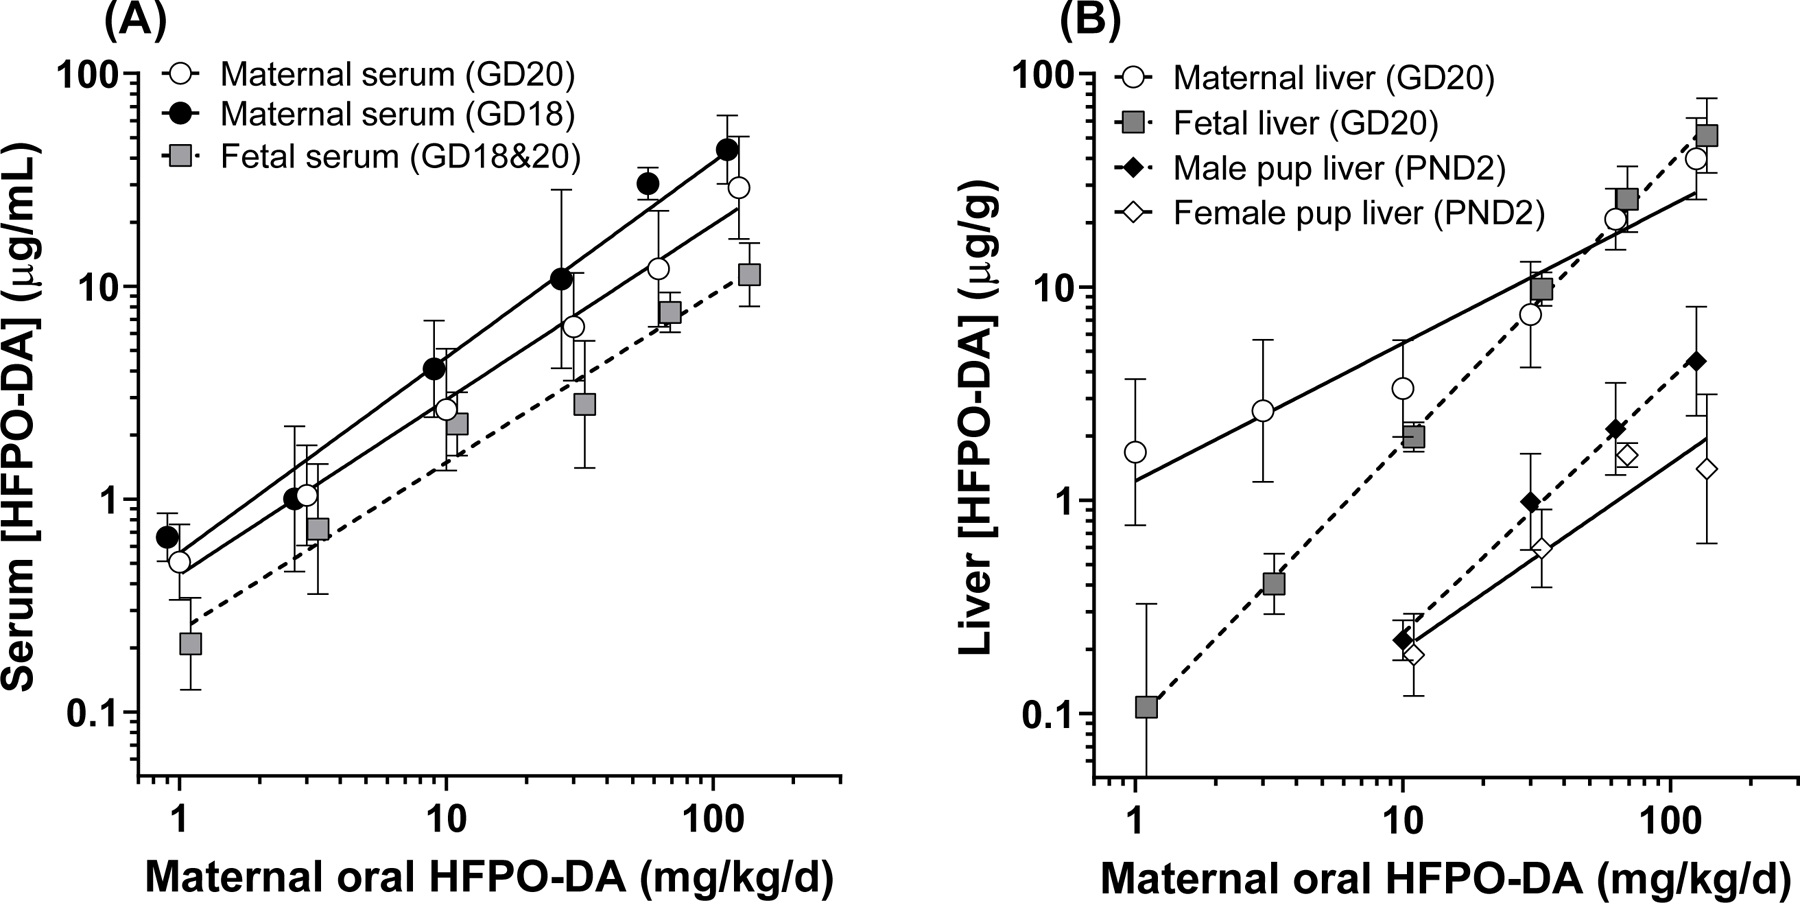
Maternal and fetal serum and liver HFPO-DA concentrations. (A) Log-linear regressions of HFPO-DA serum concentrations from GD14–18 (previously published in Conley et al. 2019) and GD16–20 exposure (current study). Maternal serum concentrations had a significant two-way ANOVA effect of dosing interval and are reported separately. Fetal serum concentrations were similar between intervals and are reported as combined. (B) Log-linear regressions of maternal (GD20), fetal (GD20), and neonatal (PND2 pup) liver HFPO-DA concentrations. GD20 fetal liver concentrations were not significantly different between male and female fetuses and are reported with sexes combined. PND2 liver concentrations had a significant two-way ANOVA affect of sex with female concentrations significantly lower than male concentrations, however both were ~10-fold lower than GD20 fetal liver concentrations.
Liver HFPO-DA concentrations also increased log-linearly as a function of maternal oral dose (Figure 7B). Unlike serum, GD20 fetal (y=1.3x‒1.0; R2=0.99) and maternal (y=0.65x+0.09; R2=0.92) models had significantly different slopes, which was largely driven by the elevated maternal liver concentrations in the low dose range (1–10 mg/kg). At the 30–125 mg/kg dose levels the fetal and maternal liver concentrations were nearly identical. There was a significant effect of sex (p=0.0035) on PND2 liver concentrations based on two-way ANOVA. Male pup (y=1.2x ‒ 1.8; R2=0.99) liver concentrations were 10–120% greater than female pup (y=0.87x ‒ 1.6; R2=0.90) concentrations, which was most prominent at the 125 mg/kg dose level. Regardless of sex, PND2 liver concentrations were greatly reduced (~10-fold less) compared to GD20 liver concentrations indicating low lactational transfer and/or rapid neonatal clearance.
3.7. Comparison to PFOS neonatal mortality
We compared the dose-response relationship for neonatal mortality between PFOS and HFPO-DA based on oral maternal dose, and maternal serum concentration on a mass/volume basis and molar basis (Figure 8A–C). PFOS data was derived from Lau et al. (2003) and Thibodeaux et al. (2003). Oral potency for HFPO-DA (ED50 =110.7 mg/kg) was ~35-fold weaker than PFOS (ED50 =3.1 mg/kg). However, based on maternal serum concentration HFPO-DA (EC50 =35.4 ug/mL) was ~2-fold more potent than PFOS (EC50 =74.5 ug/mL). Further, given that the molecular weight of PFOS (500 g/mol) is 34% greater than HFPO-DA (330 g/mol), the potency of PFOS (EC50 =148.9 uM) and HFPO-DA (EC50 =107.1 uM) are very similar when corrected for this difference.
Figure 8.
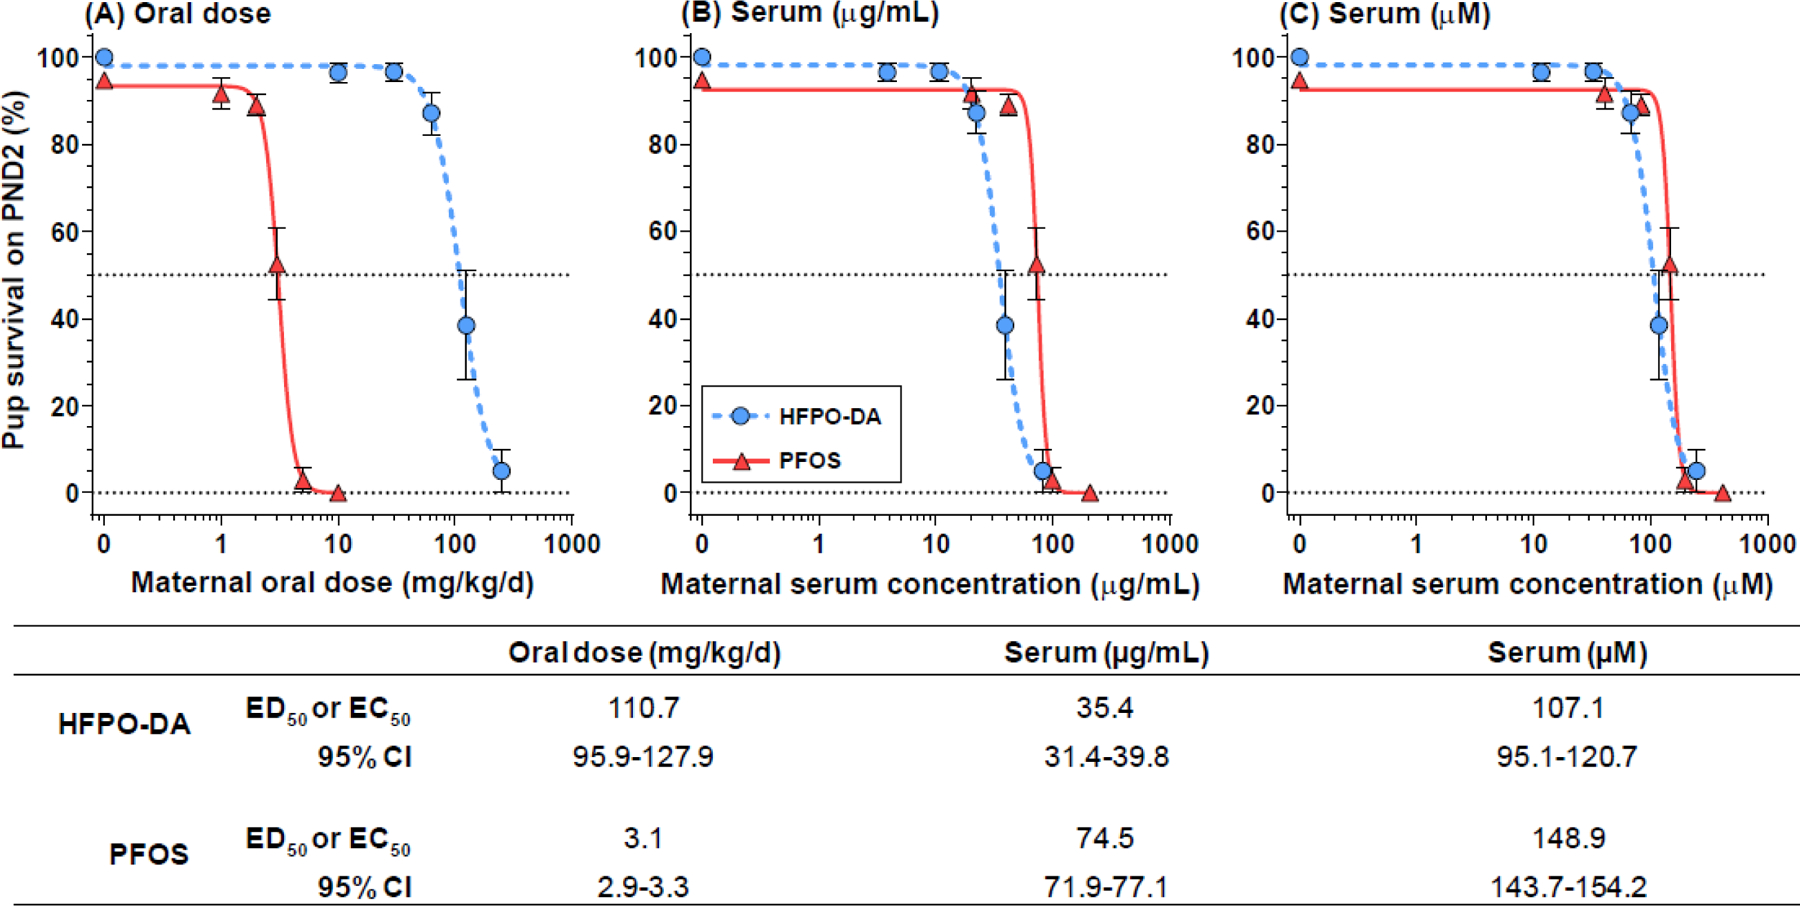
Dose response potency comparisons between HFPO-DA (current study) and PFOS (data from Lau et al. 2003 and Thibodeaux et al. 2003) for the effect of neonatal mortality following oral exposure to Sprague-Dawley rats during gestation. Dose response as functions of (A) oral dose, (B) serum concentration on mass/volume basis, and (C) serum concentration on molar basis. Table reports ED50 or EC50 parameter estimates and 95% confidence intervals. The two compounds vary by greater than 30-fold on an oral dose basis with PFOS considerably more potent than HFPO-DA; whereas, on a serum molar basis GenX is more potent with PFOS ~40% weaker.
3.8. Margin of internal exposure with human fluorochemical workers
Finally, to provide some human exposure context for the maternal and fetal/neonatal effects observed here, we compared maternal rat (PND2) serum concentrations to plasma concentrations from human fluorochemical workers in a HFPO-DA manufacturing facility in the Netherlands (DuPont 2017). We calculated margin of internal exposure (MOIE) to compare the mean maternal rat serum concentration at all doses of the present postnatal study to each of the fluorochemical worker concentrations (Figure 9). At the lowest dose (10 mg/kg - altered pup liver genes, reduced pup liver glycogen accumulation, increased maternal AST serum concentrations, and increased maternal and pup liver weights) the mean dam serum [HFPO-DA] was 10 to 1470-fold greater than the fluorochemical worker concentrations. Whereas, at the top dose (250 mg/kg – near complete neonatal mortality, large changes in maternal fetal liver weight, severely decreased gestational weight gain and birthweight, multiple altered serum clinical chemical parameters and thyroid hormones) the mean dam serum [HFPO-DA] was 246 to 34642-fold greater than the fluorochemical worker concentrations.
Figure 9.

Violin plots (heavy horizontal line=median, dashed horizontal lines=quartiles) of margin of internal exposure ratios between the mean maternal rat serum concentrations from the present postnatal study and fluorochemical worker serum concentrations from a HFPO-DA manufacturing facility in Dordrecht, Netherlands (EPA HERO Database study ID: 4353920).
4. DISCUSSION
Results of the current study demonstrate that HFPO-DA is a developmental toxicant in the Sprague-Dawley rat. In utero exposure to HFPO-DA reduced pup birth weights, increased pup liver weight, and reduced neonatal survival at dosage levels below those inducing overt maternal toxicities. These effects were plausibly induced by alterations in perinatal energy metabolism based on clinical chemistry, liver gene expression, and histopathological correlates. Dams also were affected, displaying reduced serum thyroid hormone levels, increased liver weights, and altered expression of genes, including those in the PPAR pathway. It is noteworthy that even though maternal serum and liver levels of HFPO-DA did not increase when dosing was extended from 4 days in the fetal studies to 16 days in the postnatal study, liver weight was more affected and at significantly lower dosage levels. The range of adverse effects resulting from oral maternal HFPO-DA exposure reported here are consistent with the limited data available in the published literature (Blake et al. 2020; Caverly Rae et al. 2015; Gannon et al. 2016; Rushing et al. 2017; Wang et al. 2017) and from guideline registration studies in the EPA HERO database (DuPont 2008a, b, 2010a, b). Further, the spectrum of maternal, fetal, and neonatal toxicities reported here and elsewhere are consistent with the extensive toxicity literature available for other PFAS, notably PFOS and PFOA (reviewed in (ATSDR 2018; ECHA 2014; OECD 2002; USEPA 2016a), and demonstrate that HFPO-DA is a developmental toxicant.
Based on our pilot study (Conley et al. 2019), which provided some indication of potential effects at a dose of 125 mg/kg following GD14–18 dosing, we hypothesized that expanded dosing may produce more discernable effects at this dose and higher doses. Instead, we observed significant pup mortality within 24 hours of birth, with near complete litter losses in the highest exposure group, which has not been previously reported for HFPO-DA. This occurred even though treated pups did not show any clinical indications of overt toxicity, displayed milk bands, and were active and nursing at birth. Dams displayed typical maternal behaviors including nest building, cleaning of the newborns, pup retrieval and nursing posture. The timing of neonatal pup mortality is consistent with prior gestational toxicity experiments conducted with other PFAS in laboratory rats. Multiple studies in Sprague-Dawley rats reported dose-responsive neonatal mortality following gestational PFOS exposure (Grasty et al. 2003; Lau et al. 2003; Luebker et al. 2005a; Luebker et al. 2005b). Further, Butenhoff et al. (2004) reported postnatal mortality in the Sprague-Dawley rat from PFOA exposure at dosage levels slightly below those observed for HFPO-DA. The developmental effects of other PFAS in the rat and similar effects in mouse models have been extensively reviewed (Abbott 2015; Lau et al. 2007).
The mechanisms by which some PFAS produce neonatal mortality have not been thoroughly identified or described. Cross-foster studies have indicated that in utero exposure alone to PFOS (Lau et al. 2003; Luebker et al. 2005a) and HFPO-DA (Conley, unpublished) is sufficient to induce neonatal mortality. Several studies have proposed that PFAS exposure (specifically PFOS) alters fetal lung development (Chen et al. 2012; Grasty et al. 2003); however, we focused on the maternal and fetal/neonatal liver and found multiple indications that disruption of carbohydrate and lipid metabolism across the maternal-placental-fetal unit were likely major key events in the observed adverse effects.
Glucose and lipid homeostasis are particularly critical during pregnancy to ensure proper nutrition to both the mother and developing fetus. These nutritional needs compete with one another and change throughout pregnancy and postpartum (see Ditzenberger (2018)). Early gestation is an anabolic state characterized by fat deposition and peripheral glucose utilization. Conversely, late gestation is a catabolic state characterized by breakdown of fat deposits, with peak levels of serum lipids occurring near term, and increased peripheral insulin resistance to make glucose more readily available to the fetus. Here, we observed dose-responsive reductions in late gestation maternal serum cholesterol and triglycerides consistent with the lipid lowering effects of PPAR α active compounds (described below). An opposing trend of increased triglycerides in postpartum (PND2) maternal serum was observed, although it is unclear whether this effect was a direct response of HFPO-DA exposure, or possibly a secondary effect of pup mortality and subsequent lack of ability to release milk leading to altered maternal serum lipid levels. Maternal derived glucose is the primary substrate for fetal energy production and storing adequate glycogen in hepatocytes (and in heart and lung tissue) near term is a critical aspect of fetal physiology to prepare for birth and satisfy energetic demands immediately after delivery (Shelley 1964). Newborns displayed hypoglycemia and elevated serum lipid levels consistent with impaired fetal glycogen storage (described below). Nutritional studies on maternal dietary glucose restriction during gestation in the rat produced a nearly identical phenotype of low birthweight followed by rapid neonatal mortality as observed here with HFPO-DA exposure (Koski et al. 1986; Lanoue et al. 1999). In addition, Grasty et al. (2003) identified a critical gestational window of exposure for PFOS-induced neonatal mortality (GD19–20) that is very similar to the critical window for glucose-restriction-induced neonatal mortality (GD20–21 (Koski and Hill 1990)). These studies indicate that dietary and/or chemical alteration of carbohydrate and lipid utilization and transfer between mother and offspring, particularly near term, can be detrimental to offspring health.
The fetal liver gene changes reported here indicate that the late term HFPO-DA exposed fetus may not have had sufficient glucose for glycogen synthesis. Specifically, Pck1 codes for the rate-limiting enzyme in gluconeogenesis and is not expressed in the control fetal liver because glucose is supplied via maternal-placental circulation at adequate levels (Wesolowski and Hay 2016). We observed dose-responsive upregulation of Pck1 (and G6pc, another gluconeogenic gene) indicating the fetal liver was upregulating glucose production. Further, Pdk4 (upregulated) prevents the conversion of pyruvate to acetyl-coA, thereby limiting glycolysis and preserving pyruvate as a gluconeogenic substrate, while Ugp2 (downregulated) codes for a rate-limiting enzyme in glycogen synthesis. Similarly, the newborn liver displayed prominent (>5-fold) gene changes related to suppression of glycolysis (downregulated Gapdh, Aldob), dysregulated glycogen metabolism (downregulated Ugp2, Agl), increased gluconeogenesis (upregulated Fbp2), and increased anaerobic glycolysis (upregulated Ldha). It is not clear which, if any, of these gene changes were a direct response of HFPO-DA interaction with a nuclear receptor or an indirect gene response due to changes in carbohydrate and lipid metabolic substrates in the liver. These liver gene changes associated with glucose dysregulation were supported by respective clinical and histopathological correlates of hypoglycemia and reduced glycogen accumulation in the neonatal liver at birth. Similarly, oral PFOA exposure in adult male Balb/c mice produced hypoglycemia and reduced liver glycogen content indicating PFOA may promote carbohydrate consumption and reduce carbohydrate storage (Zheng et al. 2017). The totality of these observations indicates a clear mechanistic link with dysregulation of carbohydrate and lipid metabolism in the mother and developing offspring.
In addition to the observed neonatal mortality, the birthweight, growth rates, and PND2 body weights of surviving pups were significantly lower at ≥30 mg/kg. Similar to above, previous studies with laboratory rats have reported low birth weight and stunted growth of surviving pups following PFOS and PFOA exposure. Lau et al. (2003) reported that pups exposed in utero to PFOS at ≥2 mg/kg displayed lower body weights and Luebker (2005b) reported the same response in all dose levels tested (i.e., ≥0.4 mg/kg). Butenhoff et al. (2004) reported reduced pup body weight at 30 mg/kg PFOA exposure, indicating that PFOA and HFPO-DA are equipotent in reducing fetal/pup growth. Studies of placental insufficiency and intrauterine growth restriction (IUGR) in sheep reported fetal liver gene changes (upregulated Pck1, G6pc, Pdk4, Ldha) strikingly similar to those reported here for GD20 fetal livers, which are also associated with aberrant fetal hepatic glucose production (Brown et al. 2015). Relatedly, glycogen storage disease is a rare autosomal recessive disorder in humans in which enzyme deficiencies result in an inability to liberate liver glycogen reserves at birth and patients present with hepatomegaly, hypoglycemia, hyperlipidemia, and growth restriction (Kishnani et al. 2014). All of the symptoms of human glycogen storage disease were observed here in F1 rats; however, as opposed to an inability to liberate glycogen, it appears HFPO-DA exposed F1 rats did not accumulate sufficient glycogen during late gestation.
It is important to note that in humans birthweight is a major predictor of infant and later life morbidity and mortality (McIntire et al. 1999). In the US 8.28% of all infant deliveries were low birthweight (<2.5 kg) and 1.38% were very low birthweight (<1.5 kg) in 2018 (Martin et al. 2019). Multiple epidemiological studies have reported a significant negative association between human birth weight and maternal concentrations of PFOS/PFOA (reviewed in (Bach et al. 2015; Negri et al. 2017)). Further, IUGR associated with aberrant fetal hepatic glucose production is associated with metabolic syndrome (Symonds et al. 2009) and specifically with Type 2 diabetes mellitus (Martin-Gronert and Ozanne 2007). In humans, prenatal and adult exposure to PFAS have been associated with diabetes (Cardenas et al. 2019; McGlinchey et al. 2020). The role that exposure to HFPO-DA or other PFAS play in the manifestation of human metabolic disorders deserves further attention given the strength of data in animal and epidemiological studies.
The gene expression data reported here and in our previous study (Conley et al. 2019) provides evidence for PPAR alpha (α) activation in the maternal, fetal, and neonatal livers. The relevance of rodent hepatocarcinoma induced via a PPARα mechanism of action has been described as an adverse effect that is not relevant to humans due to signaling pathway differences between rodents and humans (Corton et al. 2014; Corton et al. 2018). However, PPARα is universally recognized as the “master regulator of lipid metabolism” and also plays a key role in carbohydrate metabolism in all vertebrate classes (Kersten et al. 1999; Kersten 2014). PPARs are a well-known pharmacological target for the treatment of multiple diseases in humans, including the PPARα-activating fibrates and the PPAR gamma (γ)-activating thiazolidinediones; however, the development of some of these was halted because of adverse side effects such as increased cardiovascular risk, carcinogenicity, liver toxicity, and renal injury in clinical trials (Hong et al. 2018). Further, the dual PPARα/PPARγ-activating glitazar class of drugs have been studied for several years and thus far all candidate drugs have failed either Phase II or III clinical trials due to adverse toxicities (Fievet et al. 2006; Waites et al. 2007). Clearly, modulation of both PPARα and/or PPARγ by exogenous agents, such as PFAS, are relevant to human health and the spectrum of adverse effects in laboratory animal studies are consistent with the physiological mechanisms that are targeted by pharmacologic agents/therapies.
It has also been argued that humans are considerably less responsive to PPARα-active chemical exposures because human hepatocytes were reported to display ~10-fold lower PPARα-DNA binding activity than mouse hepatocytes (Palmer et al. 1998). In contrast, more recent laboratory studies have reported that PPARα is well expressed in human liver slices (Janssen et al. 2015) and that gene expression levels of PPARα in primary human and mouse hepatocytes are similar (Rakhshandehroo et al. 2009). Prototypical PPARα regulated genes such as Angptl4, Cpt1a, Pdk4, which were highly upregulated in maternal, fetal, and neonatal livers here, were robustly upregulated in human liver slices following exposure to the PPARα-specific agonist Wy14643 (Janssen et al. 2015). Human and mouse primary hepatocytes both displayed upregulation of Cpt1a, Hmgcs2, Fabp1, and Acsl1 following fenofibrate exposure, similar to the HFPO-DA exposures here. These studies also reported divergent sets of genes between mouse and human, however it is important that the overall pathway of lipid metabolism as regulated by PPARα is highly conserved between rodents and humans. Although the PPAR pathways are conserved in all mammalian species and share a common molecular initiating event (i.e., PPAR binding and activation), differences in some of the downstream genomic key events in PPAR-relevant AOPs lead to different profiles of adverse effects among rodents and humans when the pathways are activated.
Both PFOS and PFOA were previously shown to activate both PPARα and PPARγ in vitro (Vanden Heuvel et al. 2006). Data from our research group indicates that HFPO-DA also activates human and rat variants of both PPARα and PPARγ in vitro but not PPAR beta/delta (β/δ) or the estrogen, androgen, or glucocorticoid receptors (Evans et al. 2020). Among the PFAS examined to date, HFPO-DA was one of the most potent in inducing PPARα. Data from the qPCR arrays utilized in the current study indicated that PPARγ was undetected in fetal, neonatal, and maternal rat liver samples (PPARα and PPARβ/δ strongly expressed). However, preliminary data from our group indicates that mRNA for PPARγ and PPARβ/δ are highly expressed in the rat placenta on GD18, whereas PPARα mRNA appears to be less abundant. The importance of PPARγ in placental function and other tissues has been extensively reviewed (Heikkinen et al. 2007) and recent studies of HFPO-DA reported extensive histopathological effects of exposure in mouse placenta (Blake et al. 2020). In addition to PPARα and PPARγ, numerous studies have identified additional nuclear receptor activity for various PFAS compounds including CAR, PXR, and LXRα (Bjork et al. 2011; Rosen et al. 2017). While a strong PPARα response has been shown for many PFAS, including HFPO-DA, it is also clear that many PFAS display a multiplicity of nuclear receptor activities and, as such, a single molecular initiating event is not likely singularly responsible for the range of adverse effects described to date.
The invention of the GenX technology that utilizes HFPO-DA as a processing aid for generating fluoropolymers in place of PFOA was reported to have “a favorable toxicological profile and very rapid bioelimination” (DuPont 2010c). When comparing available toxicity data for the two compounds it appears that PFOA and HFPO-DA display similar activities and potencies. Butenhoff et al. (2004) reported 9.5% reduction in F1 body weight on PND1 following gestational exposure to PFOA at 30 mg/kg; whereas, here we observed a 17.3% reduction on PND1 from HFPO-DA at 30 mg/kg. Further, Butenhoff et al. (2004) reported 6.7% mortality as scored on PND22 at 30 mg/kg PFOA, while here we observed 3.4% mortality by PND2 from 30 mg/kg HFPO-DA (important to note difference in timepoints for this comparison as mortality was shown to increase from PND2 to weaning in Lau et al. 2003). Based on this limited developmental toxicity data for PFOA and the data presented here, it appears that HFPO-DA may be similar to PFOA on an oral dose basis in the rat during this life stage.
More extensive developmental toxicity studies have been conducted with PFOS in the rat and the oral potency for inducing neonatal mortality is much greater than for HFPO-DA. Luebker et al. (2005b) and Lau et al. (2003) both reported significant neonatal pup mortality at 1.6 and 2 mg/kg for PFOS, respectively, compared to the 62.5 mg/kg we found here for HFPO-DA (31 – 39-fold difference). However, Gomis et al. (2018) recently reported on the potential discrepancy in toxicity among a range of PFAS when using orally administered dose as compared to serum concentrations. By accounting for toxicokinetics in rats across multiple PFAS, the toxicity of some fluorinated alternatives appears to be more equitable to the long-chain PFAS when potency is compared based on serum levels. For comparison we plotted the relationship between maternal serum concentration and neonatal pup mortality for the Lau et al. (2003) and Thibodeaux et al. (2003) studies on PFOS and the present HFPO-DA data. Based on internal dose the EC50 for HFPO-DA was significantly lower than the EC50 for PFOS in producing neonatal mortality on PND 2 (~2-fold lower EC50). However, it is important to highlight the substantial toxicokinetic differences between PFOS and HFPO-DA in the rat. In the female rat, HFPO-DA has a reported half-life of ~5 hrs following oral exposure to 10–30 mg/kg (Gannon et al. 2016) and is not expected to accumulate, whereas PFOS has a reported half-life of ~60–70 days following oral exposure to 2–15 mg/kg (Chang et al. 2012) and does accumulate. Our samples were collected 2 hours after the final oral dose, which is just slightly after the peak serum concentration is achieved in the female rat based on the Gomis et al. (2018) model. It is also important to note that the molecular weight of HFPO-DA (330.05 g/mol) is 34% less than that of PFOS (500.13 g/mol), making the discrepancy in potency we report here slightly less when calculated on a molar basis (~28% lower EC50 for HFPO-DA than PFOS).
In addition to intraspecies differences in PFAS toxicokinetics, it is also important to note that interspecies differences in absorption, distribution, metabolism, and excretion of PFAS are vast, with half-lives and clearance rates of numerous compounds appearing to be significantly longer in humans and non-human primates than rats/mice (Chang et al. 2012; Olsen et al. 2007). Unfortunately, half-life data for PFAS are limited to a handful of this large chemical class. For this reason, it is important to include measurement of serum and tissue levels in studies on the health effects of PFAS in order to be able to determine the MOIE and relevance of the oral doses used in rodent studies to levels of PFAS in humans, where known. Furthermore, it has been argued that the mouse is a better toxicological model for PFAS effects because they are more sensitive on an oral dose basis; however, similar to above, when comparing serum concentrations, effects are observed in the rat at lower concentrations. For example, maternal rat serum concentrations from the current study (3.1 µg/mL at 10 mg/kg/d on GD 20) were ~19-fold lower than mouse serum concentrations from the same oral dose (58.5 µg/mL at 10 mg/kg/d on GD 17.5) used by Blake et al. (2020). Overall, characterizing toxicokinetics and internal dosimetry for PFAS, including HFPO-DA, can facilitate the determination of the relevance of doses across laboratory animal studies and for extrapolation to human exposures, thereby reducing some of the uncertainty in estimating human health risks from exposure.
The HFPO-DA toxicity profile observed here characterizes HFPO-DA as a developmental toxicant and the effects were consistent with peer-reviewed and industry guideline studies for HFPO-DA, as well as studies conducted for PFOA and PFOS (among other PFAS). It does appear that HFPO-DA is much more rapidly cleared in the rat than other long-chain PFAS; however, this also means that HFPO-DA appears to be more potent than PFOS at producing neonatal mortality in the rat when dose-response is modeled as a function of serum concentration as opposed to oral administered dose. A critical data gap for human health risk assessment is characterization of the human half-life of HFPO-DA. A recent study of a historically exposed population found no detections of HFPO-DA in human serum above reporting limits (2 ng/mL), which anecdotally indicates that humans likely also rapidly clear HFPO-DA (Kotlarz et al. 2020). Although, data from the present study indicate that bioaccumulation of PFAS is not necessary for manifestation of severe adverse effects. Mechanistically, we observed numerous findings in this study indicating HFPO-DA is a PPAR agonist, but the relevance of PPARα and γ activation to potential perturbation of human physiology should not be ignored, particularly in light of the extensive historical use of PPARα and γ agonists in pharmacology, and also when considering the unique sensitivities during pregnancy. In addition to the PPAR pathways, it is likely that additional MIEs are responsible for the multiplicity of effects of HFPO-DA and other PFAS.
Supplementary Material
ACKNOWLEDGEMENTS
The authors would like to thank Dr. Leslie Jarrell (USEPA) for assistance with the studies, Dr. AtLee Watson (NIEHS) for reviewing prior versions of the manuscript, Dr. James Bonner (NC State University) for assistance with imaging, Matthew Hartman (USEPA/ORAU) for assistance with data interpretation, and two anonymous reviewers for comments made on prior drafts of the manuscript. This work was supported by the U.S. Environmental Protection Agency Chemical Safety for Sustainability Research Action Program under the Adverse Outcome Pathway Research Area.
FUNDING
This work was supported by the U.S. Environmental Protection Agency Office of Research and Development Chemical Safety for Sustainability Research Action Plan.
Abbreviations:
- HFPO-DA
hexafluoropropylene oxide-dimer acid
- PFAS
per- and polyfluoroalkyl substances
- PFOA
perfluorooctanoic acid
- PFOS
perfluorooctane sulfonate
- PFECA
perfluoroalkyl ether carboxylic acid
- PFESA
perfluoroalkyl ether sulfonic acid
- GD
gestation day
- PND
postnatal day
- PPAR
peroxisome proliferator-activated receptor
Footnotes
Publisher's Disclaimer: DISCLAIMER
Publisher's Disclaimer: The manuscript has been subjected to review by the U.S. Environmental Protection Agency Center for Public Health and Environmental Assessment and approved for publication. Approval does not signify that the contents necessarily reflect the views or policy of the Agency, nor does mention of trade names or commercial products constitute endorsement or recommendation for use.
SUPPLEMENTAL MATERIAL
Includes complete data tables with means, standard errors, and samples sizes for all endpoints evaluated in the present studies.
REFERENCES
- Abbott BD, Wolf CJ, Schmid JE, Das KP, Zehr RD, Helfant L, et al. 2007. Perfluorooctanoic acid induced developmental toxicity in the mouse is dependent on expression of peroxisome proliferator activated receptor-alpha. Toxicol Sci 98:571–581. doi: 10.1093/toxsci/kfm110 [DOI] [PubMed] [Google Scholar]
- Abbott BD, Wolf CJ, Das KP, Zehr RD, Schmid JE, Lindstrom AB, et al. 2009. Developmental toxicity of perfluorooctane sulfonate (PFOS) is not dependent on expression of peroxisome proliferator activated receptor-alpha (PPAR alpha) in the mouse. Reprod Toxicol 27:258–265. doi: 10.1016/j.reprotox.2008.05.061 [DOI] [PubMed] [Google Scholar]
- Abbott BD. 2015. Developmental Toxicity. In: Toxicological Effects of Perfluoroalkyl and Polyfluoroalkyl substances, (DeWitt JC, ed). Switzerland:Springer International Publishing, 203–218. [Google Scholar]
- ATSDR. 2018. Toxicological Profile for Perfluoroalkyls: Draft for Public Comment June 2018. US Department of Health and Human Services CS274127-A. doi:
- Bach CC, Bech BH, Brix N, Nohr EA, Bonde JP, Henriksen TB. 2015. Perfluoroalkyl and polyfluoroalkyl substances and human fetal growth: a systematic review. Crit Rev Toxicol 45:53–67. doi: 10.3109/10408444.2014.952400 [DOI] [PubMed] [Google Scholar]
- Beekman M, Zweers P, Muller A, de Vries W, Janssen P, Zeilmaker M. 2016. Evaluation of substances used in the GenX technology by Chemours, Dordrecht. National Institute for Public Health and the Environment Ministry of Health, Welfare and Sport:Netherlands. doi: [Google Scholar]
- Bessems JGM, Paini A, Gajewska M, Worth A. 2017. The margin of internal exposure (MOIE) concept for dermal risk assessment based on oral toxicity data - A case study with caffeine. Toxicology 392:119–129. doi: 10.1016/j.tox.2017.03.012 [DOI] [PMC free article] [PubMed] [Google Scholar]
- Bjork JA, Butenhoff JL, Wallace KB. 2011. Multiplicity of nuclear receptor activation by PFOA and PFOS in primary human and rodent hepatocytes. Toxicology 288:8–17. doi: 10.1016/j.tox.2011.06.012 [DOI] [PubMed] [Google Scholar]
- Blake BE, Cope HA, Hall SM, Keys RD, Mahler BW, McCord J, et al. 2020. Evaluation of Maternal, Embryo, and Placental Effects in CD-1 Mice following Gestational Exposure to Perfluorooctanoic Acid (PFOA) or Hexafluoropropylene Oxide Dimer Acid (HFPO-DA or GenX). Environ Health Perspect 128:27006. doi: 10.1289/EHP6233 [DOI] [PMC free article] [PubMed] [Google Scholar]
- Brown LD, Rozance PJ, Bruce JL, Friedman JE, Hay WW Jr., Wesolowski SR. 2015. Limited capacity for glucose oxidation in fetal sheep with intrauterine growth restriction. Am J Physiol Regul Integr Comp Physiol 309:R920–928. doi: 10.1152/ajpregu.00197.2015 [DOI] [PMC free article] [PubMed] [Google Scholar]
- Butenhoff JL, Kennedy GL Jr., Frame SR, O’Connor JC, York RG. 2004. The reproductive toxicology of ammonium perfluorooctanoate (APFO) in the rat. Toxicology 196:95–116. doi: 10.1016/j.tox.2003.11.005 [DOI] [PubMed] [Google Scholar]
- Cardenas A, Hivert M, Gold DR, Hauser R, Kleinman KP, Lin PD, et al. 2019. Associations of perfluoroalkyl and polyfluoroalkyl substances with incident diabetes and microvascular disease. Diabetes Care 42:1824–1832. doi: 10.2337/dc18-2254 [DOI] [PMC free article] [PubMed] [Google Scholar]
- Caverly Rae JM, Craig L, Slone TW, Frame SR, Buxton LW, Kennedy GL. 2015. Evaluation of chronic toxicity and carcinogenicity of ammonium 2,3,3,3-tetrafluoro-2-(heptafluoropropoxy)-propanoate in Sprague-Dawley rats. Toxicol Rep 2:939–949. doi: 10.1016/j.toxrep.2015.06.001 [DOI] [PMC free article] [PubMed] [Google Scholar]
- Chang SC, Noker PE, Gorman GS, Gibson SJ, Hart JA, Ehresman DJ, et al. 2012. Comparative pharmacokinetics of perfluorooctanesulfonate (PFOS) in rats, mice, and monkeys. Reprod Toxicol 33:428–440. doi: 10.1016/j.reprotox.2011.07.002 [DOI] [PubMed] [Google Scholar]
- Chen T, Zhang L, Yue JQ, Lv ZQ, Xia W, Wan YJ, et al. 2012. Prenatal PFOS exposure induces oxidative stress and apoptosis in the lung of rat off-spring. Reprod Toxicol 33:538–545. doi: 10.1016/j.reprotox.2011.03.003 [DOI] [PubMed] [Google Scholar]
- Conley JM, Lambright CS, Evans N, Strynar MJ, McCord J, McIntyre BS, et al. 2019. Adverse Maternal, Fetal, and Postnatal Effects of Hexafluoropropylene Oxide Dimer Acid (GenX) from Oral Gestational Exposure in Sprague-Dawley Rats. Environ Health Perspect 127:37008. doi: 10.1289/EHP4372 [DOI] [PMC free article] [PubMed] [Google Scholar]
- Corton JC, Cunningham ML, Hummer BT, Lau C, Meek B, Peters JM, et al. 2014. Mode of action framework analysis for receptor-mediated toxicity: The peroxisome proliferator-activated receptor alpha (PPARalpha) as a case study. Crit Rev Toxicol 44:1–49. doi: 10.3109/10408444.2013.835784 [DOI] [PubMed] [Google Scholar]
- Corton JC, Peters JM, Klaunig JE. 2018. The PPARalpha-dependent rodent liver tumor response is not relevant to humans: addressing misconceptions. Arch Toxicol 92:83–119. doi: 10.1007/s00204-017-2094-7 [DOI] [PMC free article] [PubMed] [Google Scholar]
- Ditzenberger GR. 2018. Carbohydrate, Fat, and Protein Metabolism. In: Maternal, Fetal, & Neonatal Physiology: A Clinical Perspective 5th Editions, (Blackburn ST, ed). St. Louis, MO:Elsevier, 543–570. [Google Scholar]
- DuPont. 2008a. DuPont-24447: A 28-day oral (gavage) toxicity study of H-28397 in rats with a 28-day recovery. Study #WIL-189205. OECD Guideline 407. Conducted by WIL Research Laboratories, LLC. EI du Pont de Nemours and Company 1–4; USEPA HERO ID: 4221045–4221050. doi: [Google Scholar]
- DuPont. 2008b. DuPont-24459: A 28-day oral (gavage) toxicity study of H-28397 in mice with a 28-day recovery. Study #WIL-189205. OECD Guideline 407. Conducted by WIL Research Laboratories, LLC. EI du Pont de Nemours and Company 1–4; USEPA HERO ID: 4221051–4221054. doi: [Google Scholar]
- DuPont. 2010a. DuPont-18405–841: An oral (gavage) prenatal developmental toxicity study of H-28548 in rats. OECD Guideline 414. EI du Pont de Nemours and Company; USEPA HERO ID: 4222145. doi: [Google Scholar]
- DuPont. 2010b. DuPont-18405–1037: An oral (gavage) reproduction/developmental toxicity screening study of H-28548 in mice. EI du Pont de Nemours and Company; USEPA HERO ID: 4222148. doi: [Google Scholar]
- DuPont. 2010c. DuPont GenX Processing Aid for Making Fluoropolymer Resins: Setting a New Industry Standard for Sustainable Replacement Technology. https://bladenonlinecom/wp-content/uploads/2017/06/Chemours_GenX_Brochure_Final_07July2010pdf Accessed 13 June 2018. doi:
- DuPont. 2017. DuPont-C30031_516655: Determination of HFPO-DA in EDTA human plasma samples. Charles River Laboratories. The Chemours Company; USEPA HERO ID: 4353920. doi: [Google Scholar]
- ECHA. 2014. Annex XV Restriction Report: Proposal for Restriction - Perfluorooctanoic acid (PFOA), PFOA salts and PFOA-related substances. doi:
- Evans N, Cardon M, Hartig P, Medlock Kakaley E, Wilson VS, Conley JM, et al. 2020. In vitro binding of human and rat PPAR alpha, beta/delta, and gamma receptors to PFAS, fatty acids, and clofibric acid. The Toxicologist: Supplement to Toxicological Sciences 174. doi:
- Fievet C, Fruchart JC, Staels B. 2006. PPARalpha and PPARgamma dual agonists for the treatment of type 2 diabetes and the metabolic syndrome. Curr Opin Pharmacol 6:606–614. doi: 10.1016/j.coph.2006.06.009 [DOI] [PubMed] [Google Scholar]
- Galloway JE, Moreno AVP, Lindstrom AB, Strynar MJ, Newton S, May AA, et al. 2020. Evidence of Air Dispersion: HFPO-DA and PFOA in Ohio and West Virginia Surface Water and Soil near a Fluoropolymer Production Facility. Environ Sci Technol 54:7175–7184. doi: 10.1021/acs.est.9b07384 [DOI] [PMC free article] [PubMed] [Google Scholar]
- Gannon SA, Fasano WJ, Mawn MP, Nabb DL, Buck RC, Buxton LW, et al. 2016. Absorption, distribution, metabolism, excretion, and kinetics of 2,3,3,3-tetrafluoro-2-(heptafluoropropoxy)propanoic acid ammonium salt following a single dose in rat, mouse, and cynomolgus monkey. Toxicology 340:1–9. doi: 10.1016/j.tox.2015.12.006 [DOI] [PubMed] [Google Scholar]
- Gebbink WA, van Asseldonk L, van Leeuwen SPJ. 2017. Presence of Emerging Per- and Polyfluoroalkyl Substances (PFASs) in River and Drinking Water near a Fluorochemical Production Plant in the Netherlands. Environ Sci Technol 51:11057–11065. doi: 10.1021/acs.est.7b02488 [DOI] [PMC free article] [PubMed] [Google Scholar]
- Gomis MI, Vestergren R, Borg D, Cousins IT. 2018. Comparing the toxic potency in vivo of long-chain perfluoroalkyl acids and fluorinated alternatives. Environ Int 113:1–9. doi: 10.1016/j.envint.2018.01.011 [DOI] [PubMed] [Google Scholar]
- Grasty RC, Grey BE, Lau CS, Rogers JM. 2003. Prenatal window of susceptibility to perfluorooctane sulfonate-induced neonatal mortality in the Sprague-Dawley rat. Birth Defects Res B Dev Reprod Toxicol 68:465–471. doi: [DOI] [PubMed] [Google Scholar]
- Heikkinen S, Auwerx J, Argmann CA. 2007. PPAR gamma in human and mouse physiology. Biochim Biophys Acta 1771:999–1013. doi: [DOI] [PMC free article] [PubMed] [Google Scholar]
- Hong F, Xu P, Zhai Y. 2018. The Opportunities and Challenges of Peroxisome Proliferator-Activated Receptors Ligands in Clinical Drug Discovery and Development. Int J Mol Sci 19. doi: 10.3390/ijms19082189 [DOI] [PMC free article] [PubMed] [Google Scholar]
- Janssen AW, Betzel B, Stoopen G, Berends FJ, Janssen IM, Peijnenburg AA, et al. 2015. The impact of PPARalpha activation on whole genome gene expression in human precision cut liver slices. BMC Genomics 16:760. doi: 10.1186/s12864-015-1969-3 [DOI] [PMC free article] [PubMed] [Google Scholar]
- Kersten S, Seydoux J, Peters JM, Gonzalez FJ, Desvergne B, Wahli W. 1999. Peroxisome proliferator-activated receptor alpha mediates the adaptive response to fasting. J Clin Invest 103:1489–1498. doi: 10.1172/JCI6223 [DOI] [PMC free article] [PubMed] [Google Scholar]
- Kersten S 2014. Integrated physiology and systems biology of PPARalpha. Mol Metab 3:354–371. doi: 10.1016/j.molmet.2014.02.002 [DOI] [PMC free article] [PubMed] [Google Scholar]
- Kishnani PS, Austin SL, Abdenur JE, Arn P, Bali DS, Boney A, et al. 2014. Diagnosis and management of glycogen storage disease type I: a practice guideline of the American College of Medical Genetics and Genomics. Genet Med 16:e1. doi: 10.1038/gim.2014.128 [DOI] [PubMed] [Google Scholar]
- Koski KG, Hill FW, Hurley LS. 1986. Effect of low carbohydrate diets during pregnancy on embryogenesis and fetal growth and development in rats. J Nutr 116:1922–1937. doi: [DOI] [PubMed] [Google Scholar]
- Koski KG, Hill FW. 1990. Evidence for a critical period during late gestation when maternal dietary carbohydrate is essential for survival of newborn rats. J Nutr 120:1016–1027. doi: [DOI] [PubMed] [Google Scholar]
- Kotlarz N, McCord J, Collier D, Lea CS, Strynar M, Lindstrom AB, et al. 2020. Measurement of Novel, Drinking Water-Associated PFAS in Blood from Adults and Children in Wilmington, North Carolina. Environmental Health Perspectives 128. doi: 10.1289/ehp6837 [DOI] [PMC free article] [PubMed] [Google Scholar]
- Lanoue L, Liu X, Koski KG. 1999. Postnatal Profiles of Glycogenolysis and Gluconeogenesis Are Modified in Rat Pups by Maternal Dietary Glucose Restriction. J Nutr 129(4):820–827. doi: [DOI] [PubMed] [Google Scholar]
- Lau C, Thibodeaux JR, Hanson RG, Rogers JM, Grey BE, Stanton ME, et al. 2003. Exposure to perfluorooctane sulfonate during pregnancy in rat and mouse. II: postnatal evaluation. Toxicol Sci 74:382–392. doi: 10.1093/toxsci/kfg122 [DOI] [PubMed] [Google Scholar]
- Lau C, Anitole K, Hodes C, Lai D, Pfahles-Hutchens A, Seed J. 2007. Perfluoroalkyl acids: a review of monitoring and toxicological findings. Toxicol Sci 99:366–394. doi: 10.1093/toxsci/kfm128 [DOI] [PubMed] [Google Scholar]
- Lina BA, Kuijpers MH. 2004. Toxicity and carcinogenicity of acidogenic or alkalogenic diets in rats; effects of feeding NH(4)Cl, KHCO(3) or KCl. Food Chem Toxicol 42:135–153. doi: 10.1016/j.fct.2003.08.011 [DOI] [PubMed] [Google Scholar]
- Luebker DJ, Case MT, York RG, Moore JA, Hansen KJ, Butenhoff JL. 2005a. Two-generation reproduction and cross-foster studies of perfluorooctanesulfonate (PFOS) in rats. Toxicology 215:126–148. doi: 10.1016/j.tox.2005.07.018 [DOI] [PubMed] [Google Scholar]
- Luebker DJ, York RG, Hansen KJ, Moore JA, Butenhoff JL. 2005b. Neonatal mortality from in utero exposure to perfluorooctanesulfonate (PFOS) in Sprague-Dawley rats: dose-response, and biochemical and pharamacokinetic parameters. Toxicology 215:149–169. doi: 10.1016/j.tox.2005.07.019 [DOI] [PubMed] [Google Scholar]
- Martin-Gronert MS, Ozanne SE. 2007. Experimental IUGR and later diabetes. J Intern Med 261:437–452. doi: 10.1111/j.1365-2796.2007.01800.x [DOI] [PubMed] [Google Scholar]
- Martin JA, Hamilton BE, Osterman JK, Driscoll AK. 2019. Births: Final Data for 2018. National Vital Statistics Reports 68:1–47. doi: [PubMed] [Google Scholar]
- McCord J, Newton S, Strynar M. 2018. Validation of quantitative measurements and semi-quantitative estimates of emerging perfluoroethercarboxylic acids (PFECAs) and hexfluoroprolyene oxide acids (HFPOAs). J Chromatogr A 1551:52–58. doi: 10.1016/j.chroma.2018.03.047 [DOI] [PMC free article] [PubMed] [Google Scholar]
- McGlinchey A, Sinioja T, Lamichhane S, Sen P, Bodin J, Siljander H, et al. 2020. Prenatal exposure to perfluoroalkyl substances modulates neonatal serum phospholipids, increasing risk of type 1 diabetes. Environ Int 143:105935. doi: 10.1016/j.envint.2020.105935 [DOI] [PubMed] [Google Scholar]
- McIntire DD, Bloom SL, Casey BM, Leveno KJ. 1999. Birth weight in relation to morbidity and mortality among newborn infants. N Engl J Med 340:1234–1238. doi: [DOI] [PubMed] [Google Scholar]
- Negri E, Metruccio F, Guercio V, Tosti L, Benfenati E, Bonzi R, et al. 2017. Exposure to PFOA and PFOS and fetal growth: a critical merging of toxicological and epidemiological data. Crit Rev Toxicol 47:482–508. doi: 10.1080/10408444.2016.1271972 [DOI] [PubMed] [Google Scholar]
- NHMRC N 2011. Australian Drinking Water Guidelines Paper 6 National Water Quality Management Strategy. National Health and Medical Research Council, National Resource Management Ministerial Council, Commonwealth of Australia. doi: [Google Scholar]
- OECD. 2002. Hazard Assessment of Perfluorooctane Sulfonate (PFOS) and its salts. ENV/JM/RD(2002)17/FINAL. doi:
- Olsen GW, Burris JM, Ehresman DJ, Froehlich JW, Seacat AM, Butenhoff JL, et al. 2007. Half-life of serum elimination of perfluorooctanesulfonate,perfluorohexanesulfonate, and perfluorooctanoate in retired fluorochemical production workers. Environ Health Perspect 115:1298–1305. doi: 10.1289/ehp.10009 [DOI] [PMC free article] [PubMed] [Google Scholar]
- Palmer CNA, Hsu M, Griffin KJ, Raucy JL, Johnson EF. 1998. Peroxisome proliferator activated receptor alpha expression in human liver. Mol Pharmacol 53:14–22. doi: [PubMed] [Google Scholar]
- Rakhshandehroo M, Hooiveld G, Muller M, Kersten S. 2009. Comparative analysis of gene regulation by the transcription factor PPARalpha between mouse and human. PLoS One 4:e6796. doi: 10.1371/journal.pone.0006796 [DOI] [PMC free article] [PubMed] [Google Scholar]
- Rosen MB, Das KP, Rooney J, Abbott B, Lau C, Corton JC. 2017. PPARalpha-independent transcriptional targets of perfluoroalkyl acids revealed by transcript profiling. Toxicology 387:95–107. doi: 10.1016/j.tox.2017.05.013 [DOI] [PMC free article] [PubMed] [Google Scholar]
- Rushing BR, Hu Q, Franklin JN, McMahen R, Dagnino S, Higgins CP, et al. 2017. Evaluation of the immunomodulatory effects of 2,3,3,3-tetrafluoro-2-(heptafluoropropoxy)-propanoate in C57BL/6 mice. Toxicol Sci 156:179–189. doi: 10.1093/toxsci/kfw251 [DOI] [PMC free article] [PubMed] [Google Scholar]
- Shelley HJ. 1964. Carbohydrate reserves in the newborn infant. Brit Med J 1:273–275. doi: [DOI] [PMC free article] [PubMed] [Google Scholar]
- Strynar M, Dagnino S, McMahen R, Liang S, Lindstrom A, Andersen E, et al. 2015. Identification of Novel Perfluoroalkyl Ether Carboxylic Acids (PFECAs) and Sulfonic Acids (PFESAs) in Natural Waters Using Accurate Mass Time-of-Flight Mass Spectrometry (TOFMS). Environ Sci Technol 49:11622–11630. doi: 10.1021/acs.est.5b01215 [DOI] [PubMed] [Google Scholar]
- Sun M, Arevalo E, Strynar M, Lindstrom A, Richardson M, Kearns B, et al. 2016. Legacy and Emerging Perfluoroalkyl Substances Are Important Drinking Water Contaminants in the Cape Fear River Watershed of North Carolina. Environmental Science & Technology Letters 3:415–419. doi: 10.1021/acs.estlett.6b00398 [DOI] [Google Scholar]
- Symonds ME, Sebert SP, Hyatt MA, Budge H. 2009. Nutritional programming of the metabolic syndrome. Nature Rev Endocrinol 5:604–610. doi: [DOI] [PubMed] [Google Scholar]
- Thibodeaux JR, Hanson RG, Rogers JM, Grey BE, Barbee BD, Richards JH, et al. 2003. Exposure to perfluorooctane sulfonate during pregnancy in rat and mouse. I: maternal and prenatal evaluations. Toxicol Sci 74:369–381. doi: 10.1093/toxsci/kfg121 [DOI] [PubMed] [Google Scholar]
- USEPA-HERO. 2018. Health & Environmental Research Online: GenX (13252–13-6). Online available - Accessed July 25, 2018 https://hero.epa.gov/hero/index.cfm/project/page/project_id/2627. doi:
- USEPA. 2016a. Health Effects Support Document for Perfluorooctane Sulfonate (PFOS). EPA Publication No EPA 822-R-16-002. doi:
- USEPA. 2016b. Drinking water health advisory for perfluorooctane sulfonate (PFOS). EPA 822-R-16-004. doi:
- USEPA. 2016c. Drinking water health advisory for perfluorooctanoic acid (PFOA). EPA 822-R-16-005. doi:
- USEPA. 2018. Human health toxicity values for hexafluoropropylene oxide (HFPO) dimer acid and its ammonium salt (CASRN 13252-13-6 and CASRN 62037-89-3): Also known as “GenX Chemicals”. EPA-823-P-18-001 Public Comment Draft. doi:
- Vanden Heuvel JP, Thompson JT, Frame SR, Gillies PJ. 2006. Differential activation of nuclear receptors by perfluorinated fatty acid analogs and natural fatty acids: a comparison of human, mouse, and rat peroxisome proliferator-activated receptor-alpha, -beta, and -gamma, liver X receptor-beta, and retinoid X receptor-alpha. Toxicol Sci 92:476–489. doi: 10.1093/toxsci/kfl014 [DOI] [PubMed] [Google Scholar]
- Waites CR, Dominick MA, Sanderson TP, Schilling BE. 2007. Nonclinical safety evaluation of muraglitazar, a novel PPARalpha/gamma agonist. Toxicol Sci 100:248–258. doi: 10.1093/toxsci/kfm193 [DOI] [PubMed] [Google Scholar]
- Wang J, Wang X, Sheng N, Zhou X, Cui R, Zhang H, et al. 2017. RNA-sequencing analysis reveals the hepatotoxic mechanism of perfluoroalkyl alternatives, HFPO2 and HFPO4, following exposure in mice. J Appl Toxicol 37:436–444. doi: 10.1002/jat.3376 [DOI] [PubMed] [Google Scholar]
- Wesolowski SR, Hay WW Jr. 2016. Role of placental insufficiency and intrauterine growth restriction on the activation of fetal hepatic glucose production. Mol Cell Endocrinol 435:61–68. doi: 10.1016/j.mce.2015.12.016 [DOI] [PMC free article] [PubMed] [Google Scholar]
- Zheng F, Sheng N, Zhang H, Yan S, Zhang J, Wang J. 2017. Perfluorooctanoic acid exposure disturbs glucose metabolism in mouse liver. Toxicol Appl Pharmacol 335:41–48. doi: 10.1016/j.taap.2017.09.019 [DOI] [PubMed] [Google Scholar]
Associated Data
This section collects any data citations, data availability statements, or supplementary materials included in this article.