

Abstract
Epilepsy is a common brain network disorder associated with disrupted large‐scale excitatory and inhibitory neural interactions. Recent resting‐state fMRI evidence indicates that global signal (GS) fluctuations that have commonly been ignored are linked to neural activity. However, the mechanisms underlying the altered global pattern of fMRI spontaneous fluctuations in epilepsy remain unclear. Here, we quantified GS topography using beta weights obtained from a multiple regression model in a large group of epilepsy with different subtypes (98 focal temporal epilepsy; 116 generalized epilepsy) and healthy population (n = 151). We revealed that the nonuniformly distributed GS topography across association and sensory areas in healthy controls was significantly shifted in patients. Particularly, such shifts of GS topography disturbances were more widespread and bilaterally distributed in the midbrain, cerebellum, visual cortex, and medial and orbital cortex in generalized epilepsy, whereas in focal temporal epilepsy, these networks spread beyond the temporal areas but mainly remain lateralized. Moreover, we found that these abnormal GS topography patterns were likely to evolve over the course of a longer epilepsy disease. Our study demonstrates that epileptic processes can potentially affect global excitation/inhibition balance and shift the normal GS topological distribution. These progressive topographical GS disturbances in subcortical–cortical networks may underlie pathophysiological mechanisms of global fluctuations in human epilepsy.
Keywords: epilepsy, fluctuations, global signal, resting‐state fMRI, subcortical–cortical network
This study demonstrated spatial shifts of non‐uniform GS topography across higher‐order prefrontal cortex and sensory areas in generalized and focal epilepsy. We found that these abnormal GS topography patterns were likely to evolve over the course of a longer disease. Our findings have potential implications for understanding the neuronal mechanisms of disrupted global excitation/inhibition balance in epilepsy.

1. INTRODUCTION
The human brain contains multiple reciprocal excitatory and inhibitory interconnections on the scale of local microcircuits and global network interactions (Sporns, 2011, 2013). Resting‐state fMRI allows investigation of spatial patterns of such functional networks, which can be achieved by mapping the temporal correlation of spontaneous fluctuations among different brain regions (Fox et al., 2005; B. T. Yeo et al., 2011). These networks are functionally valuable for global neural signaling and normal information processing (van den Heuvel, Kahn, Goni, & Sporns, 2012), and may also convey abnormal signals in clinical brain disorders. Pathological states such as seizures may disrupt functional organization of certain regions or extend globally to networks because of widespread neurotransmitter abnormalities; thus, they possibly have potential effects on global signals (GS) of the brain. Determining the effects of intrinsic activity or seizure events on spontaneous global changes may be important in understanding the fundamental physiological principles of epileptic brain function.
Epilepsy has been regarded as a functional brain network disorder associated with excessive synchronization of large neuronal populations, which is characterized by sudden, unpredictable attacks of altered motor activity, sensory phenomena, inappropriate behavior, and loss of consciousness (Banerjee, Filippi, & Allen Hauser, 2009; Blumenfeld, 2012). Conventionally, epilepsy is dichotomized into two distinct types: generalized seizures and focal seizures (Fisher et al., 2017). The generalized seizures are widespread, appearing throughout the entire brain or bilaterally distributed networks. By contrast, focal seizures originate from regions limited to one hemisphere and may be discretely localized or widely distributed (A. T. Berg et al., 2010). Growing evidence points toward disrupted topological organization of the large‐scale networks underlying the core phenomena in either generalized or focal epilepsy, from seizure generation to behavioral cognitive dysfunction (Blumenfeld et al., 2004; Englot, Konrad, & Morgan, 2016; Kramer & Cash, 2012; R. Li et al., 2016; Z. Zhang et al., 2011). The pathophysiology underlying these two major subdivisions may be quite different, but they are both characterized by recurrent spontaneous seizures through common network mechanisms. Numerous animal models and human neuroimaging studies have demonstrated that seizures occur with widespread subcortical–cortical network disturbances not only in primary generalized seizures, but also in focal onset ones (Blumenfeld et al., 2009; Englot et al., 2015; Gotman, 2008; Rong Li et al., 2019). Subcortical–cortical network structures, such as the frontal and parietal association cortex, and the subcortical hippocampus and brainstem, are thought to be critical for synchronizing epileptic discharges, thereby causing abnormal behavior and impaired awareness in epilepsy (Centeno & Carmichael, 2014; Kramer & Cash, 2012). Despite considerable progress in understanding the physiological processes underlying epileptic networks, the mechanisms underlying the global pattern of fMRI spontaneous fluctuations in human epilepsy remain unknown.
The global fMRI fluctuations have been traditionally thought to reflect nonneuronal sources, such as head motion or physiological noises (J. D. Power et al., 2014), which can induce artifactual high correlations across the brain. For most fMRI studies, discarding the contributions of global fluctuations is a customary preprocessing step. However, recent emerging evidence suggests that GS fluctuations are likely of neuronal origins. Specifically, Scholvinck, Maier, Ye, Duyn, and Leopold (2010) observed a widespread correlation of GS to local field potential power sampled from a single cortical area, suggesting that the often discarded global signal of fMRI fluctuations is tightly coupled with underlying neural activity. In support of this view, a recent study also demonstrated that input from the basal forebrain regulates the global component of spontaneous activity across the brain, implying a neural mechanism through which global signal fluctuations stem from input through long‐range anatomical projection (Turchi et al., 2018). In addition, a simultaneous EEG‐fMRI study identified notable electrophysiological correlates for temporal variations in characteristics of the GS and provided a potential neuropsychological basis for GS dynamics (Xu et al., 2018). In particular, functional connectivity and spatial topography of GS have been further proven to be relevant in clinical diseases, such as schizophrenia (Yang et al., 2017), bipolar disorder (J. Zhang et al., 2018), and major depression (Murrough et al., 2016). These findings suggest that GS is not merely nonneuronal noise but also an important neuronal source of coherent brain networks. Epilepsy is ultimately a disorder of abnormal neuronal synchronization, which can be investigated at the global level of network. In this context, quantifying the spatial distribution of GS topography across the brain may provide important clues to the mechanism underlying the pathological processes in epilepsy.
In the present study, the GS topography has been characterized by computing beta weight maps from a multiple regression model instead of calculating global brain connectivity (Geha, Cecchi, Todd Constable, Abdallah, & Small, 2017; Murrough et al., 2016) or voxel‐wise correlations to the mean GS (Wang et al., 2019) as conducted in previous studies. This measurement of GS topography has shown advantages when aiming to account for contributions of GS to the entire brain signal along with other nuisance regressors (Cole, Anticevic, Repovs, & Barch, 2011; Yang et al., 2017). From a network prospective, seizures may generate and propagate through the large‐scale excitatory and inhibitory interactions. Previous studies on epileptic brain network consistently reported that specific subcortical and cortical networks including the brainstem, thalamus, hippocampus and cerebellum, as well as frontal and motor cortex are selectively involved in the genesis, spread, and termination of not only primary generalized, but also focal onset seizures (Bettus et al., 2009; Blumenfeld et al., 2009; Kramer & Cash, 2012; Kuhnert, Elger, & Lehnertz, 2010; Laufs & Duncan, 2007). Therefore, we hypothesized that whether generalized or focal epilepsy might be associated with some common GS topography alterations. In particular, the altered global distributions of neuronal activity might occur in specific subcortical–cortical structures responsible for the epilepsy's clinical manifestations and its underlying pathophysiology, such as midbrain, hippocampus temporal areas, primary sensory, and higher association cortices on the basis of existing evidence for preferential epileptic network alterations in epilepsy. We tested this hypothesis by investigating the spatial pattern of GS topography in a large sample of healthy subjects and two most common epilepsy subtypes: idiopathic generalized epilepsy (IGE) with generalized tonic–clonic seizures (GTCS) and focal onset temporal lobe epilepsy (TLE). Given that the causative factors and pathophysiological mechanisms underlying these two major seizures may be quite different, we predicted that patients with IGE‐GTCS and TLE would also show some specific GS topography changes across brain networks.
2. MATERIALS AND METHODS
2.1. Participants
The epilepsy patients in the current study were consecutively enrolled from Jinling Hospital in Nanjing, China. All patients underwent a comprehensive clinical evaluation according to the epilepsy classifications of the International League Against Epilepsy (ILAE) (Berg et al., 2010) based on comprehensive evaluation, including seizure history and semiology, neurological examination, diagnostic MRI, and electroencephalogram (EEG) records. A subset of these patients had participated in our earlier studies (R. Li et al., 2016; Liu et al., 2017; Z. Zhang et al., 2011; Z. Zhang et al., 2017). Patients with IGE were all diagnosed with only GTCS, and the inclusion criteria include (1) presence of typical clinical symptoms of GTCS, including tic of limbs followed by a clonic phase of rhythmic jerking of the extremities, loss of consciousness during seizures, and no absence of partial seizures; (2) presence of generalized spike‐and‐wave or poly‐spike‐wave discharges in their interictal scalp video EEG; (3) no evidence of a cause of secondary GTCS such as trauma, tumor, or intracranial infection; (4) no focal abnormality in the structural MRI; and (5) no obvious history of etiology. The exclusion criteria were as follows: (1) history of self‐reported neurologic or psychiatric disease other than epilepsy and (2) history of partial seizures. Patients with clinically and video‐EEG defined MRI‐negative TLE but with no evidence of hippocampal sclerosis (HS) or potential epileptogenic structural abnormality were recruited. TLE patients were included if they (1) epileptic discharge originated from the temporal lobe based on EEG findings; (2) recurrent unprovoked simple‐partial or complex‐partial seizures occurring with or without secondary generalization; (3) with one or more typical symptoms of TLE such as rising epigastric sensations, automatisms, dystonic posturing of the limbs, affective phenomena, and altered consciousness (not every case). Exclusion criterion were the following: (1) an MRI‐visible lesion or multifocal seizure onset and (2) history of self‐reported neurologic or psychiatric disease other than epilepsy. Finally, 127 patients with IGE‐GTCS and 114 with TLE were included in this study. In IGE‐GTCS group, 49 patients took antiepileptic drugs (AEDs), 22 patients were drug‐naïve; in TLE group, 69 patients were under treatment, and 5 were drug‐naïve, and other patients had incomplete or unavailable clinical information. Details of AEDs for IGE‐GTCS and for TLE are provided in Tables S1 and S2, respectively.
In addition, a group of 161 age‐ and gender‐matched healthy controls were recruited. Healthy controls were interviewed to confirm the absence of a history of neurological disorder or psychiatric illness and absence of gross abnormalities in brain MRI images. Written informed consent were obtained from the patient and control groups with a research protocol approved by the local Medical Ethics Committee at Jinling Hospital and Clinical School of Medical College at Nanjing University.
2.2. Data acquisition
All experiments were performed with a clinical 3T whole‐body MR imager (TIM Trio, Siemens Medical Solutions, Erlangen, Germany) by using a standard birdcage head transmit‐and‐receive coil. Data were acquired during the interictal periods. Foam padding was used to minimize head motion for all subjects. The subjects were instructed to rest with their eyes closed, not think of anything in particular, and not fall asleep. Functional images were acquired by using a single‐shot, gradient‐recalled echo‐planar imaging sequence (repetition time ms/echo time ms, 2,000/30; flip angle, 90°). Images of 30 transverse sections (field of view, 240 × 240 mm2; in‐plane matrix, 64 × 64; section thickness, 4 mm; intersection gap, 0.4 mm; and voxel size, 3.75 × 3.75 × 4 mm3) aligned along the anterior posterior commissure line were acquired. For each subject, a total of 250 volumes were acquired, resulting in an imaging time of 500 s. The high‐spatial‐resolution 3D T1‐weighted anatomic images were acquired with a fast spoiled gradient‐echo sequence (FSPGR): repetition time ms/echo time ms, 2,300/2.98; flip angle, 9°; field of view, 256 × 256 mm2; matrix size, 256 × 256; section thickness, 1 mm, without intersection gap; and voxel size, 0.5 × 0.5 × 1 mm3 and 176 sections. At the end, all participants were asked if they had fallen asleep during the scanning.
2.3. Preprocessing
Functional data preprocessing was performed using Data Processing Assistant for Resting‐State fMRI software (DPARSF Advanced Edition, v4.3; http://www.restfmri.net/forum/). The initial 10 functional images of each subject were discarded for magnetic saturation. Subsequently, we conducted slice timing and alignment correction for the remaining 240 frames. The transient movement during the scanning was required to be no more than 3 mm of translation and 3° of rotation. Images were then spatially normalized to the Montreal Neurological Institute (MNI) template at a resolution of 3 × 3 × 3 mm3. Based on the potential confounding effects of movement‐induced artifactual fluctuations (J. D. Power, Barnes, Snyder, Schlaggar, & Petersen, 2012), instantaneous changes in head position or framewise displacement (FD) were calculated as the sum of the absolute values of changes in the six parameters for transitional and rotational displacement between frames (J. Power et al., 2012). Image frames with possible movement effect fluctuations were identified via two criteria. First, frames with FD > 0.5 mm along with the preceding one and the latter two frames were labeled as high‐motion frames. Participants with over 20% high‐motion frames were excluded. Second, subjects with the mean FD bigger than 0.5 mm were excluded from the analyses. Then, linear detrend and temporal band‐pass filter (0.01–0.08 Hz) was conducted to reduce the effects of low‐frequency drifts and high‐frequency physiological noise. Finally, multiple linear regression was performed to model the BOLD signal for each voxel, including 24 head motion parameters, cerebrospinal fluid (CSF), and white matter signals as regressors. Additional artifact removal was performed prior to further data analysis. Signal to noise ratio (SNR) was calculated over time for each voxel [20 × log (mean BOLD signal/standard deviation of the BOLD signal)] and then averaged over the whole brain. An arbitrary cut‐off of 30 dB was set for exclusion as previous study did (Killory et al., 2011). The resulting fMRI data were prepared for further processing.
2.4. GS beta weight maps calculation
We aimed to examine the spatial pattern of GS topography for healthy controls and epilepsy patients. Instead of calculating global brain connectivity or voxel‐wise correlations to the mean GS as many previous studies had done (Geha et al., 2017; Murrough et al., 2016; Wang et al., 2019), we characterized the GS topography by computing beta weight maps using a multiple regression model. This measure of GS topography has the advantage of specifically accounting for contributions of GS at a voxel level along with weights of multiple regressors such as white matter and CSF signals (results obtained by computing global brain connectivity are also shown in Figure S1 for comparison). Here, we performed a GS regression model analysis using standard widely used procedures as previous studies had suggested (Cole et al., 2011; Cole, Pathak, & Schneider, 2010; Yang et al., 2017). First, the GS time series for each participant was obtained by calculating mean BOLD signals averaged over all gray matter voxels by explicitly removing signals of CSF and white matter. Then, this obtained GS time series was used as a predictor term of interest within a multiple linear regression model along with other nuisance predictor terms (CSF signal, white matter signal, and 24 head movement parameters). Finally, we calculated the multiple regression with a single GS‐related variable to yield voxel‐wise GS beta weight values. The multiple regression model was defined as (Yang et al., 2017):
where denotes the raw BOLD signal of voxel k as a function of time t, b0 is the intercept that contains the trend parameters of the scan, Xi represents various covariates that need to be regressed (e.g., white matter or CSF signal), and bi is the corresponding beta weight value for the regressor Xi. After regressing all the regressors, we obtained the residual as the preprocessed BOLD signal at voxel k. Notably, the regressors include CSF signal, white matter signal, global signal, and 24 movement parameters. The GS beta weight was obtained by computing the bGS values from the multiple regression model. GS(t) is calculated as the average of the BOLD signal across all gray matter voxels:
2.5. Spatial distribution of GS topography in healthy controls
We first quantified the GS weight beta maps across all gray matter voxels in healthy subjects to obtain the spatial topographical distribution of GS, thereby producing a group‐level T‐map of voxel‐wise with GS beta values (one‐sample t‐test, p < .05, FDR corrected). We further extracted the mean beta weight using a prior seven resting‐state functional networks parcellation (B. T. Yeo et al., 2011) to verify the nonuniform spatial distribution of GS topography as previous study suggested (Yang et al., 2017). The higher‐order association networks include the dorsal attention (DAN), ventral attention (VAN), frontoparietal control (FPN), default mode (DMN) and limbic networks (LN), and primary sensory‐motor networks include the somatomotor (SMN), and visual networks (VN). It is worth to note that although the limbic network (LN) is not a classic high‐order network, because of its widespread connections with prefrontal and parietal areas we divided it into association networks to cover the whole cerebral cortex. Mean beta weight values between the higher‐order association networks and primary sensory‐motor networks were compared using paired two‐sample t‐test, with significance level of p < .05.
2.6. Altered GS topography in patients with IGE‐GTCS and TLE
Subsequently, to identify the group differences for topographical distribution of GS among epilepsy patients and healthy controls, we first performed one‐way analysis of variance (ANOVA) on the GS beta weight maps at voxel level among HC (n = 151), IGE‐GTCS (n = 116) and TLE (n = 98). The resulting statistical map was Gaussian random field (GRF) theory corrected for cluster‐level multiple comparisons (cluster significance p < .05 and voxel significance p < .01 with z scores greater than 2.33). Brain regions showing significant differences based on the results of one‐way ANOVA were defined as regions of interest (ROI) for further posthoc analysis using the Bonferroni correction. Six ROIs (bilateral posterior cerebellum, bilateral orbital frontal cortex, left middle temporal gyrus, subcortical midbrain tegmentum extending to adjacent parahippocampus/hippocampus) were created by saving the brain clusters that survived GRF cluster‐level multiple comparisons. The significance level was set as p < .05 divided by the number of ROIs and the total number of comparisons (p < .05/(6 × 3) = 0.003). In order to further assess the common GS topography alteration in the two major types of epilepsy, we conducted a two‐sample t‐test by comparing the GS beta weights between pooled IGE and TLE patients (n = 214) and HC (n = 151). In addition, to investigate the specific alterations in GS topography in different subtypes of epilepsy, we conducted two‐sample t‐tests directly comparing patients with IGE‐GTCS and TLE versus HC, respectively. Because both left (n = 59) and right (n = 39) TLE patients were included, we assessed the influence of seizure lateralization on GS topography by separately comparing GS beta weights with controls. Finally, to address the GS changes in specific networks in patients we also performed group comparisons of mean GS beta weights in each resting‐state functional network between TLE/IGE and controls. GRF theory were used for correction of cluster‐level multiple comparisons for above analyses (cluster significance p < .05 and voxel significance p < .01 with z scores greater than 2.33).
2.7. Clinical relevance of GS topography in patients
To explore the potential clinical relevance of GS topography alterations, we investigated the relationships between topographical GS changes in patients and clinical features. Pearson's correlation analysis was utilized to assess correlations between the GS beta weights and duration of epilepsy. We created ROIs by intersecting corrected brain clusters showing significantly GS topography differences in one‐way ANOVA group comparisons (p < .05, GRF corrected). In addition, previous GS studies have related clinical neuropsychological function with GS imaging findings (Murrough et al., 2016; J. Zhang et al., 2018), here we repeated GS topography analysis in an independent clinical sample of TLE patients which underwent neuropsychological evaluation of intelligence (IQ). This test sample includes 51 healthy controls (mean age = 30.67 ± 9.01, 19 female and 32 male) and 30 patients with TLE (mean age = 28.50 ± 10.10, 16 female and 14 male). The detailed demographic and clinical characteristics of this test sample are summarized in Table S3. General IQ including verbal IQ (91.73 ± 13.93), performance IQ (94.07 ± 15.97), and full‐scale IQ (92.63 ± 14.31) was assessed in TLE patients using the Chinese version of the Wechsler Intelligence Scale. The potential clinical neuropsychological relevance of GS topography alterations was examined in this test sample. Statistical threshold of p < .05 was considered significant for the correlation analyses.
2.8. Verification and confounding control analyses
There were several confounding factors when comparing GS topography between healthy controls and epilepsy patients. First, to ensure our results are robust to the preprocessing strategies, we adopted a component based noise correction method (CompCor) (Behzadi, Restom, Liau, & Liu, 2007; BT Thomas Yeo, Tandi, & Chee, 2015) instead of white matter and CSF regression. Briefly, the top five principal components were derived from the white matter and CSF signals and then included as nuisance parameters within multiple linear regression models. The group differences for GS topography among epilepsy patients and healthy controls were investigated. Second, given that there were significant differences of mean FD between TLE/IGE‐GTCS and controls, we further conducted a Pearson's correlation between GS beta weights and mean FD values of patients to verify the possible influence of head motion on GS findings. The mean GS beta weights of the brain regions showing significant group differences were correlated with the mean FD values of TLE and IGE‐GTCS patients, respectively. Third, considering there is slight difference between disease duration of TLE and IGE‐GTCS groups (p = .02), additional analyses were performed to control for duration effect. Two‐sample t‐tests were implemented by directly comparing GS beta weights between patients with IGE‐GTCS and TLE without and with the duration as covariant, respectively. Finally, to clarify whether AEDs taken by some patients would have an influence on the observed GS weights difference between patients and controls, we conducted a ROI‐wise Bonferroni correction posthoc analysis in a subset of patients who were drug‐naïve and under AEDs treatment. Specifically, brain regions showing significant GS group difference between patients with IGE‐GTCS and healthy controls were defined as ROIs (as shown in Figure 3). Posthoc analyses were performed on each of the ROIs across healthy controls (n = 151), IGE‐treatment patient group (n = 49), and IGE‐naïve patient group (n = 22). The three groups did not differ significantly in terms of age and gender distributions (p > .05), whereas the IGE‐treatment patient group had a longer epilepsy duration than the IGE‐naïve patient group (p = .001). Given the relatively small sample size of drug‐naïve TLE patients (n = 5), we did not analyze the AEDs effect in TLE group.
3. RESULTS
3.1. Demographics and clinical characteristics
A total of 402 subjects (161 healthy controls, 114 TLE, 127 IGE‐GTCS) completed all MRI procedures. Two IGE‐GTCS patients and one healthy control had to be excluded for translational or rotational head motion. Sixteen TLE and nine IGE‐GTCS patients and nine healthy controls with more than 20% high‐motion frames or a large mean FD > 0.5 mm were discarded. Because all of the fMRI runs of the patients and healthy controls exceeded the SNR threshold of 30 dB, no subject was deleted in this step. Finally yielded a final sample of 151 healthy controls, 98 TLE, and 116 IGE‐GTCS patients in the current study. Of TLE patients, 59 patients arose from the left side and 39 patients arose from the right side. The three groups did not differ significantly in terms of age and gender distributions (all p > .05). A weak significant difference was observed between TLE and IGE‐GTCS on duration of disease (p = .02). There were significant group differences of mean D values between TLE (0.19 ± 0.07), IGE‐GTCS (0.19 ± 0.08), and HC (0.15 ± 0.07), in which TLE and IGE‐GTCS both showed greater head movements than controls (all p < .001). The demographic and clinical characteristics of all participants are summarized in Table 1.
TABLE 1.
Demographic and clinical characteristics of all participants
| Characteristics | HC (n = 151) | TLE (n = 98) | IGE‐GTCS (n = 116) | p value |
|---|---|---|---|---|
| Age (years) | 24.77 ± 5.68 | 26.74 ± 8.89 | 24.93 ± 7.81 | .09 a |
| Gender (female:male) | 72:79 | 43:55 | 43:73 | .22 b |
| Duration (months) | — | 109.40 ± 87.76 | 79.21 ± 94.25 | .02 c |
| Onset age (years) | — | 17.64 ± 9.53 | 18.33 ± 8.74 | .58 c |
| Treatment | __ | 69/5 d | 49/22 d | __ |
Note: Values are presented as mean ± SD.
One‐way analysis of variance (ANOVA).
Kruskal–Wallis ANOVA.
Two‐sample t‐test.
Missed clinical information.
Abbreviations: HC, healthy controls; TLE, temporal lobe epilepsy; IGE–GTCS, idiopathic generalized epilepsy with generalized tonic–clonic seizure.
3.2. Nonuniformly distributed GS beta weights in healthy controls
We quantified the beta coefficients across all gray matter voxels in 151 healthy controls, producing a group‐level T‐map of voxel‐wise GS beta weights (p < .05, FDR corrected and an extent threshold of 10 contiguous voxels, Figure 1). The resulting statistical maps demonstrated that the GS topography is nonuniformly distributed across brain networks. Specifically, the paired two‐sample t‐test showed that the spatial distribution of the averaged GS beta weights was higher in the primary sensory‐motor networks and lower in the higher‐order association networks. These results replicated the finding from the previous study that initially observed a strong difference in GS representations across association versus sensory networks (Yang et al., 2017).
FIGURE 1.

Spatial distribution maps of GS beta weights in healthy controls. (a) Surface and (b) volume‐based visualization of voxel‐wise whole‐brain GS beta coefficient values in healthy controls. (c) Resting‐state functional networks were obtained by obtained from Yeo et al., 2011 to verify the spatial distribution of beta weights across association networks including the dorsal attention (DAN), ventral attention (VAN), frontoparietal control (FPN), default mode (DMN), and limbic networks (LN), and primary sensory‐motor networks including the somatomotor (SMN) and visual networks (VN). (d) Paired two‐sample t‐test was performed to compare the mean beta weights between association and sensory‐motor networks. Results showed a nonuniform spatial distribution of GS beta weights across the brain, whereby the averaged GS beta weights was maximal in the primary sensory‐motor networks including the visual, temporal, and motor cortices, and minimal in the higher‐order association networks including the frontoparietal and temporal–parietal junction. Maps were obtained by FDR‐corrected one‐sample t‐test with p < .05 and an extent threshold of 10 contiguous voxels. ***p < .0001
3.3. Shared GS topography distribution in IGE‐GTCS and TLE
Our main goal in the current study was to investigate the potential topographical disturbances of GS in epilepsy patients. First, one‐way ANOVA revealed significant group differences in the bilateral posterior cerebellum, bilateral orbital frontal cortex, left middle temporal gyrus, and subcortical midbrain tegmentum (including midbrain and pons) and adjacent parahippocampus/hippocampus, using GRF theory correction of cluster‐level multiple comparisons (Figure 2a, p <.05, see Table 2 for statistical survived region information). Post hoc analyses were performed on the ROIs encompassing each of these regions (Figure 2b, p <.05, Bonferroni correction). Compared with HC, the IGE‐GTCS group exhibited significantly increased GS beta weights in the bilateral orbital frontal cortex and decreased GS beta weights in the bilateral cerebellum and midbrain, the TLE group only showed significant higher GS beta weights in the right orbital frontal cortex and lower GS values in the left middle temporal gyrus and midbrain. Given that we hypothesized whether generalized or focal epilepsy might be associated with some common GS topography alterations, we subsequently conducted the comparison between pooled IGE‐GTCS and TLE patients and healthy subjects. Consistent with our hypothesis, this yielded significant common decreased GS distribution in the midbrain tegmentum and adjacent parahippocampus/hippocampus, while increased GS distribution in the right orbital frontal cortex (Figures 2c,d, GRF corrected, cluster significance p < .05 and voxel significance p < .01).
FIGURE 2.

Group differences of GS beta weights among TLE, IGE‐GTCS, and HC. (a) Brain regions with significant group differences in GS beta weights revealed by one‐way ANOVA. Significant differences were observed in the bilateral cerebellum, upper midbrain tegmentum, left middle temporal gyrus, and bilateral orbital frontal cortex. (b) Bar graph showing one‐way ANOVA ROI‐wise posthoc analysis results. (c) Two‐sample t‐test was performed to determine the common GS disturbances in epilepsy by comparing pooled IGE+ TLE (n = 214) and HC (n = 151). We found significant decreased GS beta weights in the brain clusters of the midbrain tegmentum and adjacent parahippocampus/hippocampus, and increased GS beta weights in the right orbital frontal cortex. (d) Mean GS beta weight values for areas defined in (c). Results were corrected for multiple comparisons using GRF theory with cluster significance p < .05 and voxel significance p < .01. **p < .05, Bonferroni corrected. HC, healthy controls; IGE‐GTCS, idiopathic generalized epilepsy with generalized tonic–clonic seizures; TLE, temporal lobe epilepsy
TABLE 2.
Brain regions that showed significant differences in GS beta weights among three groups
| Brain regions | MNI coordinates | Peak F value | Number of voxels | ||
|---|---|---|---|---|---|
| X | Y | Z | |||
| Left posterior cerebellum | −36 | −57 | −30 | 14.29 | 682 |
| Right posterior cerebellum | 33 | −54 | −48 | 9.01 | 262 |
| Left orbital frontal cortex | −45 | 48 | −15 | 9.65 | 158 |
| Right orbital frontal cortex | 30 | 60 | −6 | 11.72 | 216 |
| Midbrain tegmentum | 9 | −30 | −15 | 10.26 | 164 |
| Left middle temporal gyrus | −57 | −51 | 3 | 9.92 | 124 |
Note: One‐way ANOVA revealed significant differences in GS beta weights among TLE, IGE‐GTCS and HC. All clusters were Gaussian random field (GRF) theory corrected for cluster‐level multiple comparisons (cluster significance p < .05 and voxel significance p < .01 with z scores greater than 2.33). Cluster size is reported in number of voxels and stereotaxic coordinates are reported in the Montreal Neurological Institute (MNI) standard space.
Abbreviations: HC, healthy controls; IGE‐GTCS, idiopathic generalized epilepsy with generalized tonic–clonic seizures; TLE, temporal lobe epilepsy.
3.4. Distinct GS topography distribution in IGE‐GTCS and TLE
To detect the specific alterations in GS topography in the various types of epilepsy, we conducted two‐sample t‐tests comparing IGE‐GTCS and TLE with HC, respectively. Compared to HC, IGE‐GTCS exhibited significantly increased GS beta weights in the bilateral orbital and medial frontal cortex, and decreased GS beta weights in the bilateral calcarine gyrus, posterior cerebellum, and midbrain tegmentum in conjunction with parahippocampus/hippocampus (Figure 3, GRF corrected, cluster significance p < .05 and voxel significance p < .01). The TLE group showed significantly increased GS beta weights in the right orbital frontal cortex, and decreased GS beta weights in the left middle temporal gyrus (Figure 4, GRF corrected, cluster significance p < .05 and voxel significance p < .01). We next examined the influence of seizure lateralization on GS topography. Compared to controls, left TLE patients showed significant reduction of GS contribution in the ipsilateral cerebellum, hippocampus (including the parahippocampus and midbrain), middle and superior temporal gyrus, while increased GS contribution in the contralateral orbital frontal cortex. Right TLE patients showed prominent decreased GS contribution in the ipsilateral hippocampus and middle temporal gyrus, as well as slight reduction in the contralateral middle temporal gyrus, while increased GS contribution in the bilateral orbital and middle frontal cortex (Figure S2). These results indicated the GS topography alterations are mainly located in the ipsilateral limbic temporal areas extending to midline structure (midbrain), and contralateral frontal cortex. Finally, by comparing the GS beta weights of each functional network between TLE/IGE patients and controls we found no significant changes (all p > .05).
FIGURE 3.
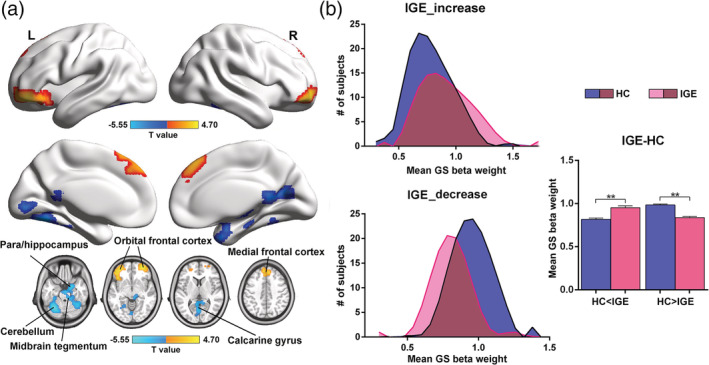
Altered spatial distribution of GS beta weights in IGE‐GTCS. (a) Voxel‐wise surface and volume‐based T‐map comparing GS beta values between IGE‐GTCS and HC. Compared with HC, IGE‐GTCS showed increased GS beta weights (warm colors) in the bilateral orbital frontal cortex and medial frontal cortex, and decreased GS beta weights (cool colors) in the left cerebellum, right cerebellum extending to midbrain tegmentum and adjacent parahippocampus/hippocampus, and calcarine gyrus. Results were corrected for multiple comparisons using GRF theory with cluster significance p <.05 and voxel significance p < .01. (b) Voxels of significantly increased and decreased GS beta weights were defined in IGE‐GTCS as “HC < IGE” and “HC > IGE.” We present the group distributions and mean GS beta weight values for areas defined in (a). **p < .05, Bonferroni correction. HC, healthy controls; IGE‐GTCS, idiopathic generalized epilepsy with generalized tonic–clonic seizures
FIGURE 4.

Altered spatial distribution of GS beta weights in TLE. (a) Voxel‐wise surface and volume‐based T‐map comparing GS beta values between TLE and HC. Compared with HC, TLE showed increased GS beta weights (warm colors) in the right orbital frontal cortex, and decreased GS beta weights (cool colors) in the left parahippocampus/hippocampus, middle temporal gyrus, and midbrain tegmentum. Results were corrected for multiple comparisons using GRF theory with cluster significance p < .05 and voxel significance p < .01. (b) Voxels of significantly increased and decreased GS beta weights were defined in TLE as the “HC < TLE” and “HC > TLE” .We present the group distributions and mean GS beta weight values for areas defined in (a). **p < .05, Bonferroni correction. HC, healthy controls; TLE, temporal lobe epilepsy
3.5. Correlations between the GS topography distribution and epilepsy duration
Secondary correlation analyses showed that the decreased GS beta weights in the bilateral posterior cerebellum and midbrain in IGE‐GTCS was negatively correlated with duration of disease (Figure 5a–c, p < .05). Additionally, we observed inverse correlations between duration of disease and GS beta weights in the left MTG and midbrain in the TLE group (Figure 5d,e, p < .05). Additionally, we found very similar pattern of GS topography changes in the test sample of TLE patients (see Figure S3), however, we failed to identify any significant correlation between the IQ scores and GS beta weights (all p > .05). There are several possible reasons for these observations. One possibility is that the GS topography changes in epilepsy patients may be more related to clinical features of epilepsy rather than the cognitive functions. Another possibility is that IQ may not provide a complete assessment of neuropsychological function of TLE giving memory is the most frequently reported problem in TLE (Lespinet, Bresson, N'Kaoua, Rougier, & Claverie, 2002).
FIGURE 5.

Correlations between decreased GS beta weights and epilepsy duration. (a–c) Significant negative relationships between epilepsy duration and GS beta weights in left cerebellum, right cerebellum, and midbrain in IGE‐GTCS group. (d–e) Correlations between epilepsy duration and GS beta weights in the left middle temporal gyrus and midbrain in TLE group. Significance p < .05, uncorrected; p* < .05, FDR corrected. IGE‐GTCS, idiopathic generalized epilepsy with generalized tonic–clonic seizures; TLE, temporal lobe epilepsy
3.6. Verification and confounding control analyses
First, the analysis of GS topography disturbances with different preprocessing strategy (Figures S4–S6) repeated the main findings (Figures 2, 3, 4). Statistical analyses revealed that the CompCor and white matter and cerebrospinal fluid signals regression (the original preprocessing pipeline) yielded similar pattern of GS topography changes among IGE‐GTCS and TLE patients and healthy controls, which suggests that our results are robust to preprocessing strategies. Second, we did not identify any significant correlation between the mean FD scores and GS beta weights in regions that showing GS changes (all p > .05, Figure S7), suggesting that at least in our data, the greater head motion was unlikely to have a significant effect on our GS findings. In addition, group comparison between IGE‐GTCS and TLE revealed that IGE‐GTCS showed significant increased GS beta weights in the left orbital frontal cortex and decreased GS beta weights in the right cerebellum (see Figure S8a). Disease duration regression did not change the pattern of GS differences (Figure S8b), which supports that the GS topography differences between IGE‐GTCS and TLE are largely an indication of different pathophysiological mechanisms rather than the different disease duration. Finally, The AEDs analysis revealed that group significance of GS beta weights in the left cerebellum, right cerebellum in conjunction with midbrain and adjacent parahippocampus/hippocampus, calcarine gyrus, as well as the left orbital frontal cortex persisted in the drug‐naïve condition (see Figure S9). We therefore conclude that the medication did not have a significant effect on our main findings. While for the right orbital and medial frontal cortex, we did not found significant group difference between healthy controls and IGE‐naïve patient group. One possibility is that the sample size of IGE‐naïve patient group is too small (n = 22) to survive the statistical analysis, as IGE‐naïve patient group showed a similar tendency compared to IGE‐treatment group. It also could be a consequence of AEDs effect as previous fMRI studies have shown that AEDs such as topiramate and valproic acid could induce specific changes in the prefrontal cortex (Jansen et al., 2006; X. Li et al., 2011).
4. DISCUSSION
The present study demonstrates a specific nonuniform GS topography pattern across association and sensory‐motor networks by quantifying the resting‐state GS topography weight betas in a large sample of healthy subjects and epilepsy patient. Furthermore, this spatial pattern was found to be significantly shifted in epilepsy patients, whereby patients showed decreased GS contribution in the sensory areas including visual cortex, middle temporal gyrus, as well as cerebellum, and subcortical structures of the midbrain tegmentum associated with the hippocampus/parahippocampus, conversely increased GS representation in the higher‐order orbital and medial frontal cortex. Interestingly, the GS topography disturbances of subcortical–cortical networks were found to be more widespread and bilaterally distributed in IGE‐GTCS, whereas in TLE, they are spread beyond the temporal lobe but remain lateralized. Finally, we demonstrated that these abnormal GS topography patterns were related specifically to a longer epilepsy duration, suggesting GS topography changes likely develop and reorganize over time with the course of the disease. Our findings highlighted the GS topography disturbances in the subcortical–cortical networks in epilepsy, which may have potential implications for understanding the pathophysiological mechanisms of global excitation/inhibition imbalance of seizure‐related neural fluctuations.
Previous evidence has emphasized functional organization of large‐scale excitatory and inhibitory interactions involved in epileptic network but do not address the potential GS topography disturbances in epilepsy patients. This study provides a novel insight into findings implicating abnormal global synchronous changes across widespread neural areas. Substantial evidence suggests that the gray matter signals of neural systems subserving higher‐order association and cognitive processes are more temporally variable than those engaged in primary sensory and motor processing (Mueller et al., 2013; Van Essen & Dierker, 2007; Yang et al., 2016). Thus, the variable signals of association networks statistically tend to weaken with averaging, thereby producing a lower contribution to the GS, whereas the relatively stable sensory processing may contribute to higher levels of correlated activity throughout sensory networks and lead to a stronger GS contribution. A recent simultaneous EEG‐fMRI study showed that the functional dynamics of specific regions such as the majority of the visual and sensorimotor cortices were more sensitive to the GS regression, providing evidence for the spatially heterogeneous distribution of GS effects and potential neural sources and functional relevance of the GS (Xu et al., 2018). Consistent with previous GS findings (Han et al., 2019; Wang et al., 2019), our results demonstrate the nonuniform GS topography contributions of the association and sensory‐motor networks in healthy subjects. Furthermore, we found that this nonuniformly spatial distributed GS coupling pattern significantly shifted in both patients with focal and generalized epilepsy, with the primary sensory (visual and temporal cortex, cerebellum) and subcortical structures showing a reduced GS contribution, while the higher‐order orbital and medial frontal cortex showing an increased contribution to the GS.
Numerous clinical and neuroimaging studies have indicated the disrupted balance of cortical excitatory and inhibitory influences underlying focal and generalized epilepsy (Badawy, Curatolo, Newton, Berkovic, & Macdonell, 2007; Spencer, 2002). These findings could reflect neural activity and connectivity changes in a number of brain networks involved in epileptogenic, frontoparietal association cortices, and sensory‐motor processing areas (Blumenfeld, 2003; Englot et al., 2015; R. Li et al., 2016; Spencer, 2002). Supporting this view, our findings confirmed that epileptic processes might potentially affect global excitation/inhibition balance and shift the heterogeneous distribution of the GS weights, manifesting as decreased GS contributions in primary visual, temporal, cerebellar regions, and increased GS contributions in frontal areas. More importantly, this abnormal regional GS topography was found to be related to longer epilepsy illness duration. In particular, we identified significant negative relationships between IGE epilepsy duration and decreased GS weights of the bilateral cerebellum and midbrain tegmentum. Similarly, the decreased GS contributions of the left temporal lobe cortex and midbrain tegmentum in TLE was negatively correlated with a longer duration of illness. These progressive topographical GS disturbances in generalized and focal epilepsy patients suggest that the GS topography changes likely develop and reorganize over time with the course of the disease. It is interesting that we did not find significant GS changes in resting‐state functional network by using prior parcellation maps of the cerebral cortex (B. T. Yeo et al., 2011). It is likely that the GS topography alterations maybe confined to the local brain regions, and are not significantly at the functional network level. One possible reason is that Yeo et al. parcellation only includes cortical regions, which may made it difficult to capture the GS changes in subcortical network. Moreover, the severity of illness and cognitive decline in epilepsy patients may be related to the overall GS changes in cortical functional networks, our current study did not assess the cognitive functions for patients, so could not totally address the possible GS changes in specific functional networks. Nevertheless, the possible GS changes in relation to functional networks should be investigated further in future work.
In addition to altered GS topography in the cortical regions, significantly decreased GS beta values were also observed in the subcortical brainstem tegmentum in both IGE‐GTCS and TLE patients. It has been assumed that the entire cortex may receive neurochemical input from subcortical structures, such as ascending reticular activating system (ARAS) and basal forebrain, leading to widespread brain responses via local neurovascular coupling (Scholvinck et al., 2010; Turchi et al., 2018). This decrease in GS weights in subcortical regions including the midbrain and limbic parahippocampus/hippocampus might reflect a disruption of normal neural information flow of the brain induced by the epileptic processes. In addition, much previous work supports an important role for the brainstem, an important region of ARAS, in propagating seizure activity and producing impaired consciousness in human epilepsy (Blumenfeld et al., 2009; Englot et al., 2017; Rong Li et al., 2019; Motelow et al., 2015; Norden & Blumenfeld, 2002). Generally, loss of consciousness is thought to occur in generalized seizures because of direct involvement of a pathological pattern of synchronous neuronal discharges in extensive networks. However, focal seizures can also be associated with impaired or lost consciousness due to the spread of epileptic activity to the midline subcortical structures through long‐range network interactions (Blumenfeld, 2014). Thus, the decreased GS coupling in the subcortical structures in these two different seizure subtypes suggests that they may share common subcortical network substrates for seizure propagation and abnormal behavioral manifestations such as loss of consciousness. It is possible that recurrent generalized or focal seizures arising from cortical regions would disrupt the midline subcortical arousal systems, disrupting their normal activating function and diminish their coupling with global fluctuations. It is worth to note that not every case with TLE would have impaired consciousness during seizures. Simple‐partial seizures terminate without impaired consciousness, whereas complex‐partial seizures progress to impaired consciousness (Anne T. Berg et al., 2010). Given that TLE patients only with simple‐partial seizures in clinics were rare, and some patients with partial epilepsy might experience secondary generalization, we did not divide TLE patients into subgroups in the current study. Therefore, these results must be considered preliminary, particularly with regard to the subcortical GS topography mechanisms underlying consciousness in TLE patients, until they are replicated with more homogeneous groups.
We also identified distinct GS topography changes in these two epilepsy types in addition to the shared GS disturbances. Specifically, the IGE‐GTCS group showed significantly decreased GS weight specifically in the bilateral lateral cerebellum, whereas this effect was not found in TLE. The cerebellum is known to contain somatotopic functions that may explain the complex tonic motor manifestations during generalized seizures. Prior studies using SPECT has shown increased cerebellar activity during and following tonic–clonic seizures (Blumenfeld et al., 2009; Kros et al., 2015). In addition, Purkinje cells of the cerebellum can send inhibitory outputs to influence subcortical–cortical circuits (Mittmann, Koch, & Häusser, 2005); increased cerebellar activity was postulated to aid in preventing seizure propagation in the postictal period. In this context, the decreased GS contribution of the bilateral cerebellum in the IGE‐GTCS group suggests that the cerebellum is likely to show more variable activity during the occurrence of seizures, which may support the potential importance of the cerebellum in suppressing generalized seizures. In addition, the GS topography disturbances were found to be engaged bilaterally in IGE‐GTCS, whereas in TLE they spread to midbrain and frontal cortex beyond the temporal lobe structures but mainly remained lateralized. These distinct distribution of GS alterations were in accordance with the contention that generalized seizures often bilaterally and synchronously involve the two hemispheres while focal seizures originate within networks confined to a single cerebral hemisphere and may be discretely localized or more widely distributed. Although we observed GS alterations in the contralateral temporal and frontal areas in right TLE patients, this could be due to the effects of AEDs or the heterogeneity of this study, as some TLE patients with partial seizures might experience secondary generalization and disrupted contralateral regions. Nevertheless, our findings provide evidence for different pathophysiological mechanisms related to the global excitation/inhibition imbalance underlie focal and generalized epilepsy.
Interestingly, we found that IGE‐GTCS and TLE patients exhibited significantly increased topographical GS contributions in the orbital and medial frontal cortex. Although the majority of fMRI studies report decreases of functional organization within the epileptogenic network, increased activity or connectivity have been reported in areas outside the epileptogenic regions (Bai et al., 2011; Luo et al., 2012; Mankinen et al., 2011), which may suggest a compensatory mechanism. A previous study has provided relevant insights into the compensatory changes in TLE, which demonstrated an increase in functional connectivity of the hippocampus contralateral to epilepsy (Bettus et al., 2009). The current finding of increased GS contributions from the orbital and medial frontal areas in epilepsy patients may also serve as an adaptive mechanism that a reasonable level of abnormality may be required for frontal regions to support function retrieval in a compensatory manner.
The current study is limited in several ways but lays the groundwork for additional important future investigations. First, previous studies have shown that the changes in global fluctuations might be related to shifts in vigilance and arousal (Chang et al., 2016; Pisauro, Benucci, & Carandini, 2016; Wong, Olafsson, Tal, & Liu, 2013; Xu et al., 2018). The lack of tracking and recording the arousal state during fMRI scanning in our study precludes the assessment of arousal‐related influences on GS topography difference across subjects. Further investigation of the relationships between GS disturbances and ongoing arousal states could be achieved through simultaneous EEG‐fMRI scanning or behavioral eye movement monitoring in epilepsy patients. Second, the antiepileptic medications taken by some patients may have confounded GS topography findings. Although we assess for the treatment effect on GS weights in a limited number of drug‐naïve IGE‐GTCS patients, given the variability of AEDs, combination of medications, doses, and other confounders such as disease severity, these findings require replication in a larger homogeneous prospective investigation. Third, given that cognitive impairment is a common comorbidity of epilepsy (Abarrategui, Parejo‐Carbonell, Garcia Garcia, Di Capua, & Garcia‐Morales, 2018; Lespinet et al., 2002), it would be important to relate the GS findings and cognitive functions of patients in future studies. In addition, because the fMRI data used in our study was acquired without simultaneous EEG recording, possible effects of interictal epileptic discharges on the GS topography disturbances cannot be totally excluded. Thus, further examining the potential influence of interictal discharges is necessary. Finally, given the dynamic nature of the brain, exploring the dynamic characteristics of the GS topography is necessary to enable further understanding of the pathophysiological mechanisms of epileptic discharges.
In summary, we were able to demonstrate spatial shifts of nonuniform GS topography across higher‐order prefrontal cortex and sensory regions in both generalized and focal epilepsy. Notably, the GS topography disturbances of subcortical–cortical networks were engaged bilaterally in IGE‐GTCS, whereas in TLE, they spread beyond the temporal areas but mainly remained lateralized. This study suggests that the epileptic pathological process may affect global excitation/inhibition balance and shift the normal neural information flow of the brain. The findings have potential implications for understanding the neuronal mechanisms of disrupted global brain balance in epilepsy.
CONFLICT OF INTEREST
The authors declare no competing financial interests.
Supporting information
Appendix S1. Supporting Information.
ACKNOWLEDGMENTS
The authors are grateful to all of the participants in this study. This work was supported by the Key Project of Research and Development of Ministry of Science and Technology (No. 2018AAA0100705), the National Natural Science Foundation of China (Nos. 61906034, 61533006, and U1808204), and the Sichuan Science and Technology Program (2019YFS0429).
Li R, Wang H, Wang L, et al. Shared and distinct global signal topography disturbances in subcortical and cortical networks in human epilepsy. Hum Brain Mapp. 2021;42:412–426. 10.1002/hbm.25231
Funding information National Natural Science Foundation of China, Grant/Award Numbers: 61906034, 61533006, U1808204; the Key Project of Research and Development of Ministry of Science and Technology, Grant/Award Number: 2018AAA0100705; the Sichuan Science and Technology Program, Grant/Award Number: 2019YFS0429
Contributor Information
Zhiqiang Zhang, Email: zhangzq2001@126.com.
Guangming Lu, Email: cjr.luguangming@vip.163.com.
Huafu Chen, Email: chenhf@uestc.edu.cn.
DATA AVAILABILITY STATEMENT
All primary data and code used for the analysis are available from the corresponding author on reasonable request. Codes generated for analyses in this study were built in MATLAB combined with add‐on functions or SPM, all freely available and open to the public. Data for the epilepsy patients and healthy controls as well as any specialized codes generated for this study are available from the corresponding author on reasonable request.
REFERENCES
- Abarrategui, B. , Parejo‐Carbonell, B. , Garcia Garcia, M. E. , Di Capua, D. , & Garcia‐Morales, I. (2018). The cognitive phenotype of idiopathic generalized epilepsy. Epilepsy & Behavior, 89, 99–104. 10.1016/j.yebeh.2018.10.007 [DOI] [PubMed] [Google Scholar]
- Badawy, R. A. , Curatolo, J. M. , Newton, M. , Berkovic, S. F. , & Macdonell, R. A. (2007). Changes in cortical excitability differentiate generalized and focal epilepsy. Annals of Neurology, 61(4), 324–331. 10.1002/ana.21087 [DOI] [PubMed] [Google Scholar]
- Bai, X. , Guo, J. , Killory, B. , Vestal, M. , Berman, R. , Negishi, M. , … Blumenfeld, H. (2011). Resting functional connectivity between the hemispheres in childhood absence epilepsy. Neurology, 76(23), 1960–1967. [DOI] [PMC free article] [PubMed] [Google Scholar]
- Banerjee, P. N. , Filippi, D. , & Allen Hauser, W. (2009). The descriptive epidemiology of epilepsy—A review. Epilepsy Research, 85(1), 31–45. 10.1016/j.eplepsyres.2009.03.003 [DOI] [PMC free article] [PubMed] [Google Scholar]
- Behzadi, Y. , Restom, K. , Liau, J. , & Liu, T. T. (2007). A component based noise correction method (CompCor) for BOLD and perfusion based fMRI. NeuroImage, 37(1), 90–101. [DOI] [PMC free article] [PubMed] [Google Scholar]
- Berg, A. T. , Berkovic, S. F. , Brodie, M. J. , Buchhalter, J. , Cross, J. H. , Van Emde Boas, W. , … Scheffer, I. E. (2010). Revised terminology and concepts for organization of seizures and epilepsies: Report of the ILAE Commission on Classification and Terminology, 2005–2009. Epilepsia, 51(4), 676–685. 10.1111/j.1528-1167.2010.02522.x [DOI] [PubMed] [Google Scholar]
- Bettus, G. , Guedj, E. , Joyeux, F. , Confort‐Gouny, S. , Soulier, E. , Laguitton, V. , … Guye, M. (2009). Decreased basal fMRI functional connectivity in epileptogenic networks and contralateral compensatory mechanisms. Human Brain Mapping, 30(5), 1580–1591. 10.1002/hbm.20625 [DOI] [PMC free article] [PubMed] [Google Scholar]
- Blumenfeld, H. (2003). From molecules to networks: Cortical/subcortical interactions in the pathophysiology of idiopathic generalized epilepsy. Epilepsia, 44(Suppl 2), 7–15. [DOI] [PubMed] [Google Scholar]
- Blumenfeld, H. (2012). Impaired consciousness in epilepsy. The Lancet Neurology, 11(9), 814–826. [DOI] [PMC free article] [PubMed] [Google Scholar]
- Blumenfeld, H. (2014). What is a seizure network? Long‐range network consequences of focal seizures In Issues in clinical epileptology: A view from the bench, (pp. 63–70). Berlin, Germany: Springer. [DOI] [PMC free article] [PubMed] [Google Scholar]
- Blumenfeld, H. , McNally, K. A. , Vanderhill, S. D. , Paige, A. L. , Chung, R. , Davis, K. , … Spencer, S. S. (2004). Positive and negative network correlations in temporal lobe epilepsy. Cerebral Cortex, 14(8), 892–902. 10.1093/cercor/bhh048 [DOI] [PubMed] [Google Scholar]
- Blumenfeld, H. , Varghese, G. I. , Purcaro, M. J. , Motelow, J. E. , Enev, M. , McNally, K. A. , … Spencer, S. S. (2009). Cortical and subcortical networks in human secondarily generalized tonic‐clonic seizures. Brain, 132(Pt 4), 999–1012. 10.1093/brain/awp028 [DOI] [PMC free article] [PubMed] [Google Scholar]
- Centeno, M. , & Carmichael, D. W. (2014). Network connectivity in epilepsy: Resting state fMRI and EEG–fMRI contributions. Frontiers in Neurology, 5, 93. [DOI] [PMC free article] [PubMed] [Google Scholar]
- Chang, C. , Leopold, D. A. , Schölvinck, M. L. , Mandelkow, H. , Picchioni, D. , Liu, X. , … Duyn, J. H. (2016). Tracking brain arousal fluctuations with fMRI. Proceedings of the National Academy of Sciences, 113(16), 4518–4523. [DOI] [PMC free article] [PubMed] [Google Scholar]
- Cole, M. W. , Anticevic, A. , Repovs, G. , & Barch, D. (2011). Variable global dysconnectivity and individual differences in schizophrenia. Biological Psychiatry, 70(1), 43–50. [DOI] [PMC free article] [PubMed] [Google Scholar]
- Cole, M. W. , Pathak, S. , & Schneider, W. (2010). Identifying the brain's most globally connected regions. NeuroImage, 49(4), 3132–3148. 10.1016/j.neuroimage.2009.11.001 [DOI] [PubMed] [Google Scholar]
- Englot, D. J. , D'Haese, P. F. , Konrad, P. E. , Jacobs, M. L. , Gore, J. C. , Abou‐Khalil, B. W. , & Morgan, V. L. (2017). Functional connectivity disturbances of the ascending reticular activating system in temporal lobe epilepsy. Journal of Neurology, Neurosurgery, and Psychiatry, 88(11), 925–932. 10.1136/jnnp-2017-315732 [DOI] [PMC free article] [PubMed] [Google Scholar]
- Englot, D. J. , Hinkley, L. B. , Kort, N. S. , Imber, B. S. , Mizuiri, D. , Honma, S. M. , … Nagarajan, S. S. (2015). Global and regional functional connectivity maps of neural oscillations in focal epilepsy. Brain, 138(Pt 8), 2249–2262. 10.1093/brain/awv130 [DOI] [PMC free article] [PubMed] [Google Scholar]
- Englot, D. J. , Konrad, P. E. , & Morgan, V. L. (2016). Regional and global connectivity disturbances in focal epilepsy, related neurocognitive sequelae, and potential mechanistic underpinnings. Epilepsia, 57(10), 1546–1557. 10.1111/epi.13510 [DOI] [PMC free article] [PubMed] [Google Scholar]
- Fisher, R. S. , Cross, J. H. , French, J. A. , Higurashi, N. , Hirsch, E. , Jansen, F. E. , … Zuberi, S. M. (2017). Operational classification of seizure types by the International League Against Epilepsy: Position paper of the ILAE Commission for Classification and Terminology. Epilepsia, 58(4), 522–530. 10.1111/epi.13670 [DOI] [PubMed] [Google Scholar]
- Fox, M. D. , Snyder, A. Z. , Vincent, J. L. , Corbetta, M. , Van Essen, D. C. , & Raichle, M. E. (2005). The human brain is intrinsically organized into dynamic, anticorrelated functional networks. Proceedings of the National Academy of Sciences, 102(27), 9673–9678. [DOI] [PMC free article] [PubMed] [Google Scholar]
- Geha, P. , Cecchi, G. , Todd Constable, R. , Abdallah, C. , & Small, D. M. (2017). Reorganization of brain connectivity in obesity. Human Brain Mapping, 38(3), 1403–1420. 10.1002/hbm.23462 [DOI] [PMC free article] [PubMed] [Google Scholar]
- Gotman, J. (2008). Epileptic networks studied with EEG‐fMRI. Epilepsia, 49(Suppl 3), 42–51. 10.1111/j.1528-1167.2008.01509.x [DOI] [PMC free article] [PubMed] [Google Scholar]
- Han, S. , Wang, X. , He, Z. , Sheng, W. , Zou, Q. , Li, L. , … Chen, H. (2019). Decreased static and increased dynamic global signal topography in major depressive disorder. Progress in Neuro‐Psychopharmacology & Biological Psychiatry, 94, 109665 10.1016/j.pnpbp.2019.109665 [DOI] [PubMed] [Google Scholar]
- Jansen, J. F. , Aldenkamp, A. P. , Majoie, H. M. , Reijs, R. P. , de Krom, M. C. , Hofman, P. A. , … Backes, W. H. (2006). Functional MRI reveals declined prefrontal cortex activation in patients with epilepsy on topiramate therapy. Epilepsy & Behavior, 9(1), 181–185. [DOI] [PubMed] [Google Scholar]
- Killory, B. D. , Bai, X. , Negishi, M. , Vega, C. , Spann, M. N. , Vestal, M. , … Trejo, J. (2011). Impaired attention and network connectivity in childhood absence epilepsy. NeuroImage, 56(4), 2209–2217. [DOI] [PMC free article] [PubMed] [Google Scholar]
- Kramer, M. A. , & Cash, S. S. (2012). Epilepsy as a disorder of cortical network organization. The Neuroscientist, 18(4), 360–372. [DOI] [PMC free article] [PubMed] [Google Scholar]
- Kros, L. , Eelkman Rooda, O. H. , Spanke, J. K. , Alva, P. , van Dongen, M. N. , Karapatis, A. , … Hoebeek, F. E. (2015). Cerebellar output controls generalized spike‐and‐wave discharge occurrence. Annals of Neurology, 77(6), 1027–1049. 10.1002/ana.24399 [DOI] [PMC free article] [PubMed] [Google Scholar]
- Kuhnert, M.‐T. , Elger, C. E. , & Lehnertz, K. (2010). Long‐term variability of global statistical properties of epileptic brain networks. Chaos: An Interdisciplinary Journal of Nonlinear Science, 20(4), 043126. [DOI] [PubMed] [Google Scholar]
- Laufs, H. , & Duncan, J. S. (2007). Electroencephalography/functional MRI in human epilepsy: What it currently can and cannot do. Current Opinion in Neurology, 20(4), 417–423. 10.1097/WCO.0b013e3282202b92 [DOI] [PubMed] [Google Scholar]
- Lespinet, V. , Bresson, C. , N'Kaoua, B. , Rougier, A. , & Claverie, B. (2002). Effect of age of onset of temporal lobe epilepsy on the severity and the nature of preoperative memory deficits. Neuropsychologia, 40(9), 1591–1600. 10.1016/s0028-3932(02)00012-x [DOI] [PubMed] [Google Scholar]
- Li, R. , Hu, C. , Wang, L. , Liu, D. , Liu, D. , Liao, W. , … Feng, L. (2019). Disruption of functional connectivity among subcortical arousal system and cortical networks in temporal lobe epilepsy. Brain Imaging and Behavior, 14(3), 762–771. [DOI] [PubMed] [Google Scholar]
- Li, R. , Liao, W. , Li, Y. , Yu, Y. , Zhang, Z. , Lu, G. , & Chen, H. (2016). Disrupted structural and functional rich club organization of the brain connectome in patients with generalized tonic‐clonic seizure. Human Brain Mapping, 37(12), 4487–4499. 10.1002/hbm.23323 [DOI] [PMC free article] [PubMed] [Google Scholar]
- Li, X. , Large, C. H. , Ricci, R. , Taylor, J. J. , Nahas, Z. , Bohning, D. E. , … George, M. S. (2011). Using interleaved transcranial magnetic stimulation/functional magnetic resonance imaging (fMRI) and dynamic causal modeling to understand the discrete circuit specific changes of medications: Lamotrigine and valproic acid changes in motor or prefrontal effective connectivity. Psychiatry Research: Neuroimaging, 194(2), 141–148. [DOI] [PubMed] [Google Scholar]
- Liu, F. , Wang, Y. , Li, M. , Wang, W. , Li, R. , Zhang, Z. , … Chen, H. (2017). Dynamic functional network connectivity in idiopathic generalized epilepsy with generalized tonic‐clonic seizure. Human Brain Mapping, 38(2), 957–973. 10.1002/hbm.23430 [DOI] [PMC free article] [PubMed] [Google Scholar]
- Luo, C. , Li, Q. , Xia, Y. , Lei, X. , Xue, K. , Yao, Z. , … Yao, D. (2012). Resting state basal ganglia network in idiopathic generalized epilepsy. Human Brain Mapping, 33(6), 1279–1294. 10.1002/hbm.21286 [DOI] [PMC free article] [PubMed] [Google Scholar]
- Mankinen, K. , Long, X. Y. , Paakki, J. J. , Harila, M. , Rytky, S. , Tervonen, O. , … Kiviniemi, V. (2011). Alterations in regional homogeneity of baseline brain activity in pediatric temporal lobe epilepsy. Brain Research, 1373, 221–229. 10.1016/j.brainres.2010.12.004 [DOI] [PubMed] [Google Scholar]
- Mittmann, W. , Koch, U. , & Häusser, M. (2005). Feed‐forward inhibition shapes the spike output of cerebellar Purkinje cells. The Journal of Physiology, 563(2), 369–378. [DOI] [PMC free article] [PubMed] [Google Scholar]
- Motelow, J. E. , Li, W. , Zhan, Q. , Mishra, A. M. , Sachdev, R. N. , Liu, G. , … Blumenfeld, H. (2015). Decreased subcortical cholinergic arousal in focal seizures. Neuron, 85(3), 561–572. 10.1016/j.neuron.2014.12.058 [DOI] [PMC free article] [PubMed] [Google Scholar]
- Mueller, S. , Wang, D. , Fox, M. D. , Yeo, B. T. , Sepulcre, J. , Sabuncu, M. R. , … Liu, H. (2013). Individual variability in functional connectivity architecture of the human brain. Neuron, 77(3), 586–595. 10.1016/j.neuron.2012.12.028 [DOI] [PMC free article] [PubMed] [Google Scholar]
- Murrough, J. W. , Abdallah, C. G. , Anticevic, A. , Collins, K. A. , Geha, P. , Averill, L. A. , … Charney, D. S. (2016). Reduced global functional connectivity of the medial prefrontal cortex in major depressive disorder. Human Brain Mapping, 37(9), 3214–3223. 10.1002/hbm.23235 [DOI] [PMC free article] [PubMed] [Google Scholar]
- Norden, A. D. , & Blumenfeld, H. (2002). The role of subcortical structures in human epilepsy. Epilepsy & Behavior, 3(3), 219–231. [DOI] [PubMed] [Google Scholar]
- Pisauro, M. A. , Benucci, A. , & Carandini, M. (2016). Local and global contributions to hemodynamic activity in mouse cortex. Journal of Neurophysiology, 115(6), 2931–2936. [DOI] [PMC free article] [PubMed] [Google Scholar]
- Power, J. , Barnes, K. A. , Snyder, A. Z. , Schlaggar, B. L. , & Petersen, S. E. (2012). Spurious but systematic correlations in functional connectivity MRI networks arise from subject motion. NeuroImage, 59, 2142–2154. [DOI] [PMC free article] [PubMed] [Google Scholar]
- Power, J. D. , Mitra, A. , Laumann, T. O. , Snyder, A. Z. , Schlaggar, B. L. , & Petersen, S. E. (2014). Methods to detect, characterize, and remove motion artifact in resting state fMRI. NeuroImage, 84, 320–341. 10.1016/j.neuroimage.2013.08.048 [DOI] [PMC free article] [PubMed] [Google Scholar]
- Scholvinck, M. L. , Maier, A. , Ye, F. Q. , Duyn, J. H. , & Leopold, D. A. (2010). Neural basis of global resting‐state fMRI activity. Proceedings of the National Academy of Sciences of the United States of America, 107(22), 10238–10243. 10.1073/pnas.0913110107 [DOI] [PMC free article] [PubMed] [Google Scholar]
- Spencer, S. S. (2002). Neural networks in human epilepsy: Evidence of and implications for treatment. Epilepsia, 43(3), 219–227. [DOI] [PubMed] [Google Scholar]
- Sporns, O. (2011). The human connectome: A complex network. Annals of the new York Academy of Sciences, 1224, 109–125. 10.1111/j.1749-6632.2010.05888.x [DOI] [PubMed] [Google Scholar]
- Sporns, O. (2013). Network attributes for segregation and integration in the human brain. Current Opinion in Neurobiology, 23(2), 162–171. 10.1016/j.conb.2012.11.015 [DOI] [PubMed] [Google Scholar]
- Turchi, J. , Chang, C. , Ye, F. Q. , Russ, B. E. , Yu, D. K. , Cortes, C. R. , … Leopold, D. A. (2018). The basal forebrain regulates global resting‐state fMRI fluctuations. Neuron, 97(4), 940–952 e944. 10.1016/j.neuron.2018.01.032 [DOI] [PMC free article] [PubMed] [Google Scholar]
- van den Heuvel, M. P. , Kahn, R. S. , Goni, J. , & Sporns, O. (2012). High‐cost, high‐capacity backbone for global brain communication. Proceedings of the National Academy of Sciences of the United States of America, 109(28), 11372–11377. 10.1073/pnas.1203593109 [DOI] [PMC free article] [PubMed] [Google Scholar]
- Van Essen, D. C. , & Dierker, D. L. (2007). Surface‐based and probabilistic atlases of primate cerebral cortex. Neuron, 56(2), 209–225. 10.1016/j.neuron.2007.10.015 [DOI] [PubMed] [Google Scholar]
- Wang, X. , Liao, W. , Han, S. , Li, J. , Zhang, Y. , Zhao, J. , & Chen, H. (2019). Altered dynamic global signal topography in antipsychotic‐naive adolescents with early‐onset schizophrenia. Schizophrenia Research, 208, 308–316. 10.1016/j.schres.2019.01.035 [DOI] [PubMed] [Google Scholar]
- Wong, C. W. , Olafsson, V. , Tal, O. , & Liu, T. T. (2013). The amplitude of the resting‐state fMRI global signal is related to EEG vigilance measures. NeuroImage, 83, 983–990. [DOI] [PMC free article] [PubMed] [Google Scholar]
- Xu, H. , Su, J. , Qin, J. , Li, M. , Zeng, L.‐L. , Hu, D. , & Shen, H. (2018). Impact of global signal regression on characterizing dynamic functional connectivity and brain states. NeuroImage, 173, 127–145. [DOI] [PubMed] [Google Scholar]
- Yang, G. J. , Murray, J. D. , Glasser, M. , Pearlson, G. D. , Krystal, J. H. , Schleifer, C. , … Anticevic, A. (2017). Altered global signal topography in schizophrenia. Cerebral Cortex, 27(11), 5156–5169. [DOI] [PMC free article] [PubMed] [Google Scholar]
- Yang, G. J. , Murray, J. D. , Wang, X. J. , Glahn, D. C. , Pearlson, G. D. , Repovs, G. , … Anticevic, A. (2016). Functional hierarchy underlies preferential connectivity disturbances in schizophrenia. Proceedings of the National Academy of Sciences of the United States of America, 113(2), E219–E228. 10.1073/pnas.1508436113 [DOI] [PMC free article] [PubMed] [Google Scholar]
- Yeo, B. T. , Krienen, F. M. , Sepulcre, J. , Sabuncu, M. R. , Lashkari, D. , Hollinshead, M. , … Buckner, R. L. (2011). The organization of the human cerebral cortex estimated by intrinsic functional connectivity. Journal of Neurophysiology, 106(3), 1125–1165. 10.1152/jn.00338.2011 [DOI] [PMC free article] [PubMed] [Google Scholar]
- Yeo, B. T. , Tandi, J. , & Chee, M. W. (2015). Functional connectivity during rested wakefulness predicts vulnerability to sleep deprivation. NeuroImage, 111, 147–158. [DOI] [PubMed] [Google Scholar]
- Zhang, J. , Magioncalda, P. , Huang, Z. , Tan, Z. , Hu, X. , Hu, Z. , … Northoff, G. (2018). Altered global signal topography and its different regional localization in motor cortex and hippocampus in mania and depression. Schizophrenia Bulletin, 45, 902–910. 10.1093/schbul/sby138 [DOI] [PMC free article] [PubMed] [Google Scholar]
- Zhang, Z. , Liao, W. , Chen, H. , Mantini, D. , Ding, J. R. , Xu, Q. , … Lu, G. (2011). Altered functional‐structural coupling of large‐scale brain networks in idiopathic generalized epilepsy. Brain, 134(Pt 10), 2912–2928. 10.1093/brain/awr223 [DOI] [PubMed] [Google Scholar]
- Zhang, Z. , Liao, W. , Xu, Q. , Wei, W. , Zhou, H. J. , Sun, K. , … Lu, G. (2017). Hippocampus‐associated causal network of structural covariance measuring structural damage progression in temporal lobe epilepsy. Human Brain Mapping, 38(2), 753–766. 10.1002/hbm.23415 [DOI] [PMC free article] [PubMed] [Google Scholar]
Associated Data
This section collects any data citations, data availability statements, or supplementary materials included in this article.
Supplementary Materials
Appendix S1. Supporting Information.
Data Availability Statement
All primary data and code used for the analysis are available from the corresponding author on reasonable request. Codes generated for analyses in this study were built in MATLAB combined with add‐on functions or SPM, all freely available and open to the public. Data for the epilepsy patients and healthy controls as well as any specialized codes generated for this study are available from the corresponding author on reasonable request.