Abstract
A text mining technique, based on an Application Programming Interface (API) request—using narrative data from Twitter™ and ScienceDirect™—was used to identify how non-academics and academics conceptualize and evaluate sentiment indicators associated with the term financial risk in their communications. It was determined that unlike the day-to-day uses of the term—all of which tend to focus predominately on the business and technology aspects of risk taking—the academic definition of the term is expressed broadly. It was also determined that the term was mainly associated with negative emotions in daily conversations, whereas the term tended to be used in a positive way in research paper abstracts. Results from this study suggest that the way financial risk is conceptualized and applied in real-life settings primarily represents negative emotional contexts, while academic papers tend to represent positive emotional contexts. Information presented in this paper can help educators, researchers, and policy makers better understand the way non-academics objectively and subjectively evaluate and describe financial risk. This information may help lead to better investor educational interventions and decision outcomes.
Keyword: Twitter and ScienceDirect mining, Sentiment analysis, Semantic analysis, Financial risk
Introduction
Defining what is meant by—let alone conceptualizing the emotional context (i.e., sentiment) of—the term risk is an elusive task. At the broadest level, risk refers to an event or action that has the potential to be a danger or problem in the future (MacMillan Dictionary, n.d.). In practice, the term is most often used to describe an action that can result in both or either a positive or negative outcome.1 Risk is typically categorized as being either objective or subjective in nature. An objective risk is one that can be quantified with known probabilities. Subjective risk is something that is based on individual judgment and belief, making it, essentially, a personal perception.
Outside of the academy, the term risk is most often used to describe something that entails a potential (real or imagined) negative outcome. Phrases such as,“The risk is worth the return” and “You only make money if you take a risk” are examples of the ways risk is frequently used in the day-to-day vernacular. As illustrated with these statements, there is an assumed potential negative outcome associated with nearly all risky behaviors. Incurring or taking a risk, when conceptualized negatively, is worthwhile only if the benefits accrued or other outcomes are both positive and in excess of the risk taken. While some risk-taking activities have pre-determined probabilities associated with behavioral engagement (e.g., casino gambling), the majority of risky situations and choices faced by individuals involve subjective assessments of risk and return outcomes. This helps explain why certain words consistently come to mind when describing risk. Words that indicate negative sentiment are often used to describe risk when a potential outcome is perceived as potentially harmful. Examples of negative words include danger, hazard, liability, peril, and jeopardy. When perceived positively (e.g., taking risk results in a gain), it is common to hear risk framed in positive terms. Examples of words that represent positive sentiment include opportunity, security, safety, and fun. Some descriptors of risk are neutral in tone and disguise an individual’s perception of a given risk. Words fitting a neutral description include possibility, gamble, luck, speculation, and wager.
Negative perceptions about risk, particularly financial risk, can result in skewed decision-making outcomes at the household level and lead to suboptimal goal achievement. Slovic (1986) argued that lay and professional risk judgments are often inaccurate. This does not mean that risk judgments are not important. An inaccurate, yet deeply held, perception can influence the type of decisions someone makes. It is well known that risks related to dramatic and sensational events, such as homicides, mass shootings, cancer, and natural disasters, tend to be overestimated (Lichtenstein et al. 1978). Terms used to describe common sentiment related to these types of events include dread, fear, anxiousness, and loathing. These terms are also used to describe outcomes that nearly all people strive to avoid. Thus, if individuals perceive risk primarily in negative terms, it is no surprise when these same individuals take steps to avoid situations in which risk is present.
The purpose of the study described in this paper is two-fold. The first purpose is to identify how non-academics and academics conceptualize and use the term financial risk in their communications. A text mining technique, based on an Application Programming Interface (API) request, was used to determine the degree to which the term financial risk is associated with positive, negative, and neutral perceptions. The second purpose is to compare and contrast sentiment indicators associated with the term financial risk between non-academics and academics. Findings from this study provide a general sense of the way financial risk is conceptualized and applied in real life settings, as well as conceptually in the academic literature. Information presented in this paper can help educators, researchers, and policy makers better understand the way non-academics objectively and subjectively evaluate and describe financial risk. In this regard, the following research questions were addressed in this study.
What type of words are associated with the term financial risk in non-academic and academic conversations and publications?
What type of sentiments are expressed when people use the term financial risk in non-academic and academic conversations and publications?
What are the central concepts and words associated with the term financial risk when categorized as positive, negative, and neutral network sentiments?
Do non-academics and academics utilize similar or different words when referring to financial risk?
The remainder of this paper is structured as follows: The next section presents the methodology used to analyze the number, the tone (i.e., sentiment), and the concepts underlying the use of words most widely associated with the term financial risk. This is followed by a description of study results and a discussion of findings with an emphasis on implications for educators, researchers, and policy makers who are interested in risk communication and risk education.
Data, method, and analysis
Data
Two data sources were used for this study. The first source of data for the analysis were collected from Twitter™ (www.twitter.com) in 2019. Twitter is one of the most popular social media websites/mobile applications used by consumers, policy makers, businesses, and decision makers. Twitter is known to be a novel source of data for those studying attitudes, beliefs, and behaviors of consumers and opinion makers (Kang et al. 2017). Twitter data were analyzed to examine daily public conversations in relation to the term financial risk through users’ social interactions and messages.
The Twitter platform allows registered users to post and interact with others using messages known as "tweets”. According to Statista (2019), Twitter had 68 million monthly active users in the United States in 2019. Table 1 provides descriptive statistics for general users of Twitter. As shown in Table 1, in 2019, 38% of Twitter users were between 18 and 29Â years old, followed by the age group between 30 and 49Â years (26%). In 2019, more than half of Twitter users (56%) were male, and 32% of users had a college degree or higher level of education.
Table 1.
Descriptive statistics for twitter users in 2019
| Characteristic | % |
|---|---|
| Age | |
| 18–29 | 38 |
| 30–49 | 26 |
| 50–64 | 17 |
| 65+ | 7 |
| Gender | |
| Male | 56 |
| Female | 44 |
| Education | |
| High school or less | 13 |
| Some college | 24 |
| Higher than college | 32 |
The second source of data for the analysis were collected from Science Direct™ (www.sciencedirect.com) in 2019. ScienceDirect is an open platform providing journal articles and book chapters from more than 2,500 peer-reviewed journals and 11,000 books (Journal of Medical Library Association 2013). ScienceDirect mainly covers publications in the health sciences, life sciences, and social sciences. ScienceDirect offers broad access to paper abstracts and full-text papers. Data from ScienceDirect were analyzed to identify words commonly used in association with the term financial risk among those in academia.
Data collection method
An Application Programming Interface (API) method was used to collect data from Twitter and ScienceDirect. An API is a communication protocol between clients (developers) and a server that receives and sends responses. There are several ways to conduct an API request, although the most common method, as used in this study, involves requesting permission to build an API application for a certain server (i.e., Twitter and ScienceDirect).
An API request that asked for all messages and papers tweeted/published in 2019 containing the term financial risk was sent to the server. Approximately 300 tweet messages containing the term financial risk were acquired, whereas 104 research papers containing the term financial risk in the abstract, title, or as a keyword were obtained from ScienceDirect. Twitter data contained basic information, including usernames, tweet messages, favorite indicators, retweet counts, and other similar information. ScienceDirect data contained paper titles, journal names, publication years, abstracts, and authors’ information. For the purposes of this study, only tweet content (i.e., messages) and words in abstracts were analyzed. Several data cleaning adjustments were made. Duplicated words such as finance and financial were combined into a single word called financial. All letters were converted to lowercase letters as a way to ensure consistency. Symbols, numbers, non-alphabet characters, individual usernames, company names, Uniform Resource Locator (URL), function words2 (e.g., but and with), stop words3 (e.g., the, and, which, etc.), and unnecessary spaces within and among letters and words were removed from the raw data prior to data analysis. For the ScienceDirect data, study, research, and heading words describing common paper sections (e.g., introduction, literature, data, methods, analysis, results, conclusion, etc.) were additionally removed.
Methods and analysis
The primary goal of this study was to examine and compare sentiment about the term financial risk across social media and academic papers by analyzing the semantic network of messages and abstracts from Twitter and ScienceDirect. Several tests were used to provide insights into the central concepts associated with the term financial risk. All words and phrases were analyzed using R programming language. Figure 1 shows the main function procedures, illustrated as a three-step process, and packages used for the analysis.
Fig. 1.
Process of analysis in three stages
Frequency analysis
Two data analysis procedures were used to identify words that were most often used in connection with the term financial risk. Word frequency distributions and pattern recognitions were analyzed using text-mining techniques. Text mining allows various definitions and ranges, as an extension of classical data mining methods, to be applied when making sophisticated formulations using text classification and clustering procedures (Meyer et al. 2008). Using the text mining method, 1,366 words from tweets that included the term financial risk, and 3,216 words from abstracts that included the term financial risk, were extracted and analyzed.
In addition to a single word, the word-pair that each word was associated with in the text was extracted from tweets and abstracts. The way in which these word-pairs tend to co-occur provided important information about the meaning of concepts (Evert 2005). A total of 5,981 word pairs from tweet messages and 23,816 word pairs from the abstracts were extracted and analyzed.
Sentiment analysis
A unique aspect of this study was the analysis of words used in tweet messages and abstracts of academic papers as indicators of personal/authorial sentiment and emotion associated with the term financial risk. The analytical approach focused on identifying opinions that represent or express positive, negative, or neutral emotions (Ji et al. 2015; Messias et al. 2017). In this study, the sentiment analysis used natural language processing and computational linguistics to systematically identify, extract, and quantify affective states and subjective information (Liu 2012). This study adopted the lexicon that was developed in the Nebraska Literary Lab to obtain a sentiment score associated with each sentence observed in the sentiment analysis (Jockers 2017). Based on score numbers that can be positive, negative, or zero, each sentence was classified into a sentiment group (i.e., positive, negative, or neutral). A further analysis was conducted to test the relationships among the three sentiment groups. The primary goal of this element of the analysis was to identify and compare sentiment differences between tweet messages (daily conversations) and research papers (scholarly communications).4
Semantic network analysis
A semantic network analysis was then used to model semantic relationships using graphical representations with labeled nodes and edges, where nodes represent words and edges represent relations among nodes. Analyzing the semantic structure of networks, as a visual text analytics system, provided a pathway, in this study, for the identification of central concepts or meaningful relationships between and among words (Drieger 2013).
Embedded in this approach is the notion that clusters in a network represent groups of strongly connected words. In this study, the Girvan-Newman (Girvan and Newman 2002; Newman and Girvan 2004) algorithm was used to detect clusters. Everett (2018) noted that the Girvan-Newman algorithm is among the best-known methods to form a cohesive subgroup in a network. This analysis was followed by the estimation of statistical quantity measures, such as centrality. Calculating multiple centralities allowed for the identification of the significance and importance of words in a network (Das et al. 2018; Ibarra and Andrews 1993) Table 2 provides the definition of measured centralities used in this paper.
Table 2.
Definitions of term and centrality used in the study
| Term | Definition |
|---|---|
| Network density | The interconnectedness of nodes in the network |
| Network diameter | The compactness of the network |
| Network modularity | The strength of division of a network into modules |
| Degree centrality | The measure of the link that a node has |
| Betweenness centrality | The number of times a node lies on the shortest path between other nodes |
| Closeness centrality | The average length of the shortest path between the node and other nodes |
| Eigenvector centrality | The measure of the influence that a node has |
Results and discussion
Table 3 shows the most frequently used single words and word pairs associated with the term financial risk. Results from the two models are presented in the table. Each model includes the 10 most often used words and their frequencies. The first model includes the text source from Twitter. Among Twitter users, management was used most often whenever financial risk was included in a tweet. The word market was second, whereas software was the third most often used word. For word pairs, risk management was used most often. This was followed by financial management and market risk.
Table 3.
Most frequently used words associated with the term‘Financial Risk’
| ScienceDirect | |||||||
|---|---|---|---|---|---|---|---|
| Single Word | Word Pairs | Single Word | Word Pairs | ||||
| Word | % | Word | % | Word | % | Word | % |
| Management | 4.03 | Risk management | 0.79 | Market | 1.80 | Risk management | 0.08 |
| Market | 2.76 | Financial management | 0.77 | Cost | 1.74 | Health care | 0.05 |
| Software | 1.49 | Market risk | 0.54 | System | 1.74 | Monetary policy | 0.05 |
| Global | 1.42 | Market management | 0.48 | Chain | 1.34 | Financial market | 0.05 |
| Webinar | 1.34 | Software risk | 0.33 | Supply | 1.27 | Financial model | 0.05 |
| Business | 1.27 | Financial software | 0.32 | Care | 1.27 | Risk measurement | 0.05 |
| Report | 1.19 | Software management | 0.32 | Energy | 1.21 | Risk preference | 0.04 |
| News | 1.05 | Webinar risk | 0.30 | Base | 1.12 | Risk supply | 0.04 |
| Blockchain | 0.97 | Software market | 0.28 | Uncertainty | 1.06 | Exchange rate | 0.04 |
| Growth | 0.97 | Webinar counterparty | 0.27 | Patient | 1.03 | Stock market | 0.04 |
The second model shows text results from Science Direct. As shown in Table 3, the most often used single word when the term financial risk appeared in an abstract was market. This was followed by the words cost and system in that order. Risk management, health care, and monetary policy were the three most used word pairs contained in paper abstracts.
The data shown in Table 3 indicate that financial risk was used broadly both in day-to-day and academic conversations. While most concepts shown in Table 3 relate to finance or business, nonbusiness words, such as software, health, and energy, were also used to describe financial risk across non-academic and academic posts and abstracts.
Figure 2 illustrates the results from the sentiment analysis. The semantic analysis was conducted by sentiment group based on the text source. The purpose of the analysis was to determine the tone or emotion invoked in tweets and abstracts that contained the term financial risk. The objective of the analysis was to determine whether these concepts were primarily used in a negative, positive, or neutral manner when applied in day-to-day conversations and when presented in academic publications. By conducting the sentiment analysis at a sentence level, every sentence was categorized into one of the three sentiment groups (i.e., positive, negative, and neutral) based on a sentiment score (i.e., positive, negative, and zero scores). Approximately 46% of tweet sentences that included the term financial risk were negative, whereas 39% were positive, and 15% were neutral. Among the paper abstracts, 32% of sentences represented a negative sentiment in relation to the term financial risk, while 62% were positive, and 6% were neutral.
Fig. 2.
Sentiment proportion of text for the term ‘Financial risk’
Table 4 shows the most often used words associated with each sentiment group. In the positive group, management and market were the words most often cited from tweet messages and paper abstracts. Webinar and uncertainty were the most often used negative words, whereas business and patient were the most widely used neutral words associated with the term financial risk. The data in Table 4 indicate that the term financial risk was widely associated with concepts and terms from a variety of domains. Unique words (e.g., China, climate, lecturer, psychology, readmission, etc.) emerged as important in the sentiment analysis, indicating the diversity of domains compared to what was observed in Table 3.
Table 4.
Most frequently used word associated with the term‘Financial Risk’ by sentiment group
| ScienceDirect | |||||||||||
|---|---|---|---|---|---|---|---|---|---|---|---|
| Positive | Negative | Neutral | Positive | Negative | Neutral | ||||||
| Word | % | Word | % | Word | % | Word | % | Word | % | Word | % |
| Management | 6.41 | Webinar | 2.32 | Business | 3.45 | Market | 3.56 | Uncertainty | 1.67 | Patient | 1.97 |
| Market | 3.88 | Technology | 1.93 | Coach | 2.87 | System | 3.23 | Cost | 1.42 | Readmission | 1.57 |
| Software | 2.36 | Market | 1.80 | Data | 2.30 | Care | 2.75 | High | 1.05 | Scenario | 1.57 |
| Calendar | 2.02 | Management | 1.68 | Attendance | 1.72 | Cost | 2.43 | System | 1.05 | Comparison | 1.18 |
| Growth | 2.02 | Blockchain | 1.29 | Conference | 1.72 | Energy | 2.43 | Chain | 0.99 | Cost | 1.18 |
| Global | 1.85 | Counterparty | 1.29 | Global | 1.72 | Performance | 2.34 | Impact | 0.93 | Hospital | 1.18 |
| Climate | 1.35 | Mitigation | 1.29 | Group | 1.72 | Price | 2.26 | Loss | 0.86 | Impact | 1.18 |
| News | 1.35 | China | 1.29 | Investor | 1.72 | Supply | 2.18 | Supply | 0.86 | Large | 1.18 |
| Business | 1.35 | Woman | 1.16 | Lecturer | 1.72 | Base | 2.10 | Market | 0.74 | Requirement | 1.18 |
| Stability | 1.18 | Crisis | 1.16 | Psychology | 1.72 | Chain | 2.10 | Treatment | 0.68 | Similarity | 1.18 |
Table 5 provides the descriptive statistics associated with each sentiment network after the semantic network analysis was conducted. The total number of nodes represents the network size. As shown in Table 5, paper abstracts exhibited larger networks than tweet messages across the three sentiments. All networks across the three paper abstract sentiments were less dense than networks from tweet messages. A community detection algorithm indicated more communities among positive and negative networks, but less in the neutral network, from tweet messages. Average closeness centralities from tweet networks were higher than the centralities from the paper abstract networks across the three sentiments. Compared to the paper abstract networks, positive and negative networks from tweet messages had a larger average path length, higher average degree centrality, higher average betweenness centrality, higher average eigenvector centrality, and higher average clustering coefficients.
Table 5.
Descriptive statistics of each sentiment network
| Text Source | Science Direct | |||||
|---|---|---|---|---|---|---|
| Sentiment Network | Positive | Negative | Neutral | Positive | Negative | Neutral |
| Number of Nodes | 472 | 763 | 172 | 2,540 | 1,521 | 376 |
| Number of Edges | 669 | 1,030 | 189 | 5,722 | 2,508 | 405 |
| Average Degree | 2.801 | 2.296 | 1.778 | 4.432 | 3.243 | 2.061 |
| Average Weighted Degree | 4.326 | 3.874 | 2.413 | 5.013 | 3.684 | 2.04 |
| Number of Connected Components | 5 | 23 | 16 | 5 | 3 | 24 |
| Diameter | 15 | 18 | 13 | 16 | 18 | 35 |
| Density | 0.006 | 0.004 | 0.014 | 0.002 | 0.002 | 0.006 |
| Modularity | 0.381 | 0.072 | 0.711 | 0.470 | 0.623 | 0.616 |
| Number of Communities | 15 | 23 | 24 | 13 | 16 | 26 |
| Average Path Length | 4.763 | 5.550 | 5.003 | 4.589 | 5.248 | 12.328 |
| Average Degree Centrality | 0.006 | 0.004 | 0.016 | 0.002 | 0.002 | 0.006 |
| Average Betweenness Centrality | 0.075 | 0.007 | 0.010 | 0.001 | 0.003 | 0.018 |
| Average Closeness Centrality | 0.224 | 0.228 | 0.363 | 0.224 | 0.199 | 0.197 |
| Average Eigenvector Centrality | 0.043 | 0.031 | 0.067 | 0.023 | 0.018 | 0.088 |
| Average Clustering Coefficient | 0.051 | 0.058 | 0.016 | 0.041 | 0.036 | 0.032 |
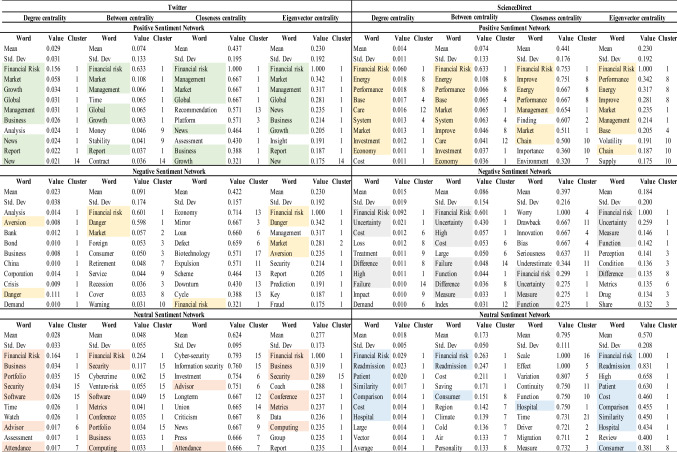
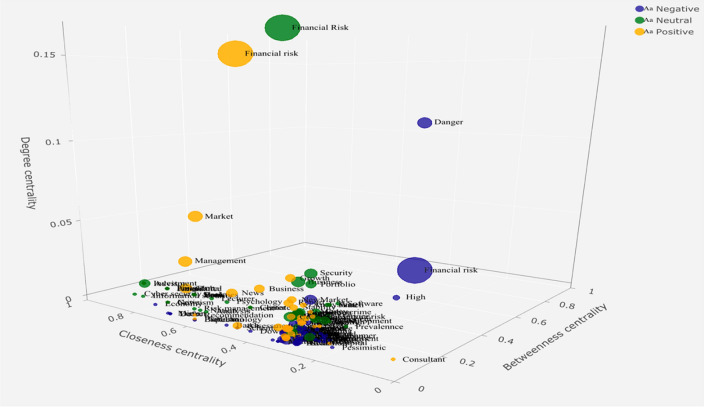
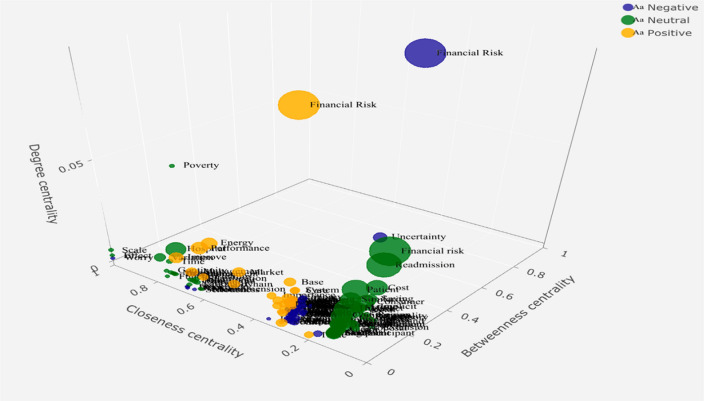
Table 6 shows the value of multiple centralities that describeS the importance and influence of concepts for each sentiment network. Duplicated words within the same sentiment and the same text source (e.g., the positive sentiment network from tweet messages) across the four centralities are highlighted. Overall, there was not much overlap among words used in tweet messages and paper abstracts. Excluding an expected node (i.e., financial risk), common central concepts within the positive network from tweet messages were found to be related to business and finance. Positive network words included market, management, business, report, and growth. In addition to these business-related words, energy and performance emerged as important concepts for the positive sentiment networks from paper abstracts. Significant words in the negative sentiment network, from both text sources, included danger, aversion, uncertainty, failure, and loss. The neutral sentiment network’s important words from tweet messages centered around the concept of business and technology (e.g., cybersecurity, information security, and cybercrime), while networks from the paper abstracts were related to words like patient, hospital, and readmission. Figures 3 and 4 show the significant words for both networks by betweenness centrality (x-axis), closeness centrality (y-axis), degree centrality (z-axis), and eigenvector centrality (bubble size). In relation to the four centralities, the following words emerged from the analysis of tweet data: market, danger, and security. These words represent positive, negative, and neutral sentiments, in that order, whereas energy, uncertainty, and readmission were observed to be important in relation to the analysis of paper abstracts.
Table 6.
Central words associated with each sentiment network by centrality value
Fig. 3.
Central Words for Twitter Networks by Betweenness (X-axis), Closeness (Y-axis), Degree (Z-axis), and Eigenvector (Size) Centrality
Fig. 4.
Central Words for Abstract Networks by Betweenness (X-axis), Closeness (Y-axis), Degree (Z-axis), and Eigenvector (Size) Centrality
Conclusion and limitations
This study served two purposes. The first involved identifying how non-academics conceptualize the term financial risk in day-to-day communications and how academics use the term financial risk when communicating with colleagues in research papers. The second purpose involved evaluating sentiment indicators associated with the term financial risk in personal and scholarly communications. Based on a word frequency analysis using Twitter data from 2019, it was determined that, in general, key words were related to finance and business topics (e.g., management, market, and business). It appears that business discussions are often conceptualized in a way that frames the markets and the economy in a negative way. It is possible that those who use Twitter use the medium to express concerns related to certain activities. Twitter users may be looking for ways to share information about what they consider to be unsafe. After financial and business concepts, other words were found to be associated with digital and virtual markets (e.g., software, webinar, and blockchain) in daily conversations. This may mean that non-academics equate risk with the adoption and use of technologies. It could also mean that acceptance of digital and virtual products, services, and markets is thought to be risky. It was also determined, using ScienceDirect data from research paper abstracts published in 2019, that the term financial risk was associated with words representing various domains (e.g., system, chain, energy, and patient). It is likely that academics, when writing about risk, are more precise in their terminology than non-academics who communicate with others when using Twitter.
Based on results from the sentiment analysis, both non-academics and academics were found to be quite different in eliciting emotional responses in their communications. The term financial risk was mainly associated with negative emotions in daily conversations, whereas the term tended to be used in a positive way in research paper abstracts. Non-academics may feel that situations that involve uncertainty are conditions to be feared and that when financial risk is conceptualized in day-to-day communication, taking a financial risk involves anticipating the future, being fearful of potential outcomes, and needing to trust someone or something outside of one’s control. When viewed in the context of academic paper abstracts, academics appear to communicate about risk more positively. Overall, the term financial risk can be seen as something that non-academics must cope with on a daily basis, but like many aspects of daily life, financial risk evokes mixed emotional responses.
As an exploratory project, it is worth noting several limitations associated with this study. First, unlike the analysis of traditional data, analyzing words is difficult in that conventional statistical tools are often inadequate in terms of data management. The methods employed in this paper are, like all data mining techniques, based on nonlinear assumptions. It is possible that a more traditional methodological approach could generate conflicting results. Additionally, Twitter data may not be generally representative. More detailed screening procedures of data components (e.g., user information) should be considered in future studies to reduce possible bias from this issue. Finally, because the narrative data used in this study were obtained from a third party, the ability to create a truly random sample was limited. This means that the results, while noteworthy, are not necessarily generalizable.
Implications
The results from this study suggest that the way financial risk is conceptualized and used in daily practice differs from the definitional and academic application of financial risk in meaningful ways. Non-academics appear to use the term financial risk very loosely to describe situations that involve a degree of uncertainty and lack of transparency. Findings also show that the emotional context of the term financial risk between non-academics and academics is related to negative, positive, and neutral sentiments. In some respects, this indicates that non-academics understand that the presence of threats is not always negative or even hazardous. Taking financial risk, as illustrated in the Twitter posts, is sometimes communicated in a positive manner. This means that non-academics likely do understand the nuanced meanings of the term and phrase, but in general, non-academics tend to express a negative sentiment in relation to the concept of risk. It is, as such, important for researchers, educators, and policy makers to make a distinction between the academic application of the term financial risk and the day-to-day use of this term.
The findings from this study have direct implementable implications for those who are engaged in financial risk communication and education. It is no easy task to change risk perceptions or the manner in which a word like risk will elicit an emotional response. The stability of risk perceptions appears to be determined, in part, by the inelastic nature of strongly held beliefs (Slovic 1986). People are very slow to change belief patterns, even in the face of overwhelming evidence. Consider investments in stocks and other equities. Those who lived through and lost money during the Great Depression, the global financial crisis, and the COVID-19 pandemic may have come to believe that stocks and other equity investments are inherently risky, resulting in wealth losses and that the stock market acts like a game of chance. Even in the face of dramatic increases in stock values following the Great Depression, the global financial crisis, and the COVID-19 pandemic, many investors who had been negative affected by these events continued to perceive stocks as problematic assets in which to place savings—perceiving risk as a negative outcome. At the same time, there was a general perception held by many investors that fixed-income securities and federally insured bank/credit union products were “safe”. Those who acted on this belief over the period 2013 through 2020 found, in retrospect, that they had incurred significant opportunity costs as the value of stocks and other equities increased while yields on fixed-income and bank/credit union products remained flat or decreased.
Knowing that beliefs are difficult to change and that evidence that counters a deeply held perception will generally be considered erroneous, unrepresentative, or unreliable (Slovic 1986), those who are tasked with communicating about the positives and negatives associated with financial risk and financial risk taking need to find innovative ways to counteract the relative inelasticity of beliefs. One approach to risk communication and education that appears to offer some degree of success is formatting and visualization. Consider takeaways from prospect theory. The manner in which risks are presented—either positively or negatively—can shape patterns of behavior. In general, when risks are presented in the gain domain, nearly all decision makers exhibit degrees of risk aversion. When the same risks are presented in the loss domain, many of the same decision makers shift their preference to risk seeking. Additionally, Lichtenstein et al. (1978) advocated the use of statistical displays as a way to combat deeply held beliefs. Rather than present data in nominal terms, evidence suggests that fear and trepidation can be reduced when event outcome data are shown as a comparison. While it is true that risk means different things to different people (Lichtenstein et al. 1978), it is also true that when people believe they can control risk or the outcomes associated with a risky situation, the perception of negative outcomes associated with engagement in a risky activity falls (Simon et al. 1999). This is the primary reason that visualizations and data presentations work well in shifting the emotional context of risk. That is, once a decision maker comes to understand the true dimensions of a risky situation, it becomes easier for the decision maker to feel more in control of their situation. The adage that it is safer to fly than it is to drive to the airport is an applied example of a risk comparison that helps reduce the fear of flying.5The k-core is the maximal connected subgraph which has minimum degree greater than or equal to k.
Although exploratory, this study is noteworthy in being one of the first rigorous analytical attempts to examine how the term financial risk is used in practice by non-academics and academics, and to link an emotional context around this term using online media and publication data. This study provides documentation for what researchers have often assumed: non-academics evaluate, conceptualize, and communicate about risk through personal channels using user generated definitions rather than scientifically generated definitions. As shown in this study, gaining a better understanding of the use and emotional context of risk is one way to help educators, researchers, and policy makers develop tools and techniques that can enhance risk communication and education. Big data methodologies will continue to open up new pathways to better understand day-to-day emotions, human behavior, and cognitions. The use of these types of methodologies in the future can help provide additional insights into the perceptions and preferences of those who communicate about risk-taking topics.
Appendix
See Figs. 5, 6, 7, 8, 9 and 10.
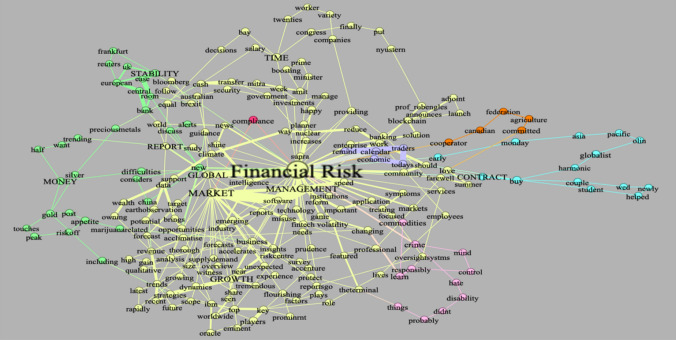
Fig. 5.
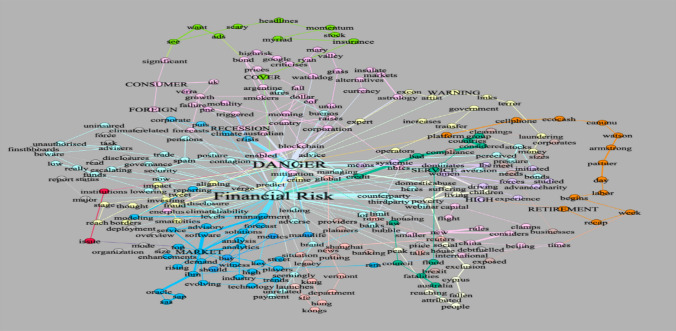
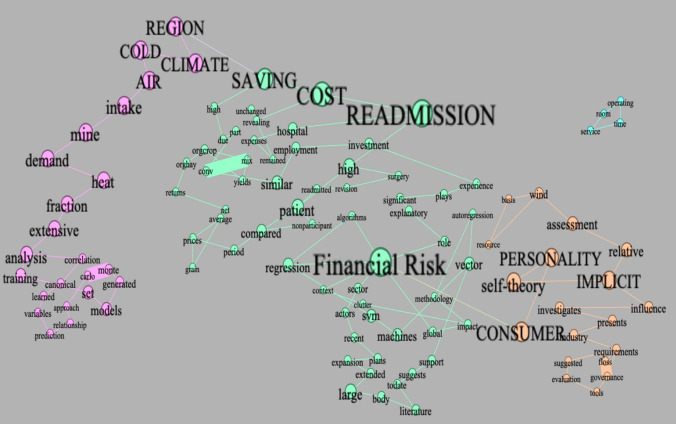
Undirected Semantic Network for Positive Sentiment from Twitter Messages (k-core = 2) Note: The node size represents betweenness centrality, and the thickness of the edge represents weighted degrees. The top 10 between centrality words are capitalized in figures
Fig. 6.
Undirected Semantic Network for Negative Sentiment from Twitter Messages (k-core = 2)
Fig. 7.
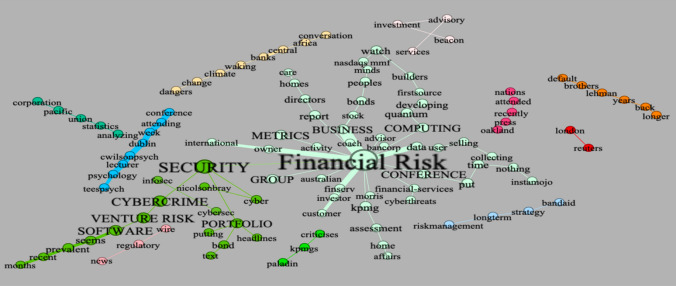
Undirected Semantic Network for Neutral Sentiment from Twitter Messages
Fig. 8.
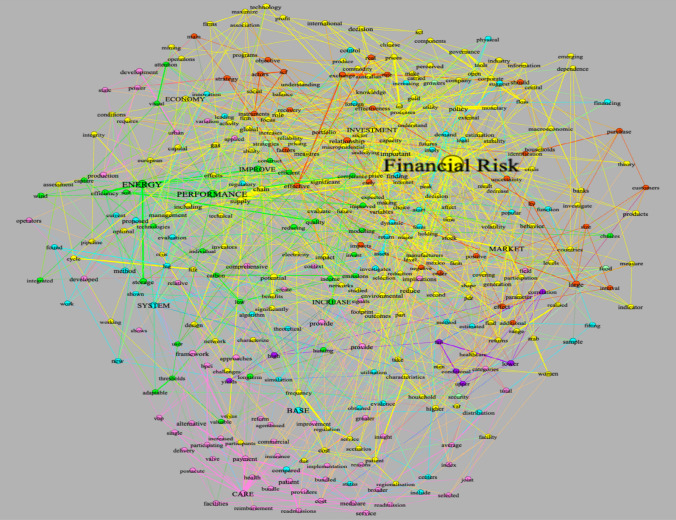
Undirected Semantic Network for Positive Sentiment from Paper Abstracts (k-core = 4)
Fig. 9.
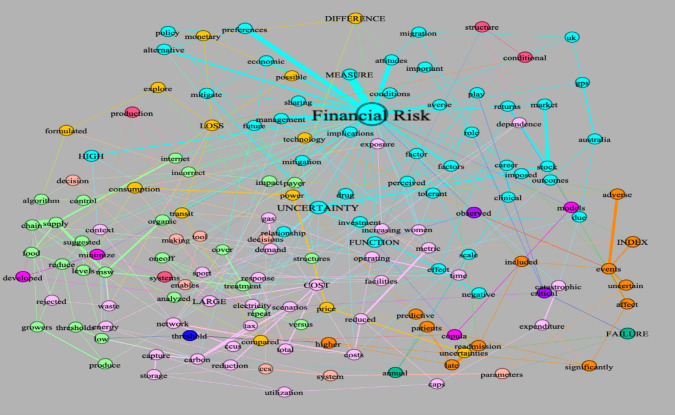
Undirected Semantic Network for Negative Sentiment from Paper Abstracts (k-core = 3)
Fig. 10.
Undirected Semantic Network for Neutral Sentiment from Paper Abstracts
Funding
This study was not funded by a grant.
Code availability
The codes that support the findings of this study are available from the corresponding authors upon the reasonable request.
Compliance with ethical standards
Conflicts of interest
The authors declare that they have no conflict of interest.
Availability of data and material
The datasets generated during and/or analyzed during the current study are available from the corresponding author on reasonable request.
Footnotes
In finance, risk is often used to describe the variance in returns of an investment.
A function word is a term used mainly for expressing relationships between other words in a sentence. For example, a conjunction like “but” or a preposition like “with” are considered function words (MacMillan Dictionary, n.d.). A word whose primary purpose is to contribute to the syntax of sentence rather than the meaning of a sentence is also considered a function word (Oxford English Dictionary, n.d.).
A stop word (i.e., usually one of a set of words most frequently occurring in a language or text) is one that is automatically omitted from or treated less fully in a computer-generated concordance or index (Oxford English Dictionary, n.d.; http://sentiment.nrc.ca/lexicons-for-research/).
Given that, word embedding models (e.g., Word2Vec, Glove, etc.) that use a neural net approach to construct word vectors were not conducted for the sentiment analysis of this study.
The k-core is the maximal connected subgraph which has minimum degree greater than or equal to k.
Publisher's Note
Springer Nature remains neutral with regard to jurisdictional claims in published maps and institutional affiliations.
Contributor Information
Eun Jin Kwak, Email: eunjin.kwak@uga.edu.
John E. Grable, Email: grable@uga.edu
References
- Das K, Samanta S, Pal M. Study on centrality measures in social network: a survey. Soc Netw Anal Min. 2018;8:13. doi: 10.1007/s13278-018-0493-2. [DOI] [Google Scholar]
- Direger P. Semantic network analysis as a method for visual text analytics. Procedia-Soc Behav Sci. 2013;79(6):4–17. doi: 10.1016/j.sbspro.2013.05.053. [DOI] [Google Scholar]
- Everett MG. Classical algorithms for social network analysis: future and current trends. In: Alhajj R, Rokne J, editors. Encyclopedia of social network analysis and mining. New York: Springer; 2018. pp. 193–199. [Google Scholar]
- Evert S (2005) The statistics of word cooccurrences: word pairs and collocations. (Unpublished doctoral dissertation) University of Stuttgart. https://elib.uni-stuttgart.de/bitstream/11682/2573/1/Evert2005phd.pdf
- Girvan M, Newman MEJ. Community structure in social and biological networks. Proc Natl Acad Sci USA. 2002;99(12):7821–7826. doi: 10.1073/pnas.122653799. [DOI] [PMC free article] [PubMed] [Google Scholar]
- Ibarra H, Andrews SB. Power, social influence, and sense making: effects of network centrality and proximity on employee perceptions. Adm Sci Q. 1993;38(2):277–303. doi: 10.2307/2393414. [DOI] [Google Scholar]
- Ji X, Chun SA, Geller WZ, J, Twitter sentiment classification for measuring public health concerns. Soc Netw Anal Min. 2015;5:13. doi: 10.1007/s13278-015-0253-5. [DOI] [PMC free article] [PubMed] [Google Scholar]
- Jockers M (2017) Extracts sentiment and sentiment-derived plot arcs from text. https://cran.r-project.org/web/packages/syuzhet/index.html
- Journal of the Medical Library Association (2013) SciVerse Science Direct. https://www.ncbi.nlm.nih.gov/pmc/articles/PMC3634388/ Accessed 20 Oct 2020
- Kang GJ, Ewing-Nelson SR, Mackey L, Schlitt JT, Marathe A, Abbas KM, Swarup S. Semantic network analysis of vaccine sentiment in online social media. Vaccine. 2017;35(29):3621–3638. doi: 10.1016/j.vaccine.2017.05.052. [DOI] [PMC free article] [PubMed] [Google Scholar]
- Lichtenstein S, Slovic P, Fischhoff B, Layman M, Combs B. Judged frequency of lethal events. J Exp Psychol: Hum Learn Mem. 1978;4:551–578. [PubMed] [Google Scholar]
- Liu B. Sentiment analysis and opinion mining. Synth Lect Hum Lang Technol. 2012;5(1):1–167. doi: 10.2200/S00416ED1V01Y201204HLT016. [DOI] [Google Scholar]
- McMillan Dictionary (n.d.) Risk: definition and synonyms. https://www.macmillandictionary.com/us/dictionary/american/risk_1.Accessed 13 Sep 2020
- Messias J, Diniz JP, Soares E, et al. An evaluation of sentiment analysis for mobile devices. Soc Netw Anal Min. 2017;7:20. doi: 10.1007/s13278-017-0437-2. [DOI] [Google Scholar]
- Meyer D, Hornik K, Feinerer I. Text mining infrastructure in R. J Stat Softw. 2008;25(5):1–54. [Google Scholar]
- Newman MEJ, Girvan M. Finding and evaluating community structure in networks. Phys Rev E Stat Nonlin Soft Matter Phys. 2004;69:026113. doi: 10.1103/PhysRevE.69.026113. [DOI] [PubMed] [Google Scholar]
- Simon M, Houghton SM, Aquino K. Cognitive biases, risk perception, and venture formation: how individuals decide to start companies. J Bus Ventur. 1999;15:113–134. doi: 10.1016/S0883-9026(98)00003-2. [DOI] [Google Scholar]
- Slovic P. Informing and educating the public about risk. Risk Anal. 1986;6:403–415. doi: 10.1007/978-3-642-83074-7. [DOI] [PubMed] [Google Scholar]
- Statista (2019) Twitter-statistics and facts. https://www.statista.com/topics/737/twitter/ Accessed 13 Sep 2020
Associated Data
This section collects any data citations, data availability statements, or supplementary materials included in this article.
Data Availability Statement
The codes that support the findings of this study are available from the corresponding authors upon the reasonable request.


