Carbohydrates are the most abundant macromolecules on our planet, in part because of the plant carbohydrates cellulose and starch, both composed of multiple conjugated glucose molecules. Cellulose is an important structural element of plant cell walls. Animals lack enzymes that can break down the cellulose into smaller glucose molecules, but they can break down starch into smaller glucose molecules. Animals also have glycogen, another carbohydrate composed of multiple conjugated glucose molecules. Many of us who exercise or play sports know that carbohydrates serve as a really good source of fuel during these strenuous endeavors. Unfortunately, most of us realize that overconsumption of carbohydrates can easily help us put on weight under nonexercise conditions. So, we know that carbohydrates can either be catabolized for energy (ATP) or used for anabolic functions, such as production of fatty acids.
Carbohydrates are divided into three major groups based on their structures: (1) simple sugars (monosaccharides and disaccharides), such as glucose or sucrose (glucose and fructose); (2) complex carbohydrates, such as glycogen, starch, and cellulose, which are multiple conjugated glucose molecules; and (3) glycoconjugates, which are modified forms of glucose covalently attached to either proteins (glycoproteins) or lipids (glycolipids), which participate in important functions, such as immunity, and as components of cell membranes. This review covers all three groups and highlights their importance in maintaining physiological functions.
QUICK GUIDE TO CARBOHYDRATES
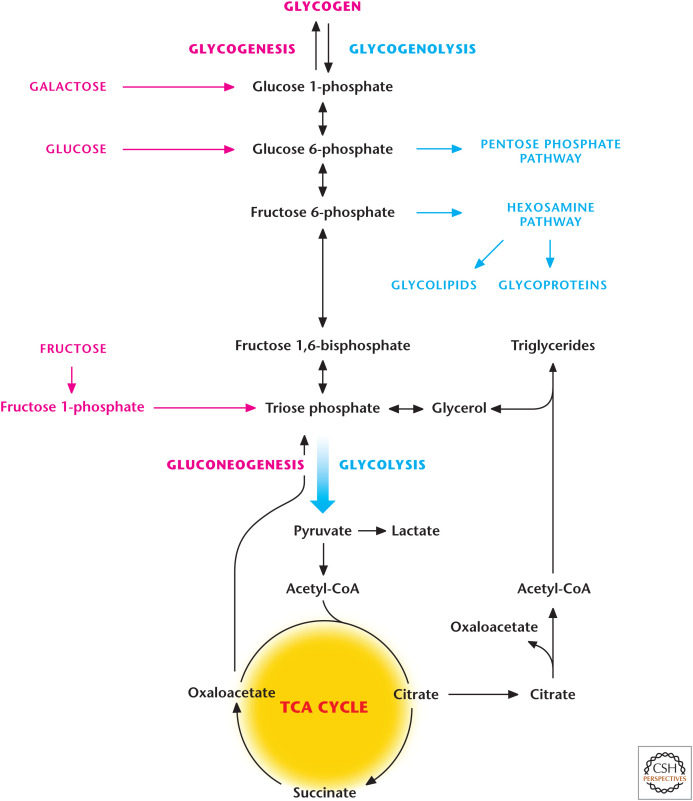
Simple sugars, such as glucose, fructose, and galactose, can enter glycolysis (see Chandel 2020a).
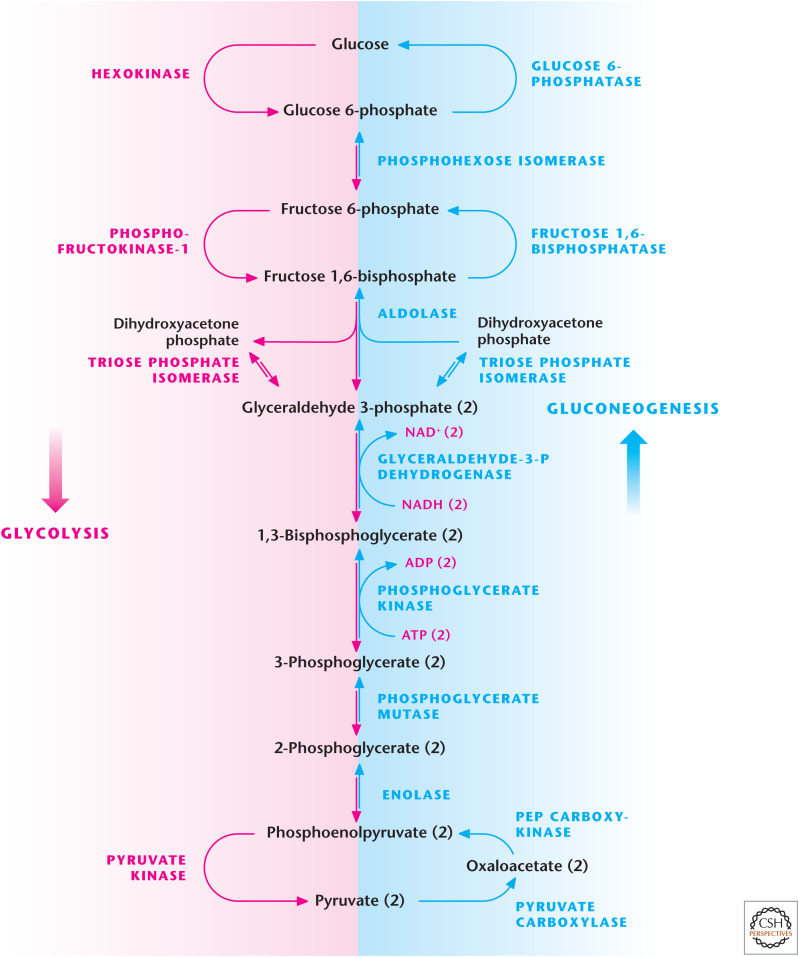
Gluconeogenesis begins with mitochondrial oxaloacetate being converted to phosphoenolpyruvate (PEP) by either mitochondrial or cytosolic phosphoenolpyruvate carboxykinase (PEPCK) (Fig. 1).
Glycerol, alanine, lactate, and glutamine are the major substrates for gluconeogenesis.
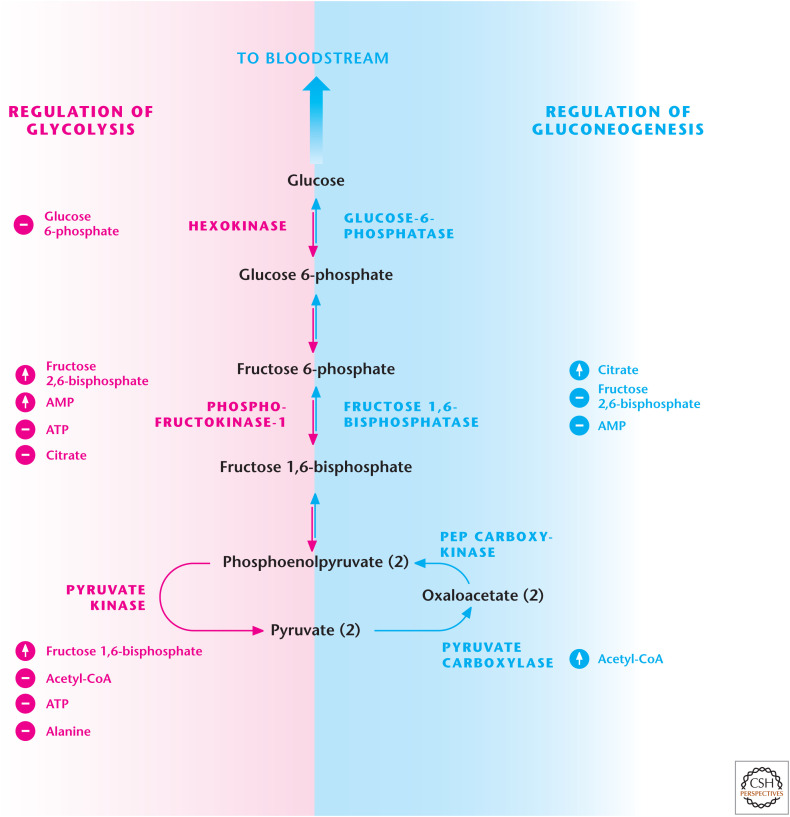
There are three irreversible steps in glycolysis (hexokinase, phosphofructokinase-1 [PFK1], and pyruvate kinase) that are bypassed by enzymes specific to gluconeogenesis (glucose 6-phosphatase, fructose 1, 6-bisphosphatase, and phosphoenolpyruvate carboxykinase). All the enzymes that catalyze the reversible steps in glycolysis are used by gluconeogenesis.
Glycogen can be degraded to glucose 1-phosphate to enter glycolysis (i.e., glycogenolysis). Conversely, glucose molecules can be converted into glucose 1-phosphate to generate glycogen (i.e., glycogenesis).
Modified versions of glucose generated by the hexosamine pathway can modify proteins (i.e., glycoproteins) to change the activity or stability of proteins, thus linking glucose metabolism to cellular signaling.
Figure 1.
Overview of carbohydrate metabolism. Simple sugars, such as glucose, fructose, or galactose, have different points of entry into glycolysis. A process referred to as gluconeogenesis can also generate glucose. Complex carbohydrates such as glycogen can also enter glycolysis. The hexosamine pathway generates glycoproteins and glycolipids, which are modified forms of glucose covalently attached to either proteins (glycoproteins) or lipids (glycolipids), that participate in important functions in signaling and as components of cell membranes.
METABOLISM OF SIMPLE SUGARS
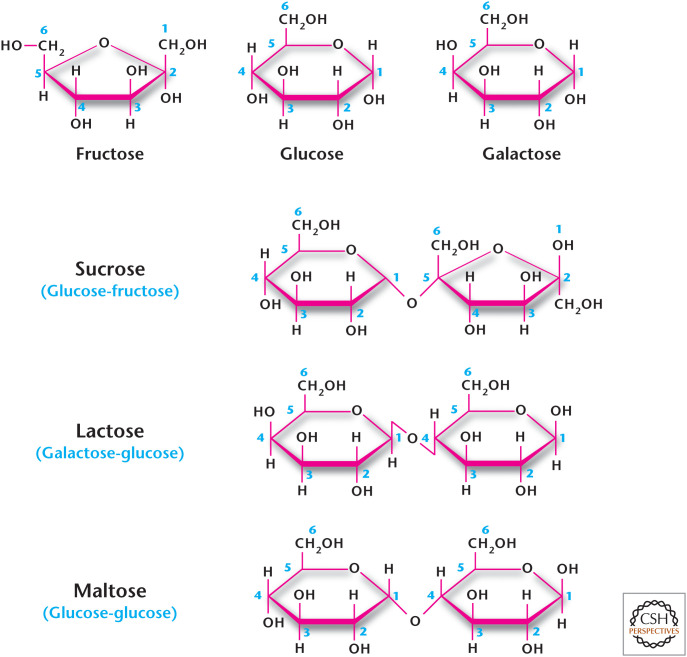
The Greek word “sakcharon” means sugar, and we use the word saccharide to denote a sugar. Simple sugars are monosaccharides, such as glucose, galactose or fructose; the disaccharides include lactose (galactose and glucose, milk sugar, sucrose (glucose and fructose, table sugar), and maltose (glucose and glucose) (Fig. 2). Sucrase and lactase are enzymes that break down sucrose and lactose into their monosaccharides, respectively (Fig. 2). Many adults are unable to metabolize lactose (i.e., they are lactose intolerant) usually because of diminished levels of the enzyme lactase. Certain bacteria in the colon use lactose as a source of fuel and, in the process, generate methane (CH4) and hydrogen gas (H2), which cause discomfort in the gut and the embarrassing problem of flatulence.
Figure 2.
Monosaccharide and disaccharide structures.
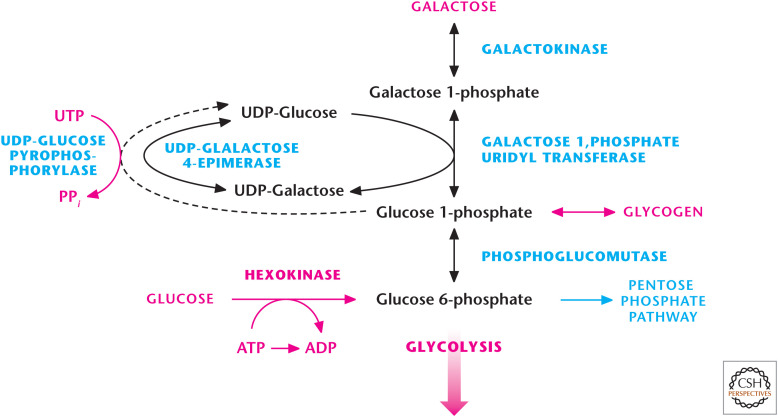
Simple sugars have different levels of sweetness in mammals. The sensation of sweetness is based on sugars binding to G-protein-coupled receptors expressed on the surface of taste cells (gustatory cells) on our tongues, which stimulate a neuronal signal to brain. The differential affinity of sugars to the G-protein-coupled receptors in these cells determines the perceived sweetness. For example, fructose is sweeter than glucose, making certain fructose-based drinks addictive. Moreover, the metabolic fate of these sugars can be quite diverse. Glucose, galactose, and fructose enter glycolysis through different routes (Figs. 3 and 4). Glucose becomes glucose 6-phosphate by an ATP-dependent reaction, using hexokinases (see Chandel 2020a). Galactose enters through the Leloir pathway, in which galactokinase uses ATP to generate galactose 1-phosphate, which is converted to glucose 1-phosphate and, subsequently, to glucose 6-phosphate by the enzymes galactose-1-P-uridyl transferase and phosphoglucomutase, respectively. In the liver, glucose 6-phosphate can be converted to glucose, whereas, in other tissues, it is metabolized through glycolysis. The conversion of galactose to glucose 6-phosphate is slower than the rate by which glucose becomes glucose 6-phosphate. In proliferating cells, the replacement of glucose with galactose in vitro results in the galactose preferentially entering the pentose phosphate pathway (PPP) because mitochondrial oxidative phosphorylation provides ATP and the need for ribose 5-phosphate provided by the PPP is important for proliferation. In cells with mitochondrial oxidative phosphorylation defects, galactose metabolism through glycolysis is too slow to generate enough ATP to meet metabolic demands, resulting in metabolic catastrophe and cell death. Mitochondrial biologists use galactose sensitivity to determine whether a genetic mutation or pharmacologic inhibitor is suppressing oxidative phosphorylation.
Figure 3.
Galactose catabolism occurs through the Leloir pathway. The Argentine Luis Federico Leloir, who received the 1970 Nobel Prize in Chemistry, discovered galactose catabolism. Galactokinase converts galactose into galactose 1-phosphate, which subsequently becomes glucose 1-phosphate, which can either be stored as glycogen or enter glycolysis by being converted into glucose 6-phosphate.
Figure 4.
Fructose metabolism. Fructokinase converts fructose into fructose 1-phosphate, which subsequently is converted into glyceraldehyde and dihydroxyacetone phosphate by aldolase B that enters glycolysis. A key feature of fructose metabolism is that it bypasses the major regulatory step in glycolysis, the PFK1-catalyzed reaction.
Fructose is primarily metabolized by the liver and, to a lesser extent, by the small intestine and kidney. The first step is the phosphorylation of fructose to fructose 1-phosphate by fructokinase. Subsequently, fructose 1-phosphate is cleaved into glyceraldehyde and dihydroxyacetone phosphate by a specific fructose 1-phosphate aldolase B (Fig. 4). Glyceraldehyde is then phosphorylated to glyceraldehyde 3-phosphate, a glycolytic intermediate, by triose kinase. The glycolytic intermediates generated can either proceed through glycolysis and its subsidiary biosynthetic reactions, including generation of fatty acids or storage as glycogen. At first glance, it seems that fructose metabolism eventually mirrors glucose metabolism; however, fructose enters glycolysis after the important regulatory step of PFK1 in glycolysis. At the end of this review, we will discuss how high consumption of fructose through bypassing this regulatory step is linked to the alarming obesity epidemic.
GLUCONEOGENESIS MAINTAINS BLOOD GLUCOSE LEVELS
The maintenance of glucose levels around 5.5 mm in the blood is critical. Blood glucose levels are maintained by gluconeogenesis and glycogenolysis. Any drop in these levels—hypoglycemia—can impair brain function, resulting in dizziness and unconsciousness. Too-high glucose levels in the blood—hyperglycemia—can also be detrimental because this condition is linked to diabetes. The widely used antidiabetic drug, metformin, diminishes hyperglycemia by reducing hepatic gluconeogenesis. Thus, proper maintenance of glucose levels is critical to our health. At the cellular level, liver and kidney cells can generate glucose either by converting stored glycogen in the liver into glucose or synthesizing new glucose molecules (gluconeogenesis) to maintain blood glucose levels (Fig. 5). It is important to note that many cells, including tumor cells, can use their stored glycogen to generate glucose to fuel glycolysis and its subsidiary pathways. Cells can also initiate gluconeogenesis to generate glycolytic intermediates that can go into subsidiary pathways, if needed, to generate macromolecules, such as lipids.
Figure 5.
Gluconeogenesis. Glycolysis and gluconeogenesis share many enzymes; however, there are three irreversible reactions in glycolysis that have to be bypassed so that gluconeogenesis can ensue. The first reaction is the generation of PEP from pyruvate requiring pyruvate carboxylase and PEP carboxykinase. The second reaction is the conversion of fructose 1,6-bisphosphate to fructose 6-phosphate by F-1,6-BPase. The third reaction is the conversion of glucose 6-phosphate to glucose by glucose 6-phosphatase.
Gluconeogenesis primarily occurs in the liver and, to a lesser degree, in the kidney, in which the newly synthesized glucose is exported into circulating blood to provide glucose to vital organs, such as the brain, as well as red blood cells that derive their ATP solely from glucose-dependent glycolysis. Gluconeogenesis reactions occur both in the mitochondrial matrix and cytosol. In mammals, important sources that provide the carbons for gluconeogenesis are lactate, glycerol, and the amino acids alanine and glutamine. Lactate is generated by muscle and transported to the liver, in which it is converted into pyruvate to enter the gluconeogenesis. This is referred to as the Cori cycle (see Box 1).
BOX 1.
THE LEGACY OF CORI LABORATORY
Carl (1896–1984) and Gerty Cori (1896–1957) began their scientific partnership during their years as medical school students in Prague in the early 20th century. After a stint serving in the Austrian Army during World War I, Carl finished medical school, as did Gerty, in 1920, and they married soon after. After their marriage, Carl spent a year at the University of Vienna and with Otto Loewi at the University of Graz. Gerty, who had been born Jewish, stayed in Vienna at the Children's Hospital and began her research there. The fear of anti-Semitism convinced them that they needed to leave Europe. The United States was their goal, but they also applied to serve the Dutch government as doctors in Java. A position as biochemist at the New York Institute for the Study of Malignant Diseases (later the Roswell Park Cancer Institute) came through for Carl in 1922, but only a lesser position was available for Gerty in the Pathology Laboratory. The Coris were determined to work together, and even when Gerty was threatened with losing her job “unless she stayed in her room and stopped working with Carl” they persevered. The trajectory of their research began here with the demonstration of the Warburg effect, showing that tumors added lactate to the bloodstream. Next was the groundbreaking work that resulted in the delineation of the Cori cycle of carbohydrates, with the Coris showing, experimentally, that lactic acid was the key element in the cycle of glycogen from the liver to muscle and back again. During this time, Carl was offered a better position at a nearby institution, but was told he could not work with Gerty if he took the position because it “was un-American for a man to work with his wife.”
In 1931, Carl was offered the Chairmanship of the Pharmacology Department at Washington University in St. Louis. Again, Gerty was forced to take a backseat, as there was a proscription against two members of the same family holding faculty positions. So, she was taken on, essentially, as a postdoc with the title of research associate at one-tenth the salary as that of her husband. Their exploration of glucose and glycogen metabolism continued here with the isolation of glucose 1-phosphate (the Cori ester), establishment of the enzymatic pathways of glycogenolysis and glycolysis, and crystallization and regulation of phosphorylase.
Gerty did not gain a full professorship until 1947, the year that she and Carl received the Nobel Prize in Physiology or Medicine (shared with Bernardo Houssay) “for their discovery of the course of the catalytic conversion of glycogen.” Carl attributed their achievements to their efforts being “largely complementary” and saying that “one with the other would not have gone as far as in combination.” She was the first American woman to win a Nobel Prize in science and the first woman to win one in Physiology or Medicine. Gerty died at a relatively young age from a bone marrow disorder, possibly a result of her early exposure to X rays while studying their effect on skin and organ metabolism. In 2008, the United States Postal Service released a stamp honoring Gerty, but ironically the stamp had a small error in the structure of the Cori ester that the Coris had worked so hard to determine.
Their approach to research was to put forth extraordinary ideas and then design a precise research method and analytic means to test these ideas. Remarkably, among the students, postdocs, and research associates in their St. Louis laboratory were at least six future Nobelists: Christian de Duve (1974), Arthur Kornberg (1959), Luis F. Leloir (1970), Severo Ochoa (1959), Earl W. Sutherland (1971), and Edwin G. Krebs (1992). The Cori's identification of the “PR enzyme” in the conversion of phosphorylase a to phosphorylase b was later found to be the first protein phosphatase to be identified (PP1 of the PPP phosphatase family). This discovery led to Edmond Fischer and Edwin G. Krebs showing that the phosphorylase b to phosphorylase a conversion involved phosphorylation, which turned out to be a broader method for regulating protein function.
As discussed in Chandel (2020a), there are three irreversible steps in glycolysis. These steps have to be bypassed for gluconeogenesis to proceed. The first step is the generation of PEP from pyruvate (Fig. 6). Pyruvate in the mitochondrial matrix is converted into oxaloacetate by the enzyme pyruvate carboxylase. This enzyme requires biotin as a cofactor and bicarbonate (HCO3) as a substrate. The reaction is thermodynamically unfavorable and coupled to the Gibbs free energy provided by converting ATP to ADP. Acetyl-CoA is a positive allosteric regulator of pyruvate carboxylase. Therefore, if acetyl-CoA levels increase, then acetyl-CoA stimulates pyruvate carboxylase to generate oxaloacetate, and these two metabolites could make citrate to initiate TCA cycle. However, if the liver cells' energy charge is not low, they can convert the oxaloacetate into PEP by PEPCK by coupling this reaction to the conversion of GTP to GDP (Fig. 6).
Figure 6.
Pyruvate conversion into PEP.
Human liver cells have two distinct PEPCK genes that encode cytosolic and mitochondrial matrix enzymes. Gluconeogenic amino acid alanine is converted into pyruvate and uses the cytosolic PEPCK, which converts cytosolic oxaloacetate to generate PEP (Fig. 7). In this pathway, the pyruvate in the mitochondria is converted into mitochondrial oxaloacetate by pyruvate carboxylase. Mitochondria do not have a mechanism to transport oxaloacetate. Thus, oxaloacetate must be converted into malate, which can be transported into the cytosol. This reaction is catalyzed by mitochondrial malate dehydrogenase 2. Subsequently, cytosolic malate dehydrogenase 1 (MDH1) oxidizes malate into cytosolic oxaloacetate by coupling to NAD+ reduction to NADH. Once PEP is generated, it uses most of the glycolytic enzymes to eventually become glucose. The NADH generated by malate dehydrogenase 1 is used by glyceraldehyde 3-phosphate dehydrogenase (GAPDH) to convert 1,3-bisphosphoglycerate into glyceraldehyde 3-phosphate.
Figure 7.
Multiple substrates feed into gluconeogenesis. Alanine, lactate, glycerol, and glutamine can generate glucose. Glycerol enters gluconeogenesis through conversion into dihydroxyacetone phosphate (DHAP), a reaction catalyzed by glycerol 3-phosphate dehydrogenase. Alanine, lactate, and glutamine have to be converted into oxaloacetate, which enters gluconeogenesis through conversion into PEP by phosphoenolpyruvate carboxykinase.
Lactate generated by muscle is also used as a gluconeogenic substrate through conversion into pyruvate. The enzyme lactate dehydrogenase converts lactate into pyruvate by coupling to NAD+ conversion to NADH. Pyruvate becomes oxaloacetate by pyruvate carboxylase (PC). Oxaloacetate is converted into PEP in the mitochondrial matrix by PEPCK2 and, subsequently, is transported into the cytosol to enter gluconeogenesis. Note that oxaloacetate is not converted into malate in the mitochondria by malate dehydrogenase 2 (MDH2) and thus is not transported into the cytosol, in which it would be converted back into oxaloacetate through coupling the reaction with the conversion of NAD+ to NADH. The generation of lactate from pyruvate already generates NADH in the cytosol needed for GAPDH reaction, thus alleviating the necessity of malate shuttling out of the mitochondria to generate NADH.
Once PEP goes through reverse glycolysis, there are two steps of glycolysis that are not reversible: those catalyzed by PFK1 and hexokinase. The corresponding enzymes that catalyze the reverse reactions are fructose 1,6-bisphosphatase(F-1, 6-BPase) and glucose 6-phosphatase, respectively (Fig. 5). Glycerol can also contribute to gluconeogenesis by the conversion of glycerol to glycerol 3-phosphate by glycerol kinase. Subsequently, glycerol 3-phosphate becomes the glycolytic intermediate dihydroxyacetone phosphate by mitochondrial glycerol 3-phosphate dehydrogenase. Dihydroxyacetone phosphate is converted into glyceraldehyde 3-phosphate, which eventually becomes glucose.
Gluconeogenesis is an endergonic process (requires energy) when glycerol, alanine, and lactate are substrates. Glycerol, alanine, and lactate entry does not generate ATP. Moreover, the conversion of pyruvate to oxaloacetate uses ATP and gluconeogenesis, through reversal of glycolytic steps, also consumes ATP (Fig. 7). However, glutamine gluconeogenesis is unique in that it represents an exergonic reaction. Glutamine through glutaminolysis (see Chandel 2020b) becomes α-ketoglutarate, which goes through the TCA cycle to ultimately produce malate, which shuttles into the cytosol to enter gluconeogenesis. Entry of glutamine into the TCA cycle generates GTP, NADH, and FADH2 in the mitochondrial matrix that produces ATP to drive gluconeogenesis in the cytosol.
REGULATION OF GLUCONEOGENESIS
It is important to realize that gluconeogenesis is a tightly regulated pathway that does not allow cells to simultaneously conduct glucose degradation by glycolysis and glucose synthesis by gluconeogenesis. There is reciprocal control of these pathways to prevent a futile cycle (Fig. 8). A key regulatory step is how PFK1 and F-1,6-BPase are reciprocally regulated by AMP, citrate, and fructose 2,6-bisphosphate (F-2,6-BP). If the energy charge decreases in cells, then AMP levels increase, leading to PFK1 activation (increasing glycolytic flux) and inhibition of F-1,6-BPase (decreasing gluconeogenic flux). In contrast, if citrate levels build up in the cytosol because the TCA cycle is backed up, then glycolytic flux is reduced through citrate inhibition of PFK1. Simultaneously, gluconeogenic flux is increased through citrate activation of F-1,6-BPase. The third metabolite and most potent allosteric regulator of glycolysis and gluconeogenesis is F-2,6-BP, which is generated by phosphofructokinase-2 (PFK2) and degraded by fructose 2,6-bisphosphatase (F-2,6-BPase). F-2,6-BP activates PFK1 and inhibits F-1,6-BPase. A single protein contains both PFK2 and F-2,6-BPase activities. The interconversion of PFK2 and F-2,6-BPase is achieved by cAMP-dependent protein kinase A (PKA) phosphorylation of PFK2 to produce F-2,6-BPase. Thus, stimuli that increase cAMP, such as the hormone glucagon, promote gluconeogenesis (see Box 2).
Figure 8.
Reciprocal regulation of glycolysis and gluconeogenesis. PFK1 and fructose 1,6-bisphosphate (F-2,6-BPase) are key regulatory enzymes in glycolysis and gluconeogenesis, respectively. AMP and F-2,6-BP activate PFK1 and inhibit F-2,6-BPase.
BOX 2.
MAINTAINING GLUCOSE HOMEOSTASIS DURING FED–FAST CYCLE
The fed–fast cycle starts nightly after our evening meals (fed state) followed by nightly sleep (fast state). Throughout this cycle, blood glucose levels have to be maintained. The cycle has fluctuations in metabolic hormones insulin and glucagon, which help maintain blood glucose levels. After a meal, the increase in glucose levels quickly triggers secretion of insulin by the pancreas, which suppresses liver gluconeogenesis. Insulin activates glycogen synthase and inactivates glycogen phosphorylase, resulting in liver glycogen synthesis. Insulin also stimulates glucose uptake in the muscle and adipose tissue for storage. Collectively, these actions of insulin lower blood glucose levels. Several hours after a meal, the blood glucose levels begin to decrease, leading to a decrease in insulin secretion and an increase in glucagon secretion from the pancreas. The decrease in insulin levels diminishes uptake of glucose by muscle and adipose tissue, contributing to the maintenance of the blood glucose level. Glucagon prevents glycogen synthesis and stimulates glycogen breakdown in the liver by activating glycogen phosphorylase and inactivating glycogen synthase. In addition, glucagon increases the production of cAMP to activate PKA, which converts PFK2 to F-2,6-BPase to suppress glycolysis and stimulate gluconeogenesis in the liver. Once we wake up and eat breakfast, glucagon levels rapidly diminish and insulin levels increase, causing cAMP to be degraded and PKA to be inactivated. This causes the conversion of F-2,6-BPase to PFK2 to activate PFK1 to stimulate glycolysis and inhibit F-1,6-BPase to repress gluconeogenesis. Thus, hormonal control of F-2,6-BP rapidly regulates glycolysis and gluconeogenesis.
GLYCOGEN SYNTHESIS AND DEGRADATION MAINTAINS GLUCOSE HOMEOSTASIS
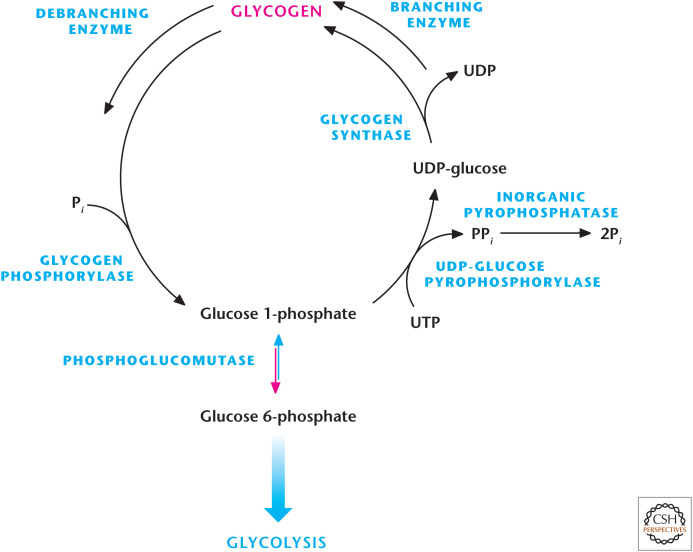
Glycogen is a large, highly branched polysaccharide consisting of individual glucose molecules joined by α-(1,4) and α-(1,6) glycosidic bonds. Glycogen is degraded and synthesized in the cytosol, notably in liver and muscle cells, but also in other cells, including tumor cells and cells in the retina. The key enzymes are glycogen synthase, glycogen phosphorylase, and branching/debranching enzymes. Glycogen synthesis from glucose is performed by the enzyme glycogen synthase, which uses UDP-glucose and glycogen as substrates. The enzyme UDP-glucose pyrophosphorylase exchanges the phosphate on C-1 of glucose 1-phosphate for UDP to generate UDP-glucose. The energy of the phospho–glycosyl bond of UDP-glucose is used by glycogen synthase to catalyze the incorporation of glucose into glycogen (Fig. 9). UDP is, subsequently, released from the enzyme. The α-1,6 branches in glucose are produced by amylo-(1,4–1,6)-transglycosylase, also termed the branching enzyme.
Figure 9.
Glycogen metabolism. Glycogen phosphorylase breaks down glycogen into glucose 1-phosphate, whereas glycogen synthase synthesizes glucose 1-phosphate molecules into glycogen. Glucose 1-phosphate can be interconverted into glucose 6-phosphate by phosphoglucomutase.
Glycogen phosphorylase degrades stored glycogen by the process of glycogenolysis. Single glucose residues are removed phosphorolytically from α-(1,4)-linkages within the glycogen, generating the product glucose 1-phosphate. Glycogen phosphorylase cannot remove glucose residues from the branch points (α-(1,6) linkages) in glycogen, thus, requiring debranching enzymes. The phosphorylated form of glucose removed from glycogen does not require ATP hydrolysis, and the equilibrium of the reaction is favorably driven by the high concentration of Pi in cells. Subsequently, the glucose 1-phosphate is converted into glucose 6-phosphate, which can either precede glycolysis or the PPP, by phosphoglucomutase (Fig. 9). The release of a phosphorylated glucose molecule from glycogen also ensures that the glucose residue does not freely diffuse from cells. This is particularly important in muscle cells, in which the glucose residues generated from glycogenolysis is needed to proceed through glycolysis for ATP generation. Muscle cells lack glucose 6-phosphatase, thus glucose 6-phosphate cannot be generated into free glucose molecules. In contrast, liver contains glucose 6-phosphatase, thus, allowing glucose 6-phosphate molecules generated from glycogen into free glucose to maintain blood glucose levels.
INTERSECTION OF CARBOHYDRATES AND SIGNALING
Carbohydrates can also play an important role in signaling by posttranslationally modifying proteins. A number of oligosaccharides (glycans) attach covalently to a protein to alter protein stability and activity; these constructs are referred to as glycoproteins. The linkage of proteins to carbohydrates in glycoproteins is through either a N-glycosidic bond or O-glycosidic bond. The N-glycosidic linkage is through the amide group of asparagine to N-acetylglucosamine (GlcNAc). The O-glycosidic linkage is to the hydroxyl of threonine, serine, or hydroxylysine. The most common linkage to threonine or serine is N-acetylgalactosamine (GalNAc) by O-GlcNAc transferase (OGT). This modification occurs in the endoplasmic reticulum and Golgi apparatus. Many membrane-bound and secreted proteins are glycoproteins. These include many of the cell-surface receptors of the immune system, hormones, such as erythropoietin, and the mucins, which are secreted in the mucus of the respiratory and digestive systems. The predominant sugars found in glycoproteins are glucose, galactose, fucose, mannose, N-acetylneuraminic acid, GalNAc, and GlcNAc.
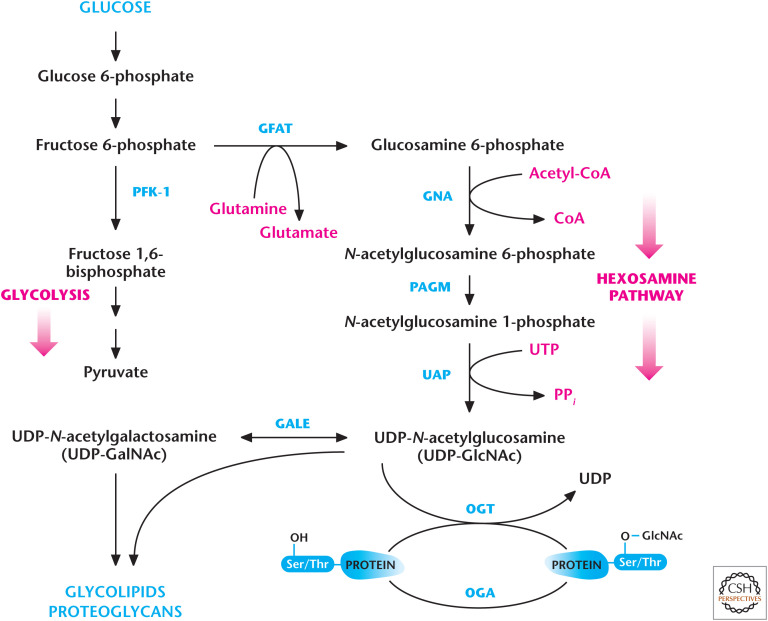
The details of all these different modifications are beyond the scope of this book. However, one important modification worth examining is the O-GlcNAc modification because it is regulated by glucose metabolism. As discussed in Chandel (2020a), glucose metabolism can proceed down to glycolysis to generate ATP or the carbons can be funneled into different subsidiary pathways, including the hexosamine pathway. The rate-limiting step in this pathway is the first step, catalyzed by glutamine fructose 6-phosphate amidotransferase (GFAT), which uses glutamine and fructose 6-phosphate to generate the product glucosamine 6-phosphate (Fig. 10). Subsequently, glucosamine 6-P-N-acetyltransferase (GNA) uses acetyl-CoA and glucosamine 6-phosphate as substrates to generate N-acetylglucosamine 6-phosphate, which is converted to N-acetylglucosamine 1-phosphate by phosphoacetylglucosamine mutase (PAGM). In the final step of the hexosamine pathway, UDP is added to N-acetylglucosamine-1-phosphate to generate UDP-GlcNAc by UDP-N-acetylglucosamine pyrophosphorylase (UAP). UDP-GlcNAc can be converted into UDP-GalNAc by UDP-galactose 4-epimerase. UDP-GlcNAc is used by OGT to O-GlcNAcylate proteins. These proteins can have their GlcNAc moiety removed by O-GlcNAcase (OGA). Several intracellular proteins, such as transcription factors and RNA polymerase II, can be modified by O-GlcNAc linkage. Furthermore, there is growing evidence linking the insulin-resistant phenotype observed in diabetes to increasing O-GlcNAcylation of proteins. An increase in UDP-GlcNAc levels inhibits GFAT activity through a negative feedback mechanism to reduce the flux through the pathway.
Figure 10.
The hexosamine pathway generates glycoconjugates. Fructose 6-phosphate can be converted into glucosamine 6-phosphate by GFAT to initiate the hexosamine pathway, which, through a series of reactions, generates UDP-N-acetylglucosamine (UDP-GlcNAC) and N-acetylgalactosamine (UDP-GalNAC), which are used to generate glycolipids, proteoglycans, and glycoproteins. OGT uses UDP-GlcNAc to O-GlcNAcylate serine and threonine residues of proteins to modify their activity. These proteins can have their GlcNAc moiety removed by OGA.
UDP-GlcNAc can also be used to generate proteoglycans, which are found in the extracellular matrix and connective tissue. The majority of the proteoglycan molecule is a polysaccharide, which is attached to a small protein component. One important proteoglycan is hyaluronic acid, which has 50,000 disaccharide units of d-glucuronic acid linked to GlcNAc. This highly hydrated proteoglycan is found in synovial fluid, which functions as a lubricant in joints. Recent accumulating evidence suggests that hyaluronic acid is important for regulating cellular proliferation and migration by binding to its receptor CD44. Hyaluronic acid is increasingly expressed in breast cancer stem cells with high metastatic potential, and the interaction between hyaluronic acid and its major receptor CD44 is thought to facilitate breast cancer metastasis. The invasive fibroblast phenotype associated with idiopathic pulmonary fibrosis is also dependent on the interaction of hyaluronic acid with CD44. Currently, there is research interest in developing and testing CD44 monoclonal antibodies to block the interaction of hyaluronic acid with CD44.
BOX 3.
IS FRUCTOSE THE NEW TOBACCO?
In recent years, fructose has become a much-maligned sugar. Robert H. Lustig, a pediatric endocrinologist at the University of California at San Francisco Benioff Children's Hospital, has made headlines for years with his public health crusade against excess fructose consumption, which he thinks is one of the drivers of the increase in obesity and diabetes. A YouTube video of his lecture, “Sugar: The Bitter Truth,” has received more than four million views. Politicians, including former New York City Mayor Michael Bloomberg, have heeded his arguments to ban restaurant and concession stand sales of sugary drinks bigger than 16 ounces. A difficulty in linking fructose consumption to obesity over a period of time is that randomized controlled trials are impossible, primarily because everyone reverts to a more normal eating pattern after a couple of months.
But what is so bad about fructose or high-fructose corn syrup? Can it be turned into fat? Is table sugar different than high-fructose corn syrup? There are a few misconceptions regarding high-fructose corn syrup and table sugar and the ratio of fructose to glucose. Table sugar or sucrose has equal amounts of glucose and fructose (50%); high-fructose corn syrup is not that much different—it has 55% fructose. However, the big difference between glucose and fructose is how they are metabolized. For example, 100 calories of potato, which contains glucose molecules that exist in the form of starch, is metabolized very differently than 100 calories of table sugar, which contains 50% fructose and 50% glucose. The calories are the same, but all the cells in our body can use glucose in potatoes, whereas it is the liver that primarily uses fructose. The metabolism of glucose and fructose in the liver is quite different. Most cells do not have GLUT5, the major transporter of fructose. The liver has abundant GLUT5 transporters, making fructose readily accessible for metabolism. Interestingly, tumor cells can also metabolize fructose. Fructose enters the glycolysis pathway through conversion into fructose 1-phosphate by fructokinase. Subsequently, Aldolase B converts fructose 1-phosphate into glyceraldehyde and dihydroxyacetone phosphate.
Box 3, Figure 1.
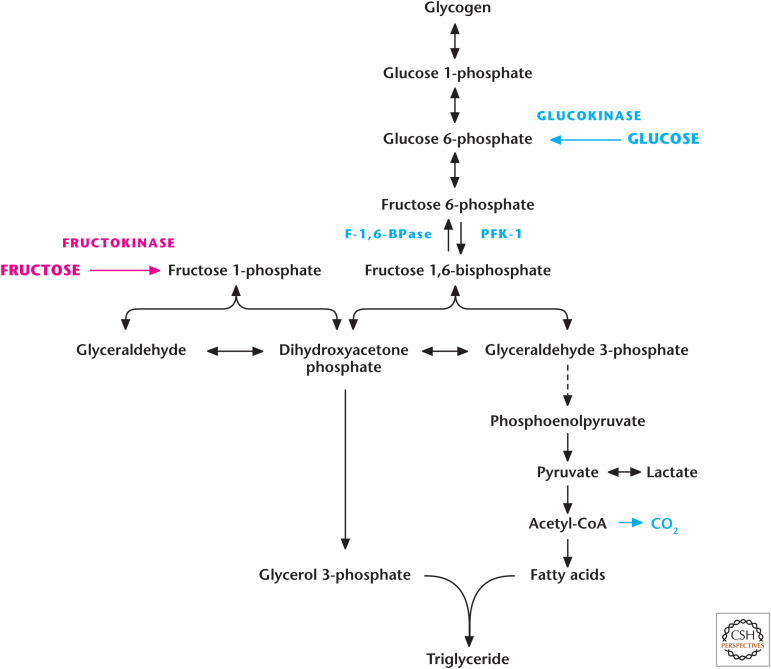
Fructose generates triglycerides in the liver. Fructose enters the glycolysis pathway through conversion into fructose 1-phosphate by fructokinase. Subsequently, Aldolase B converts fructose 1-phosphate into glyceraldehyde and dihydroxyacetone phosphate. A major regulatory step in glycolysis is PFK1, which is bypassed by fructose's entry into glycolysis. Thus, if the liver has met its energetic needs, it converts excess fructose into glyceraldehyde, which is converted into glycerol 3-phosphate, a precursor for triglycerides. Fructose also generates dihydroxyacetone phosphate, which can become glyceraldehyde 3-phosphate and, eventually, go through glycolysis and into the mitochondrial TCA cycle. The excess citrate generated is exported to cytosol to generate fatty acids, another precursor to triglycerides.
As discussed in Chandel (2020a), a major regulatory step in glycolysis is phosphofructose kinase 1. This step is bypassed by fructose's entry into glycolysis. Thus, if the liver has met its energetic needs, it converts excess fructose into glyceraldehyde, which is converted into glycerol 3-phosphate, a precursor for triglycerides (Box 3, Fig. 1). Fructose can also generate dihydroxyacetone phosphate, which becomes glyceraldehyde 3-phoshpate and eventually goes through glycolysis and into the mitochondrial TCA cycle. The excess citrate generated is exported to cytosol, where it is converted into acetyl-CoA to generate fatty acids, another precursor to triglycerides.
Thus, you can burn off the glucose in every cell, but the fructose is converted into fat in the liver, which causes insulin resistance. What about artificial sweeteners in diet sodas? A recent large study on more than 60,000 women found that diet drinks raised the risk of diabetes more than fruit juices or sugar-sweetened drinks over a 14-year period. Artificial sweeteners trick the body into thinking sugar is on its way and this causes the pancreas to pump out insulin, which can increase storage of nutrients, such as fat in the liver. Chandel (2020c) discusses more about fat metabolism.
Footnotes
From the recent volume Navigating Metabolism by Navdeep S. Chandel
Additional Perspectives on Metabolism available at www.cshperspectives.org
SUGGESTED READING
*Reference is also in this collection.
- Brautigan DL. 2013. Protein Ser/Thr phosphatases—the ugly ducklings of cell signaling. FEBS J 280: 324–345. 10.1111/j.1742-4658.2012.08609.x [DOI] [PubMed] [Google Scholar]
- Cahill GF Jr. 1970. Starvation in man. N Engl J Med 282: 668–675. 10.1056/NEJM197003192821209 [DOI] [PubMed] [Google Scholar]
- Cantley LC. 2013. Cancer, metabolism, fructose, artificial sweeteners, and going cold turkey on sugar. BMC Biol 12: 8 10.1186/1741-7007-12-8 [DOI] [PMC free article] [PubMed] [Google Scholar]
- *.Chandel NS. 2020a. Glycolysis. Cold Spring Harb Perspect Biol 10.1101/cshperspect.a040535 [DOI] [PMC free article] [PubMed] [Google Scholar]
- *.Chandel NS. 2020b. Mitochondria. Cold Spring Harb Perspect Biol 10.1101/cshperspect.a040543 [DOI] [PMC free article] [PubMed] [Google Scholar]
- *.Chandel NS. 2020c. Lipid metabolism. Cold Spring Harb Perspect Biol 10.1101/cshperspect.a040576 [DOI] [PMC free article] [PubMed] [Google Scholar]
- Cori CF. 1969. The call of science. Annu Rev Biochem 38: 1–21. 10.1146/annurev.bi.38.070169.000245 [DOI] [PubMed] [Google Scholar]
- Cumming MC, Morrison SD. 1960. The total metabolism of rats during fasting and refeeding. J Physiol 154: 219–243. 10.1113/jphysiol.1960.sp006575 [DOI] [PMC free article] [PubMed] [Google Scholar]
- Goldblatt MW. 1929. Insulin and gluconeogenesis. Biochem J 23: 243–255. 10.1042/bj0230243 [DOI] [PMC free article] [PubMed] [Google Scholar]
- Larner J. 1992. Gerty Theresa Cori: August 8, 1896–October 26, 1957. Biogr Mem Natl Acad Sci 61: 111–135. [PubMed] [Google Scholar]
- Leloir LF. 1971. Two decades of research on the biosynthesis of saccharides. Science 172: 1299–1303. 10.1126/stke.3122005re13 [DOI] [PubMed] [Google Scholar]
- Love DC, Hanover JA. 2005. The hexosamine signaling pathway: deciphering the ‘O-GlcNAc code.’ Sci STKE 2005: re13. [DOI] [PubMed] [Google Scholar]
- Lustig RH, Schmidt LA, Brindis CD. 2012. Public health: the toxic truth about sugar. Nature 482: 27–29. 10.1038/482027a [DOI] [PubMed] [Google Scholar]
- Samuel VT, Shulman GI. 2012. Mechanisms for insulin resistance: common threads and missing links. Cell 148: 852–871. 10.1016/j.cell.2012.02.017 [DOI] [PMC free article] [PubMed] [Google Scholar]
- Taniguchi CM, Emanuelli B, Kahn CR. 2006. Critical nodes in signalling pathways: insights into insulin action. Nat Rev Mol Cell Biol 7: 85–96. 10.1038/nrm1837 [DOI] [PubMed] [Google Scholar]


