Abstract
Adequate hyoid and laryngeal displacement facilitate safe and efficient swallowing. Although videofluoroscopy is commonly used for assessment of this biomechanical event, ultrasound provides benefits as a radiation-free modality for this purpose. This study investigated validity of a pocket-sized ultrasound system (Clarius™) in the assessment of hyoid and laryngeal excursion. Hyoid excursion and thyrohyoid approximation were concurrently assessed in 20 healthy adults using ultrasound and videofluoroscopy during saliva, liquid, and puree swallowing. Correlation analyses were performed to evaluate validity. There was a strong and moderate positive association between ultrasound and videofluoroscopic measurements of hyoid excursion during dry and liquid swallowing, respectively. No evidence for a significant association was found for ultrasound and videofluoroscopic measurements of hyoid excursion for puree swallowing and of thyrohyoid approximation for any bolus type. Further work towards improved validity is necessary prior to clinical transfer of the pocket-sized Clarius™ system in clinical swallowing assessment.
Keywords: Ultrasound, Videofluoroscopy, Swallowing, Validity, Hyoid excursion, Thyrohyoid approximation
Introduction
Adequate hyoid and laryngeal displacement are critical for safe and efficient swallowing. Hyoid excursion during swallowing facilitates opening of the upper oesophageal sphincter and, therefore, bolus passage from the pharynx into the oesophagus [1, 2]. The intra-swallow approximation of the thyroid cartilage and hyoid bone plays a role in airway protection, through supraglottic shortening and epiglottic deflection [3, 4].
Objectively assessing hyoid and laryngeal displacement is of interest in swallowing evaluation. Videofluoroscopic imaging is a commonly used modality in clinical practice to examine intra-swallow movement of the hyolaryngeal complex. However, its use for prolonged examinations and repeated testing is limited, due to radiation exposure. Further, access to a videofluoroscopy suite may be challenging for a number of populations [5]. The use of ultrasound in swallowing assessment yields benefits as a radiation-free imaging modality [6]. While ultrasound is not a standard assessment tool in daily clinical practice, there are reports in the literature documenting its use in the assessment of hyoid excursion [6, 7] and thyrohyoid approximation [8, 9].
With technical advancements, pocket-sized ultrasound systems have been developed. As an adjunct to diagnostic swallowing evaluation, these devices could be useful for application in patients who are not able to mobilise out of bed or patients in community settings where transfer to a videofluoroscopy suite is challenging. Further, this new ultrasound technology is smaller and more affordable within the reach of allied health resourcing as compared to larger ultrasound systems including laptop-driven ultrasound devices. Increased clinical availability may be beneficial for some patient populations and can potentially gain importance during times of restricted access to instrumental swallowing assessment in the hospital due to epidemic outbreaks, such as COVID 19.
In the literature, there is evidence of validity when measurements of hyoid and laryngeal excursion derived from ultrasound instrumentation and from videofluoroscopy are compared. Two studies documented a strong correlation between ultrasound and videofluoroscopic measurements of hyoid excursion in patients with dysphagia [6, 10], while one study reported no significant difference between ultrasound and radiographic measurements of thyrohyoid approximation in subjects with dysphagia [8].
Data are lacking regarding validity of pocket-sized ultrasound systems; yet validity data are essential prior to implementation of this technology into routine clinical practice [11]. This preliminary study investigated if valid measurements of hyoid excursion and thyrohyoid approximation could be derived from a pocket-sized ultrasound system in healthy subjects, as determined by comparison with videofluoroscopic measures. Validity data of ultrasound in the assessment of healthy swallowing are required as swallowing evaluation aims to differentiate between normal and impaired swallowing function in subjects with suspected dysphagia. Given the undisputed use of videofluoroscopy for visualisation of swallowing biomechanics, a comparison of ultrasound against videofluoroscopy is appropriate for validation purposes. The use of videofluoroscopy allows for concurrent radiographic and ultrasound imaging to ensure that the same swallowing event is captured by the two instruments.
Materials and Methods
Participants
This study recruited 20 healthy participants for one session (five participants per age group, namely 20–39, 40–59, 60–79, and 80 + years) with females and males equally represented across the age groups. Participants were recruited via advertisement and an in-house volunteer database. Exclusion criteria, based on participant’ report, included history of swallowing impairment or current swallowing difficulty, neurological or muscular disease, head and neck tumour or anatomical abnormalities of the head and neck region, drugs, which might have an impact on swallowing, or pregnancy. The study was approved by the appropriate regional health ethics committee (HEC 2017/20). Verbal and written information about the study was provided and informed consent was obtained from the participants.
Instrumentation
Ultrasound high-resolution live imaging was performed using a curvilinear Clarius™ scanner (C3, Clarius, Burnaby, British Columbia, Canada; frequency range: 2–6 MHz, depth: 3–30 cm, size: 169 mm × 105 mm × 41 mm) that conforms the anatomy of the chin. The scanner connected wirelessly to the Clarius™ application software (Burnaby, British Columbia, Canada) that was installed on an iPad (screen size 20 cm × 15 cm) with ultrasound recordings visualised on the iPad (20 frames/s). For videofluoroscopic imaging, the Fluorostar 7900 (GE OEC Medical Systems GmbH, Wendelstein, Germany) was used (25 frames/s).
Procedure
Participants were seated in a chair placed within the C-arm of the fluoroscope. A calibration disc of known size was taped to the participant’s lateral face for calibrated post hoc measurement. Ultrasound and videofluoroscopic imaging was performed concurrently. Data collection included measures of hyoid excursion and thyrohyoid approximation (Fig. 1). Order of data acquisition was randomised between the two measures. Data acquisition involved swallows of saliva, 5 mL water, and 5 mL apple sauce (Wattie’s™). To minimise radiation exposure, participants performed each measure once only per consistency (six swallows per participant in total). The order in which bolus types were presented was kept consistent across participants and sessions as the sequence may influence the findings. Saliva was presented first followed by water and puree to reflect the order routinely followed in clinical practice. Quantities were measured with a syringe; liquid boluses were offered in a 20 mL plastic cup and puree boluses with a spoon. Participants were instructed to hold the bolus in the mouth. Once the scanner was placed, they were asked to swallow as naturally as possible, without accommodating head position to the scanner. The principal researcher collected data from all participants. Ultrasound data collection involved scanning, image selection from the recorded video and measurement. Image selection and measurement were performed online on the iPad immediately after each swallow. A randomly selected 20% of swallows per measure and instrument were measured offline on a second occasion by the principal researcher for assessment of intra-rater reliability. A period of at least 11 days between data collection and offline measurement was implemented to avoid recall. A second rater measured another randomly selected 20% of the data offline for assessment of inter-rater reliability. For both instruments, reliability assessment included image selection from the recorded cine and measurement. Raters were blinded to the measurements performed by the other rater. Both researchers were trained in ultrasound and videofluoroscopic data extraction for purpose of this study. Training was consensus based rather than standardised. Prior to assessment of inter-rater reliability, raters agreed on measurement techniques with a written reference document with measurement guidelines established.
Fig. 1.
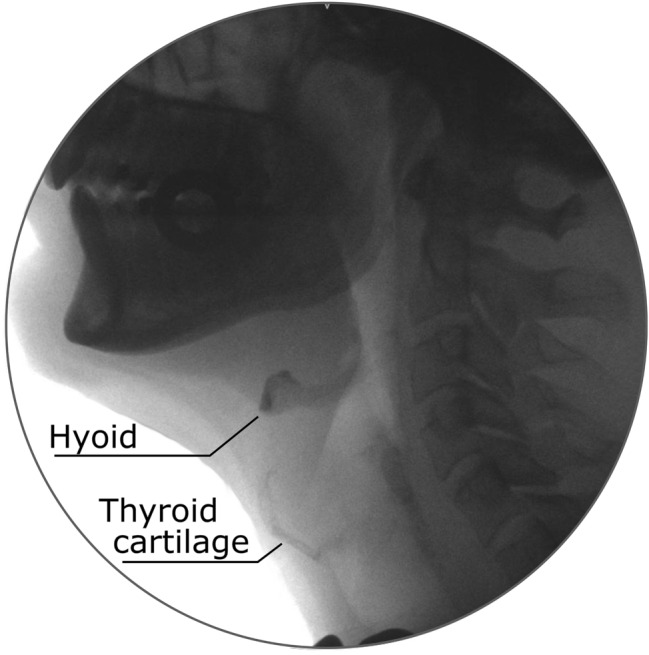
Radiographic image depicting the structures of interest
Recording
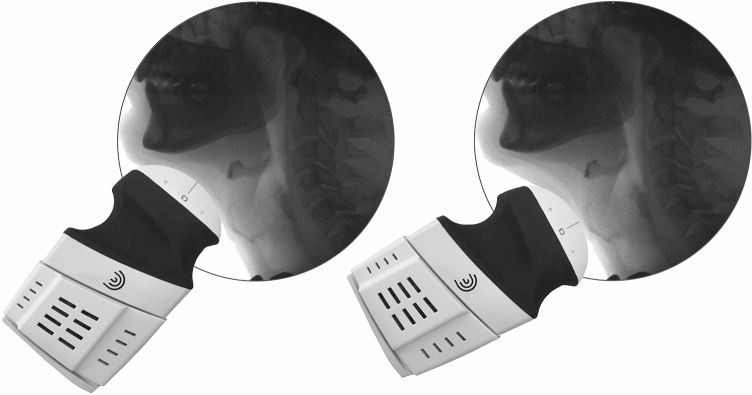
Aquasonic transmission gel was used for acoustic coupling before the ultrasound scanner was placed manually on the skin surface of the participant’s neck. Consistent scanner position was maintained and minimal pressure against the skin was applied throughout data acquisition [12] to minimise the impact of the scanner on swallowing function. Specific pre-set exam types with customised features, such as scanning depth or gain were selected per measure. For optimal image quality, manual accommodation of depth, gain, and display brightness was performed per measure and participant if required. Structures were viewed upside down according to previous studies assessing validity and/or reliability of hyoid excursion [13] and thyrohyoid approximation [8]. Swallowing events were recorded as individual video-clips of 20 s. For imaging hyoid excursion, settings included a depth between 7 and 10 cm, a frequency of 4 MHz, and single focus. Sagittal sonography was performed with the scanner positioned at right angles to the floor of mouth muscles. The scanner was placed midline, capturing the acoustic shadow of the mandible on one side and on the other side the acoustic shadow of the hyoid [13]. Inferiorly, the surface of the tongue was visible. For recording of thyrohyoid approximation, settings included a depth between 1–7 cm, a frequency of 5 MHz, and dual focus. The scanner was positioned midline or slightly off midline in sagittal plane approximately overlying the thyrohyoid muscle. This allowed visualisation of key features, including the acoustic shadow of the hyoid on one side, and the acoustic shadow of the thyroid cartilage on the other side [9]. Figure 2 depicts the placement of the scanner during data collection.
Fig. 2.
Scanner placement for assessment of hyoid excursion (at the left of the image) and thyrohyoid approximation (at the right of the image)
For videofluoroscopic examination, a low dose continuous cine mode was selected. Recordings comprised mandible (anteriorly), nasal cavity (superiorly), cervical spine (posteriorly), proximal oesophagus, and trachea (inferiorly).
Data Extraction
For online measurement of ultrasound data, specific images were selected after each swallow by navigating through the recorded video on the iPad. For data extraction of hyoid excursion, two images were selected, one representing the peak of hyoid displacement and one with the hyoid at rest position post swallow. The peak position image was defined as the one showing the smallest distance between shadow cast by the hyoid and shadow cast by the mental spine of the mandible (Fig. 3). The extent which the hyoid travels was expressed as a percentage of the distance at maximal displacement from rest ((rest distance between mental spine of the mandible and hyoid – maximal distance between the two structures)/rest distance between the two structures) × 100 [13]. Data extraction of thyrohyoid approximation involved selection of one image showing hyoid and thyroid cartilage maximally approximated intra-swallow and the other with the two structures at rest, post-swallow (Fig. 4). Thyrohyoid approximation was expressed as a percentage of the distance between thyroid cartilage and hyoid at maximal approximation from rest [8, 9].
Fig. 3.
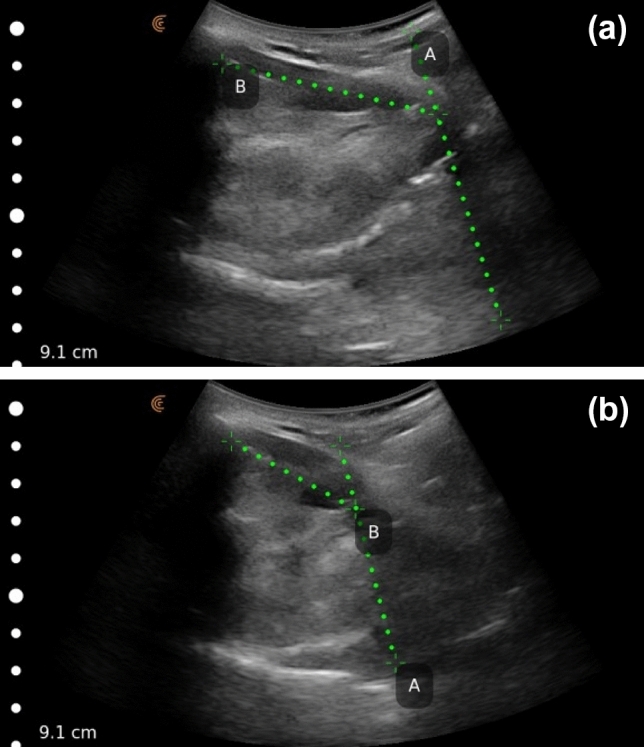
Sonogram of the hyoid at rest position (a), and at maximal displacement (b) for evaluation of hyoid excursion. For measurement, the line of best fit (Line A) was drawn along the anterior border of the shadow cast by the hyoid (the shadow at the right of the images). For Line B, one calliper was placed at the posterior border of the onset of the shadow created by the mental spine of the mandible (shadow on the left of the images). The second calliper was placed at the intersection point with Line A at the onset of the shadow cast by the hyoid
Fig. 4.
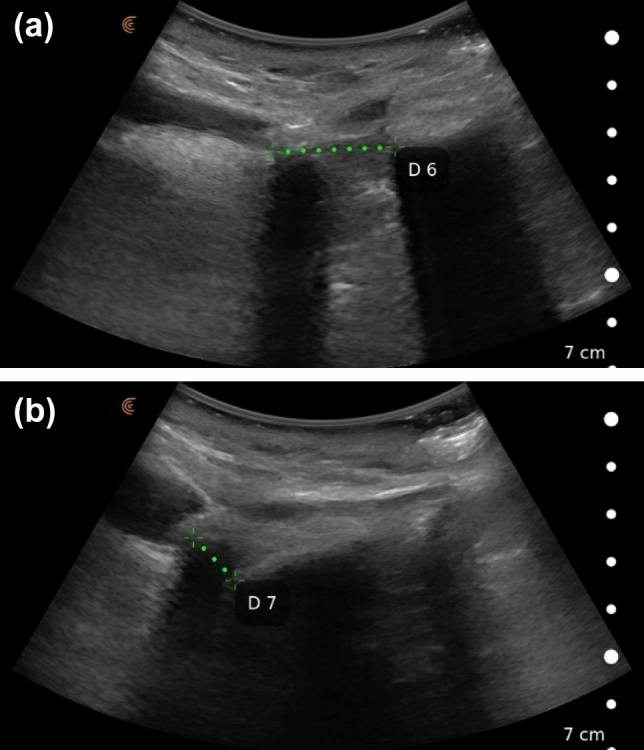
Sonogram of the distance (Line D) between hyoid and upper border of thyroid cartilage at rest (a) and at maximal approximation (b) [8, 9] for evaluation of thyrohyoid approximation. One calliper was placed at the beginning of the anterior border of the shadow of the hyoid (shadow on the left of the windows) or at the opacity representing the hyoid. The other calliper was placed at either the onset of the shadow cast by the thyroid cartilage (shadow on the right of the images) or at the bright opacity at the superior border of the thyroid cartilage. Of each of the two points, the one that was visible in both images was selected
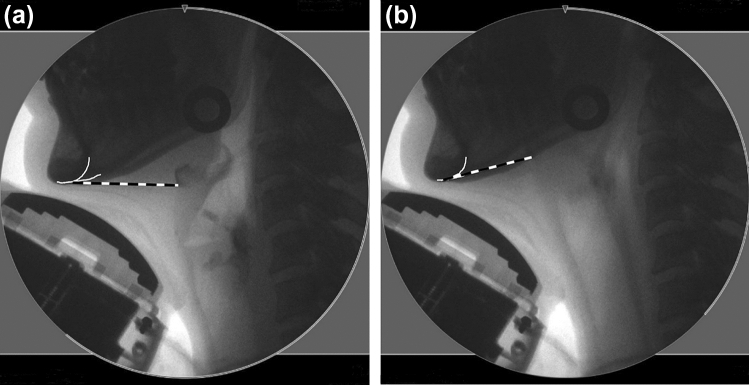
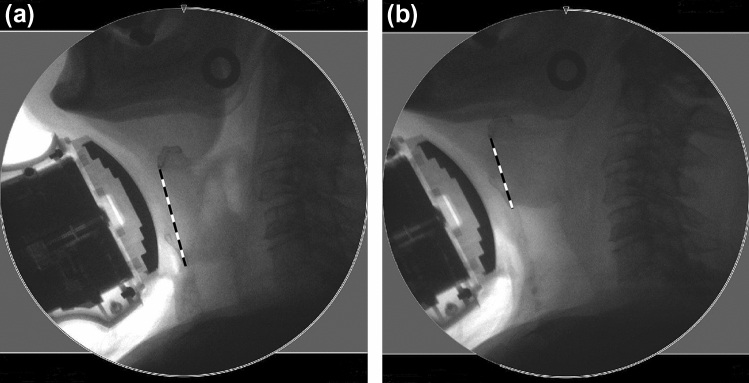
Videofluoroscopic recordings were analysed using ImageJ software (U.S. National Institutes of Health, Bethesda, Maryland, USA). Images were calibrated for measurement. For data extraction of hyoid excursion, the percentage change from the position at rest post swallow and at maximal anterior displacement was calculated (Fig. 5). For data extraction of thyrohyoid approximation, one image was selected depicting the hyoid and thyroid cartilages at maximal approximation intra-swallow and one showing these structures at rest, post-swallow (Fig. 6). Percentage approximation was calculated from rest.
Fig. 5.
Hyoid excursion assessed using videofluoroscopy. Dashed measurement lines for calculation of the distance from hyoid to mandible at rest (a) and at maximal hyoid displacement (b). The white drawings were used to define the measurement point at the mandibular prominence. The inferior-anterior part of the hyoid and the mandibular prominence were used as measurement points to approximate the measurement methods of the radiographic images to those for ultrasound and based on reported methodology in the literature [23]
Fig. 6.
Thyrohyoid approximation assessed using videofluoroscopy. Dashed measurement lines depicting the distance between anterior-inferior aspect of the hyoid and the anterior edge of the inferior end of the thyroid cartilage at rest (a) and at maximal approximation (b). As opposed to ultrasound, the inferior rather than the superior border of the thyroid cartilage was chosen as the upper border was often not sufficiently distinct for measurement. Additionally, even if it was visible, the upper border of the thyroid cartilage superimposed the hyoid at maximal excursion in some cases; hence, calculation of percentage approximation would yield more than 100%
Statistical Analysis
Means and standard deviations were calculated for both measures and both instruments across participants. Using R software [14], intra-class correlation estimates (ICC) were calculated based on mixed effects analyses [15], if the assumptions for analyses were met. Intra-rater reliability was calculated using a two-way mixed effects model (ICC [3, 1]), inter-rater reliability using a two-way random effects model (ICC [2, 1]) for agreement of single measures. A likelihood ratio test was used to test for a potential bolus effect. The full model which included bolus as a fixed effect was compared to the reduced model that did not contain bolus as a fixed effect. If there was a significant bolus effect, analysis using the full model was continued to remove variability due to bolus consistency. If there was no bolus effect, the reduced model was used. Interpretation of reliability findings was based on published criteria: poor reliability (ICC < 0.50), moderate reliability (ICC 0.50–0.75), and good reliability (ICC > 0.75) [11].
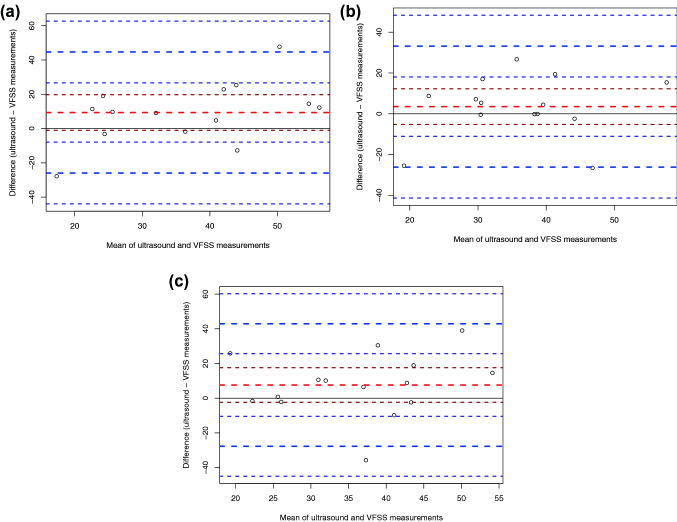
A Pearson’s correlation coefficient (r) was calculated using R software [16] to determine strength and direction of a linear relationship between ultrasound and videofluoroscopic measurements [17]. A p-value of ≤ 0.05 was considered significant. If the assumptions of a Pearson’s correlation analysis were violated, a non-parametric Kendall’s correlation coefficient (tau) was calculated. Published guidelines were used for interpretation [18]. Limits of agreement were calculated post hoc to quantify the range of agreement between ultrasound and videofluoroscopic measurements as measurement methods differed across imaging modalities. A priori limits of agreement were not defined as the intent of the study was not to evaluate the potential of ultrasound to replace videofluoroscopy. Differences between paired measurements derived from the two instruments were plotted against the mean of the paired measurements (Bland–Altman plot) [19]. If the assumptions for agreement analyses were violated, post hoc analyses were not further continued.
Results
Ten females and 10 males completed the study protocol. Descriptive statistics of ultrasound and videofluoroscopic data are reported in Table 1. For reliability of videofluoroscopic data extraction, measures of thyrohyoid approximation were excluded from analysis if the thyroid cartilage was insufficiently visible for measurement due to weak contrast (n = 5 for intra-rater reliability; n = 3 for inter-rater reliability) or if the calibration disc was not captured within the frame (n = 1 for intra-rater reliability). As illustrated in Table 2, the findings indicate good intra-rater reliability for videofluoroscopic data extraction; inter-rater reliability ranged from poor to moderate. Intra-rater reliability of ultrasound data extraction ranged from poor to moderate, inter-rater reliability was moderate.
Table 1.
Videofluoroscopic and ultrasound measures: mean (standard deviation)
| Measure | Bolus | VFSS (percentage change) | Ultrasound (percentage change) |
|---|---|---|---|
| Hyoid excursion | Dry | 24.31 (7.23) | 26.24 (5.68) |
| Liquid | 25.73 (5.82) | 29.63 (7.22) | |
| Puree | 26.94 (5.94) | 27.61 (8.79) | |
| Thyrohyoid approximation | Dry | 32.08 (11.51) | 43.57 (5.68) |
| Liquid | 34.35 (11.63) | 37.48 (7.22) | |
| Puree | 32.49 (12.25) | 41.08 (14.81) |
VFSS videofluoroscopic swallowing study.
Table 2.
Intra- and inter-rater reliability for videofluoroscopic and ultrasound measures
| Measure | Bolus | Intra-rater ICC (95% CI) VFSS | Inter-rater ICC (95% CI) VFSS | Intra-rater ICC (95% CI) ultrasound | Inter-rater ICC (95% CI) ultrasound |
|---|---|---|---|---|---|
| Hyoid excursion | Dry, liquid, puree | 0.94 (0.78, 0.98) | 0.74 (0.29, 0.91) | 0.25 (0.00, 0.78) | 0.53 (0.01, 0.83) |
| Thyrohyoid approximation | Dry, liquid, puree | 0.91 (0.52, 0.99) | [0.34] (0.00, 0.76) | 0.58 (0.10, 0.88) | 0.68 (0.25, 0.89) |
ICC intra-class correlation coefficient, CI confidence interval, VFSS videofluoroscopic swallowing study, [] assumptions for analysis are not met.
Videofluoroscopic data were excluded from validity analyses if the visibility of the calibration disc or of target structures were insufficient for measurement purposes. Out of 60 acquired measurements for hyoid excursion, 58 were analysed. For thyrohyoid approximation, 44 of the 60 measurements were included into analyses. As depicted in Table 3, there was evidence of an association between ultrasound and videofluoroscopic measurements of hyoid excursion during dry and liquid swallowing. The positive correlation was strong for dry swallowing and moderate for liquid swallowing. No evidence of a significant association during puree swallowing was found. There was no evidence of a significant association between ultrasound and videofluoroscopic measurements of thyrohyoid approximation during swallowing of any bolus types.
Table 3.
Correlation between ultrasound and videofluoroscopic measurements of hyoid excursion and thyrohyoid approximation
| Measure | Bolus | Correlation coefficient, p-value |
|---|---|---|
| Hyoid excursion | Dry | r = 0.79, p ≤ 0.001* |
| Liquid | r = 0.67, p ≤ 0.002* | |
| Puree | tau = 0.27, p = 0.11 | |
| Thyrohyoid approximation | Dry | r = 0.36, p = 0.20 |
| Liquid | r = 0.27, p = 0.35 | |
| Puree | tau = 0.16, p = 0.44 |
*Significant at p ≤ 0.05.
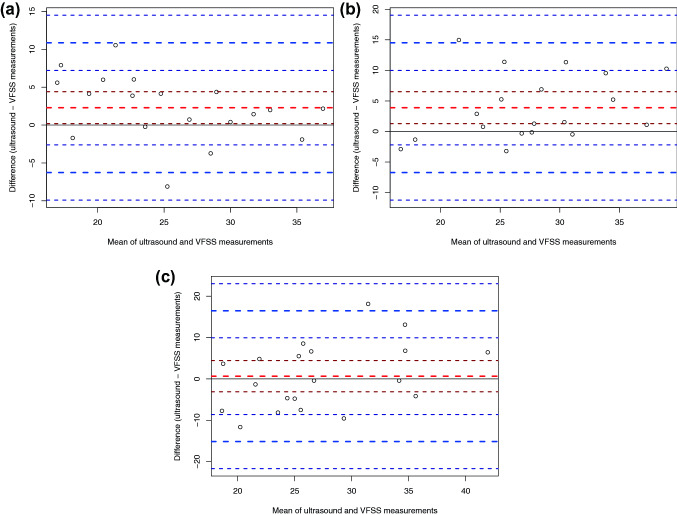
For hyoid excursion during dry, liquid, and puree swallowing, the upper limits of agreement for ultrasound measurements were calculated at 10.86 percentage change for dry swallows, 14.50 percentage change for liquid swallows, and 16.48 percentage change for puree swallows. The lower limits were calculated at − 6.27 percentage change for dry swallows, − 6.71 percentage change for liquid swallows, and − 15.15 percentage change for puree swallows. This indicates that ultrasound measures of hyoid excursion during dry swallowing, for example, may range from 10.86 percentage change above to 6.27 percentage change below videofluoroscopic measures. Upper limits of agreement for ultrasound measurements of thyrohyoid approximation were calculated at 44.67 percentage change for dry swallows, 35.67 percentage change for liquid swallows, and 42.92 percentage change for puree swallows. The lower limits were calculated at − 25.94 percentage change for dry swallows, − 26.18 percentage change for liquid swallows, and − 27.72 percentage change for puree swallows. The Bland Altman plots are depicted in Figs. 7 and 8. The plots indicate significant bias between ultrasound and videofluoroscopy for hyoid excursion during dry and liquid swallowing, as the theoretical mean difference of zero on the Y-axis does not lie within the 95% confidence interval of the mean difference (Fig. 7a, b).
Fig. 7.
Bland Altman plot for hyoid excursion during dry (a), liquid (b), and puree swallowing (c) assessed using ultrasound and videofluoroscopy (VFSS). The unit of the X- and Y-axis is percentage change. The thick dashed red line represents the mean difference between ultrasound and videofluoroscopic measurements; the thin dashed red lines represent the 95% confidence interval of the mean difference. The thick dashed blue lines represent the upper and lower limits of agreement; the thin dashed blue lines represent the 95% confidence intervals
Fig. 8.
Bland Altman plot for thyrohyoid approximation during dry (a), liquid (b), and puree swallowing (c) assessed using ultrasound and videofluoroscopy (VFSS)
Discussion
Ultrasound measurements of hyoid excursion and thyrohyoid approximation assessed using the Clarius™ system in healthy subjects poorly reflect measurements derived from videofluoroscopy, with the exception of hyoid excursion during saliva swallowing. There are several factors that may explain these findings. Validity of any measure requires consistent measurement acquisition [11, 20]. Thus, validity findings may be explained by insufficient reliability of ultrasound measurement acquisition. Poor to moderate reliability may suggest that the image quality of the Clarius™ system is insufficient for evaluation of hyoid and laryngeal excursion. Yet, more reliability data of the Clarius™ system are required for an in-depth interpretation of the findings, given that reliability was evaluated for only a small sub-set of the data. It cannot be excluded that due to difficulties in visualisation of laryngeal structures in some participants, structures other than the thyroid cartilage such as the epiglottis or artefacts were erroneously used for measurement.
While previous studies performed ultrasound and videofluoroscopic imaging separately [6, 8, 10], concurrent data acquisition was performed in this study to eliminate test–retest variability. However, concurrent collection of ultrasound and videofluoroscopic data may partially explain insufficient validity and reliability, as this method posed a technical challenge that may have negatively affected image quality. Stable scanner placement, known to be critical for quality of ultrasound recordings [12], may have been compromised as the researcher kept an arm-length distance from the participant for radiation safety [21]. For future studies, advantages of the use of a stabilisation unit for scanner placement during videofluoroscopic imaging would need to be balanced against the issues related to the use of these devices, such as the risk of loss of contact between the scanner and the skin [22].
Study findings suggest that the two instruments not only poorly relate but also produce considerably different measurements of hyoid excursion and thyrohyoid approximation, as indicated by the Bland–Altman plots. For measurement of thyrohyoid approximation, the superior border of the thyroid cartilage was used in ultrasound, while the inferior border was used for videofluoroscopic images. This difference in measurement methods across instrumentation may explain, in part, that ultrasound and videofluoroscopic values of thyrohyoid approximation were considerably different.
Another factor that may have compromised validity and reliability is the ultrasound technology. A thorough comparison of technical aspects between pocket-sized and larger ultrasound devices is not possible, as technical details are not available for other published studies. Having used an ultrasound system that is in the early stage of development, substantial technical issues were encountered with its frequent use during data collection. Unstable connection between the Clarius™ scanners and the iPad resulted in frequent interruption of data collection. Other technical issues, such as a malfunctioning scrolling function for video review likely impacted the study findings.
There are limitations of this preliminary research, including the sample size and number of measurements. Results may have been negatively impacted by technical difficulties. Future studies will benefit from improved radiographic contrast for visualisation of structures such as the thyroid cartilage. With a clearer visualisation of the lower border of the thyroid cartilage, equal measurement methods across instruments would be possible for evaluation of thyrohyoid approximation. This may increase agreement across instruments. However, prior to a study assessing validity in a larger sample, research is required to clarify whether reliability of ultrasound measures explains insufficient validity.
Conclusions
Given the importance of validity and reliability of instrumentation used for diagnostic purposes, the clinical use of the Clarius™ system for swallowing assessment is not indicated at this time. Future research is required to clarify whether our findings reflect technical limitations of the Clarius™ system or of pocket-sized technology more generally. This will further elucidate if new ultrasound technology may be used in routine clinical assessment of swallowing. Further research is required to clarify whether reliability of ultrasound data explains insufficient validity.
Acknowledgements
The authors wish to thank the Health Research Council of New Zealand (HRC16/811) for the financial support for this project.
Compliance with Ethical Standards
Conflicts of interest
The authors declare that they have no conflict of interest.
Footnotes
Publisher's Note
Springer Nature remains neutral with regard to jurisdictional claims in published maps and institutional affiliations.
References
- 1.Jacob P, Kahrilas PJ, Logemann JA, Shah V, Ha T. Upper esophageal sphincter opening and modulation during swallowing. Gastroenterology. 1989;97(6):1469–1478. doi: 10.1016/0016-5085(89)90391-0. [DOI] [PubMed] [Google Scholar]
- 2.Ishida R, Palmer JB, Hiiemae KM. Hyoid motion during swallowing: Factors affecting forward and upward displacement. Dysphagia. 2002;17(4):262–272. doi: 10.1007/s00455-002-0064-5. [DOI] [PubMed] [Google Scholar]
- 3.Logemann JA. Evaluation and treatment of swallowing disorders. 2nd edn. pro-ed, Texas; 1998.
- 4.Vandaele DJ, Perlman AL, Cassell MD. Intrinsic fibre architecture and attachments of the human epiglottis and their contributions to the mechanism of deglutition. J Anat. 1995;186(1):1–15. [PMC free article] [PubMed] [Google Scholar]
- 5.Rugiu MG. Role of videofluoroscopy in evaluation of neurologic dysphagia. Acta Otorhinolaryngol Ital. 2007;27(6):306–316. [PMC free article] [PubMed] [Google Scholar]
- 6.Hsiao M-Y, Chang Y-C, Chen W-S, Chang H-Y, Wang T-G. Application of ultrasonography in assessing oropharyngeal dysphagia in stroke patients. Ultrasound Med Biol. 2012;38(9):1522–1528. doi: 10.1016/j.ultrasmedbio.2012.04.017. [DOI] [PubMed] [Google Scholar]
- 7.Lee YS, Lee KE, Kang YK, Yi TI, Kim JS. Usefulness of submental ultrasonographic evaluation for dysphagia patients. Ann Rehabil Med. 2016;40(2):197–205. doi: 10.5535/arm.2016.40.2.197. [DOI] [PMC free article] [PubMed] [Google Scholar]
- 8.Huang Y-L, Hsieh S-F, Chang Y-C, Chen H-C, Wang T-G. Ultrasonographic evaluation of hyoid-larynx approximation in dysphagic stroke patients. Ultrasound Med Biol. 2009;35(7):1103–1108. doi: 10.1016/j.ultrasmedbio.2009.02.006. [DOI] [PubMed] [Google Scholar]
- 9.Kuhl V, Eicke BM, Dieterich M, Urban PP. Sonographic analysis of laryngeal elevation during swallowing. J Neurol. 2003;250(3):333–337. doi: 10.1007/s00415-003-1007-2. [DOI] [PubMed] [Google Scholar]
- 10.Chen Y-C, Hsiao M-Y, Wang Y-C, Fu C-P, Wang T-G. Reliability of ultrasonography in evaluating hyoid bone movement. J Med Ultrasound. 2017;25(2):90–95. doi: 10.1016/j.jmu.2017.01.002. [DOI] [PMC free article] [PubMed] [Google Scholar]
- 11.Portney LG, Watkins MP. Foundations of clinical research. Applications to practice. 3. London: Pearson Education; 2009. [Google Scholar]
- 12.Stone M. A guide to analysing tongue motion from ultrasound images. Clin Linguist Phon. 2005;19(6–7):455–501. doi: 10.1080/02699200500113558. [DOI] [PubMed] [Google Scholar]
- 13.Macrae PR, Doeltgen SH, Jones RD, Huckabee M-L. Intra- and inter-rater reliability for analysis of hyoid displacement measured with sonography. J Clin Ultrasound. 2012;40(2):74–78. doi: 10.1002/jcu.20874. [DOI] [PubMed] [Google Scholar]
- 14.R Core Team . R: a language and environment for statistical computing. Vienna: R Core Team; 2016. [Google Scholar]
- 15.Bates D, Mächler M, Bolker B, Walker S. Fitting linear mixed-effects models using {lme4} J Stat Softw. 2015;67:1–48. doi: 10.18637/jss.v067.i01. [DOI] [Google Scholar]
- 16.R Core Team . R: a language and environment for statistical computing. Vienna: R Core Team; 2017. [Google Scholar]
- 17.Udovičić M, Baždarić K, Bilić-Zulle L, Petrovečki M. What we need to know when calculating the coefficient of correlation? Biochem Med. 2007;17(1):10–15. doi: 10.11613/BM.2007.002. [DOI] [Google Scholar]
- 18.Allen M. Correlation, Pearson. In: The SAGE Encyclopediaof Communication Research Methods, vol 1–4. Thousand Oaks: SAGE Publications; 2017.
- 19.Altman DG, Bland JM. Measurement in medicine: the analysis of method comparison studies. J R Stat Soc D. 1983;32(3):307–317. [Google Scholar]
- 20.Field A, Miles J, Field Z. Discovering statistics using R. London, California, New Delhi, Singapore: SAGE; 2012. [Google Scholar]
- 21.Peladeau-Pigeon M, Steele C. Technical aspects of a videofluoroscopic swallowing study. Can J Speech Lang Pathol Audiol. 2013;37(3):216–226. [Google Scholar]
- 22.Perry SE, Winkelman CJ, Huckabee ML. Variability in ultrasound measurement of hyoid hone displacement and submental muscle size using 2 methods of data acquisition. Folia Phoniatr Logopaed. 2016;68(5):205–210. doi: 10.1159/000473876. [DOI] [PubMed] [Google Scholar]
- 23.Thompson TZ, Obeidin F, Davidoff AA, Hightower CL, Johnson CZ, Rice SL, Sokolove RL, Taylor BK, Tuck JM, Pearson WG. Coordinate mapping of hyolaryngeal mechanics in swallowing. J Vis Exp. 2014;87:1–11. doi: 10.3791/51476. [DOI] [PMC free article] [PubMed] [Google Scholar]


