Abstract
The novel coronavirus disease (COVID-19) spread quickly worldwide, changing the everyday lives of billions of individuals. The preliminary diagnosis of COVID-19 empowers health experts and government professionals to break the chain of change and level the epidemic curve. The regular sort of COVID-19 detection test, be that as it may, requires specific hardware and generally has low sensitivity. Chest X-ray images to be used to diagnosis the COVID-19. In this work, a dataset of X-ray images with COVID-19, bacterial pneumonia, and normal was used to diagnose the COVID-19 automatically. This work to assess the execution of best in class Convolutional Neural Network (CNN) models proposed over ongoing years for clinical image classification. In particular, the modified pre-trained CNN-ResNet50 based Extreme Learning Machine classifier (ELM) has proposed for different diagnosis abnormalities such as COVID-19, Pneumonia, and normal. The proposed CNN method has trained and tested with the publicly available COVID-19, pneumonia, and normal datasets. The presented pre-trained ResNet CNN model provides accuracy, sensitivity, specificity, recall, precision, and F1 score values of 94.07, 98.15, 91.48, 85.21, 98.15, and 91.22, respectively, which is the best classification performance than other states of the art methods. This study introduced a computationally productive and exceptionally exact model for multi-class grouping of three diverse contamination types from alongside Normal people. This CNN model can help in the automatic diagnosis of COVID-19 cases and help decrease the burden on medicinal services frameworks.
Keywords: Automatic diagnosis, Coronavirus, COVID-19, Deep learning, Convolutional neural network, ResNet, Extreme learning machine
Introduction
The Coronaviruses were distinguished in the mid-1960s and are known to infect people and an assortment of creatures, including animals. Since 2002, two coronaviruses tainting creatures have developed and caused flare-ups in people: Severe Acute Respiratory Syndrome (SARS-CoV) recognized in southern China in 2003, and Middle East Respiratory Syndrome (MERS-CoV), distinguished in Saudi Arabia in 2012. Together, they have caused more than 1600 deaths (Liang et al. 2020). The Novel Coronavirus Disease (COVID-19) is an infectious disease realized by another infected person recognized by late 2019. The diseases cause respiratory disease with symptoms of fever, breathlessness, cough, fatigue, and loss of taste and smell. COVID-19 spreads primarily through contact with an infected person when they cough. It furthermore spreads when an individual contacts a surface or article with the disease on it, then contacts their eyes, nose, or mouth (Razai et al. 2020).
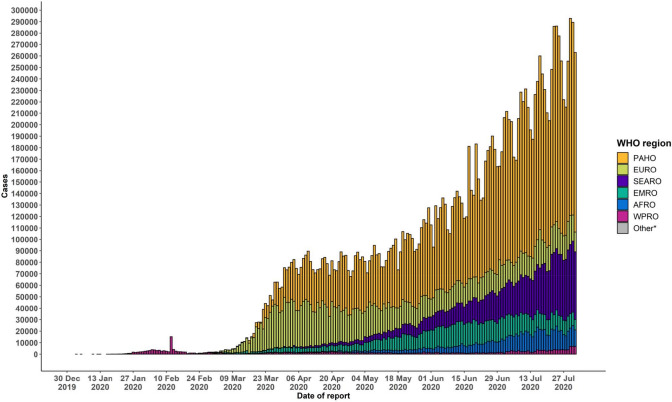
According to the World Health Organization (WHO) report, the total number of people infected by the disease as on 27 July 2020 is 16,114,449 and 646,641 deaths. Even in many developed countries, the health framework has concentrated on the business at hand of breakdown due to the extending enthusiasm for escalated care units at the same time. Dangerous consideration units are stacked up with patients who disintegrate with COVID-19 pneumonia. Epidemic curve of confirmed COVID-19, by date of the report and WHO region through 02 August 2020 has shown in Fig. 1 (Bai et al. 2020).
Fig. 1.
Epidemic curve of confirmed COVID-19 till 02 August, 2020
The general method for diagnosing COVID-19 is a reverse transcription-polymerase chain reaction. But it is a time-consuming process (Narin et al. 2020). Due to many COVID-19 infected persons, an automated diagnosis system is an urgent requirement in this pandemic situation. The chest X-ray imaging modality plays a vital role in diagnosing COVID-19 infected persons. Acquiring X-ray images is an easy process for radiologists using X-ray machines, which is available in all the hospitals and is the cheapest imaging modality (Abbas et al. 2020). In Figs. 2 and 3, delegate chest X-ray images of normal and COVID-19 patients are given exclusively (Ai et al. 2020).
Fig. 2.
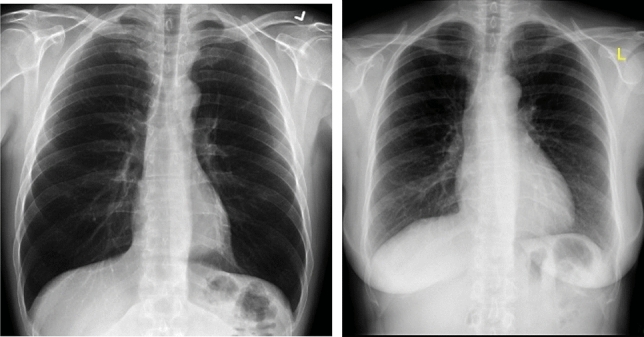
Sample normal chest X-ray images
Fig. 3.
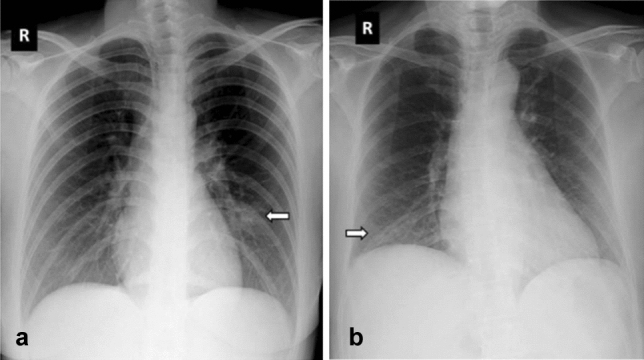
Sample COVID-19 chest X-ray images
The novelty of the proposed work as follows:
-
I.
Deep Learning-based Extreme Learning Machine (ELM) classifier has been used according to the chest X-ray images.
-
II.
The developed architecture utilizes random and unsupervised feature extraction using deep network and classification capability of ELM.
-
III.
There is no need for tuning of parameters of Deep Learning Networks or iteration for the training of architecture
Main contributions of the proposed work are summarized as below:
-
I.
A new deep learning network based on ELM is proposed, which is deeper and gives more accurate results compared to the state of the art deep learning networks.
-
II.
The proposed algorithm is non-iterative and therefore requires less training time than backpropagation based iterative training.
-
III.
The proposed model can be used as a pre-trained network for diagnosis of COVID-19 using chest X-ray images, which will be very helpful for the clinicians.
The manuscript is organized as follows: Related works are presented in Sect. 2. Materials and methodology are presented in Sect. 3. The experiments, results, and discussions are given in Sect. 4. Finally, in Sect. 5, the conclusion and the future works are presented.
Related works
Over the most recent couple of months, the Artificial Intelligence (AI)-based strategies for identifying and locating COVID-19 have been popular. This sub-section presents a literature review of COVID-19 diagnosis using chest x-ray images.
Narin et al. (2020) presented an ensemble CNN model such as ResNet50, InceptionV3, and Inception-ResNetV2 proposed for COVID-19 diagnosis utilizing chest X-rays images. The Transfer Learning method was utilized for training the ensemble network. Abbas et al. (2020) has proposed CNN architecture, called Decompose, Transfer, and Compose “DeTraC” to diagnose COVID-19 chest X-ray images. The TL has utilized for tuning the parameters of CNN. The results of “DeTraC” networks have presented using COVID-19 X-ray images from public datasets and few images collected from hospitals.
Afshar et al. (2020) introduced a Capsule Networks (rather than CNN), called as “COVID-CAPS” developed for screening small datasets, which is important because of the fast development of COVID-19 in the month of February 2020. The “COVID-CAPS” results have reported using X-ray images, and they compared with past CNN-based models. Apostolopoulos et al. (2020a) presented a CNN architecture for diagnosing real-time COVID-19 X-ray images. The CNN model has trained by TL and tested by various medical images. Apostolopoulos et al. (2020b) also proposed a CNN model called “MobileNet” to extract the features of COVID-19 X-ray images.
Farook et al. (2020) have contributed a publicly available COVID-19 dataset and developed a CNN architecture to classify COVID-19 images from the pneumonia cases. These method has utilized a data augmentation process such as image resizing, pattern matching, and automatic learning rate assignment before the training process. Gozes et al. (2020) have built an AI model using the DL algorithm, and also this work has also introduced a computer-aided framework called “Corona score” to find the infected rate of COVID-19 patients.
Hemdan et al. (2020) has proposed a deep CNN called “COVID-Net” using VGG19 for diagnosing COVID-19 X-ray images. These proposed framework has modified by “Google MobileNet” for identifying the positive and negative cases of COVID-19. Jin et al. (2020a, b) has proposed an AI framework for fast COVID-19 screening. This method has utilized 970 positive and 496 negative X-ray images for both training and testing the network.
Khan et al. (2020) has proposed a DL network are called “CoroNet” for COVID-19 detection and diagnosis. These networks have tested by two publicly available datasets, which include both COVID-19 and pneumonia images. A TL based AI tool has developed by Maghdid et al. (2020) for COVID-19 diagnosis. These network has tested by both X-ray and CT scan images. Furthermore, this architecture has modified by pre-trained AlexNet.
Ghooshal et al. (2020) has investigated the uncertainty estimation in DL network output using “Bayesian CNN” for COVID-19 detection. Zhang et al. (2020) has proposed a classification task form ‘Viral pneumonia” to “Non-Viral pneumonia” image using a “one-class classification based anomaly detection (CAAD)” model. These CADD model which includes feature extraction, an anomaly finding, and prediction modules. Then viral pneumonia has predicted if the produced anomaly score has high or the prediction score has less.
A “tailored DL network” called “COVID-Net” has proposed by Wang et al. (2020) for COVID-19 detection. It is the open-source DL network design for COVID-19 screening. Wang et al. (2020) also contributed a freely accessible dataset called “COVIDx” which is the largest COVID-19 X-ray dataset. Ozturk et al. (2020) has proposed a three-class classification network called “DarkCOVIDNet” using an advanced AI technique. The classification, which includes COVID-19, pneumonia, and no-findings, has done by “multi-class classification techniques".
In summary, all these studies have been proposed for X-ray based COVID-19 diagnosis using CNNs, which are inclined to a significant disadvantage even though being incredible images handling systems. As a limitation, they cannot identify the unique relations between image examples. Because of this lack of ability, CNN cannot perceive a similar item when it has turned or, then again, subject to another sort of change. Receiving a larger dataset, including all the potential changes, is the result of this issue. Nonetheless, in imaging issues, counting the COVID-19 screening, big datasets are most certainly not adequately available. Correctly, COVID-19 has been recognized recently, and enormous enough datasets are not yet evolved. The proposed Extreme Learning Machine based Deep Convolutional Network (E-DiCoNet) is an alternative model capable of diagnosing COVID-19 without a vast dataset since the E-DiCoNet technique capturing spatial information coming from instances and object parts using potential changes in the existence of the objects.
Materials and methodology
Dataset
Chest X-ray images of COVID-19, normal, and pneumonia collected from the publicly available repositories (Chest imaging 2020; SIRM COVID-19 database 2020; Chen et al. 2020; Wang et al. 2020; Kong et al. 2020; Mooney et al. 2018) are used in this work. These investigations have been driven all together of 2700 images, in which 900 images for each class. The resolution of all images is set to 224 × 224 × 3 pixel size. The details of the images are stated in Table 1.
Table 1.
Dataset used in this study
| Dataset | Images category | No. of images |
|---|---|---|
| Chest imaging (Chest imaging 2020) | COVID-19 | 134 |
| COVID-19 (SIRM COVID-19 database 2020) | COVID-19 | 64 |
| COVID-chest X- ray (Chen et al. 2020) | COVID-19 | 646 |
| Figure 1 COVID-19 Chest X-ray (Wang et al. 2020) | COVID-19 | 55 |
| Provincial peoples hospital (Kong et al. 2020) | COVID-19 | 1 |
| Kaggle (Mooney et al. 2018) | Normal | 900 |
| Kaggle (Mooney et al. 2018) | Pneumonia | 900 |
| Total | 2700 |
Workflow
Deep Learning Networks (DLN) comprises many layers and therefore exhibits complex and invariant feature extraction capability from the raw image than other shallow neural networks. Therefore, to efficiently leverage DLN's feature extraction capability, a pre-trained deep learning model is used in the proposed work as a feature extractor. Feature extractor follows the ELM with a sigmoid activation function to classify the COVID-19, normal, and pneumonia images. Several pre-trained DLN has gained popularity in literature, such as AlexNet, GoogleNet, ResNet, VGG, and Inception. ResNet-50 is used for feature extraction in the proposed work. The workflow of the proposed model is shown in Fig. 4.
Fig. 4.
Workflow of the proposed methodology
Deep learning network with ELM based classifier (DLN-ELM)
DLN with ELM classifier weights the feature extraction performance of DLN with ELM's fast training and good performance. As shown in Fig. 4, DLN-ELM model consists of an input layer, several hidden layers which are convolutional layer (CL) followed by pooling layer and classifier. CL consists of several kernel filters that are convolved with the previous layer’s local receptive fields. CL acts as the main feature extractor by applying convolution at all possible offsets. CL layer is followed by a pooling layer to downsample the size of the feature map.
After feature extraction using DLN, they are fed to the ELM classifier. ELM uses only a single layer of hidden neurons in which weights and biases are randomly initialized. Output weights are analytically calculated using the generalized least square method, as given in Eq. (1).
| 1 |
Here, is the weight of the output layer, is the pseudo inverse of the output of the hidden layer, and is the target matrix.
In the proposed network, there is no need for iterative tuning of the weights and biases; they are randomly initialized and give better performance results then Soft-max and SVM classifiers.
Experiments
Implementation details
The proposed algorithm is written and computed in MATLAB 2018b (R9.5) and executed using system configuration of Dell Alienware, i7 6th gen, GTX 1080 GPU, 64 GB DDR4 RAM. The proposed method was tested for normal, pneumonia, and COVID-19 images using the publicly available datasets.
Training
In the training phase, a modified ResNet-50 pre-trained DLN network has proposed. Resnet-50 contains 50 convolutional layers. For training, 70% of total images (2430) are used for training, and the rest 30% of images (270) are used for testing purposes. Dataset is partitioned randomly for training and test images. Data augmentation is used to resize all the images to 224 × 224 × 3 and convert grayscale images into color images. Features are extracted just before the DLN classification layer using activations method, and mini-batch size for feature extraction is set to ‘32’. The output features are fed to ELM for classification. ELM consists of one hidden layer whose weights and biases are initialized randomly and one output layer. The sigmoid activation function is used at the hidden layer to map the features in non-linear space, and the number of hidden units is equal to ‘5000’. The size of the output layer is 3 for three classes: Normal, Pneumonia, and COVID-19. Output weights are calculated by taking pseudo-inverse of the output of the hidden layer. The parameters used for training the networks are given in Table 2, and the sample training images are given in Fig. 5.
Table 2.
Network parameters
| Pre-trained network | Number of layers | Classifier | Activation function or ELM | Number of hidden neurons of ELM | Mini-batch size | Output size |
|---|---|---|---|---|---|---|
| ResNet-50 | 179 | ELM | Sigmoid | 5000 | 32 | 3 |
Fig. 5.
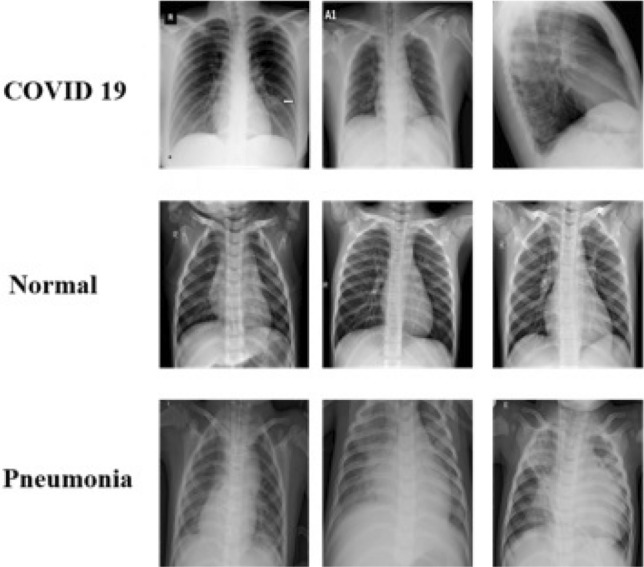
Sample training images
Testing
During the testing time, given the trained DLN-ELM model and a test image. First, the image is resized to 224 × 224 × 3 and converted into a color image. Test image features are also extracted from the last layer of DLN. These features are fed to ELM for classification into the appropriate class. First, these features are transformed into a non-linear space using a sigmoid activation function and then multiplied by the output weights obtained during the training phase. For ELM, 50 trials are done, and accuracy is calculated by taking the average of 50 random trials. The sample testing images are given in Fig. 6.
Fig. 6.
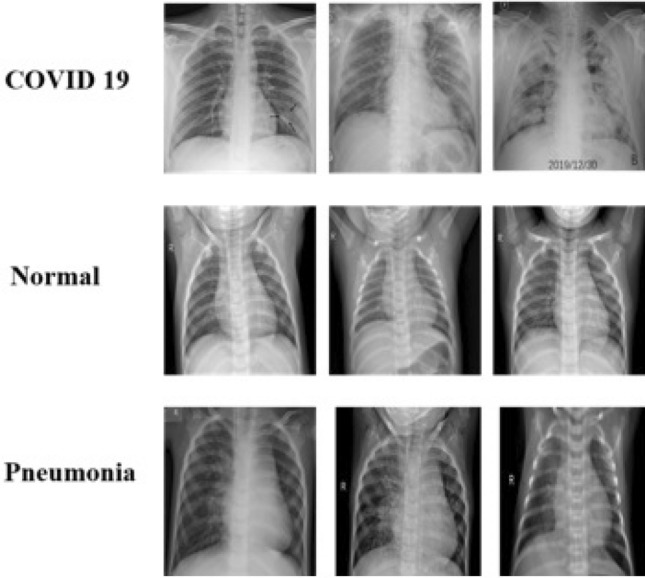
Sample testing images
Evaluation metrics and performance indicators
This sub-section presents performance indicators such as and evaluation metrics such as sensitivity, specificity, recall, precision, and F1 score values of the proposed methodology to classify the images into COVID-19, normal, and pneumonia. The proposed method has validated using the performance metrics of provides accuracy, sensitivity, specificity, precision, F1 Score values, and Receiver Operating Characteristic (ROC) for verifying validating the result from the actual case.
Accuracy
The number of corrected instances over the total number of cases. It is expressed in Eq. (2).
| 2 |
where TP indicates True Positive; TN indicates True Negative; FP indicates False Positive; FN indicates False Negative.
A TP is a result where the model effectively predicts the positive class. So also, a TN is a result where the model effectively predicts the negative class. An FP is a result where the model inaccurately predicts the positive class. What's more, an FN is a result where the model inaccurately predicts the negative class.
Sensitivity
It measures the fraction of accurately classified positive instances. It is defined in Eq. (3).
| 3 |
Specificity
It is the measure of the fraction of negative occasions. It is defined in Eq. (4).
| 4 |
Precision
It is the measure of the fraction of relevant instances among the retrieved cases and called a positive predictive value), defined in Eq. (5).
| 5 |
F1 score
It is a measure of a test’s accuracy and defined as the weighted harmonic mean of the test’s precision and recall, represented in Eq. (6).
| 6 |
Receiver operating characteristics (ROC)
It is the graphical representation of the performance execution of classification methods for all limits. This curve utilizes two parameters to be specific, false positive and true positive rate or specificity and sensitivity. These are stated in Eqs. (7) and (8).
| 7 |
| 8 |
Experimental results
The proposed method has tested for normal, pneumonia, and COVID-19 chest X-ray images using the publicly available datasets. The proposed algorithm has produced better performance metrics such as accuracy, sensitivity, specificity, recall, precision, and F1 score values of 94.07, 98.15, 91.48, 85.21, 98.15, and 91.22, respectively. The performance metrics are presented in Table 3.
Table 3.
Performance metrics of the proposed method
| Accuracy | Sensitivity | Specificity | Recall | Precision | F1 score |
|---|---|---|---|---|---|
| 94.07 | 98.15 | 91.48 | 85.21 | 98.15 | 91.22 |
Receiver operating characteristics (ROC) and confusion matrix
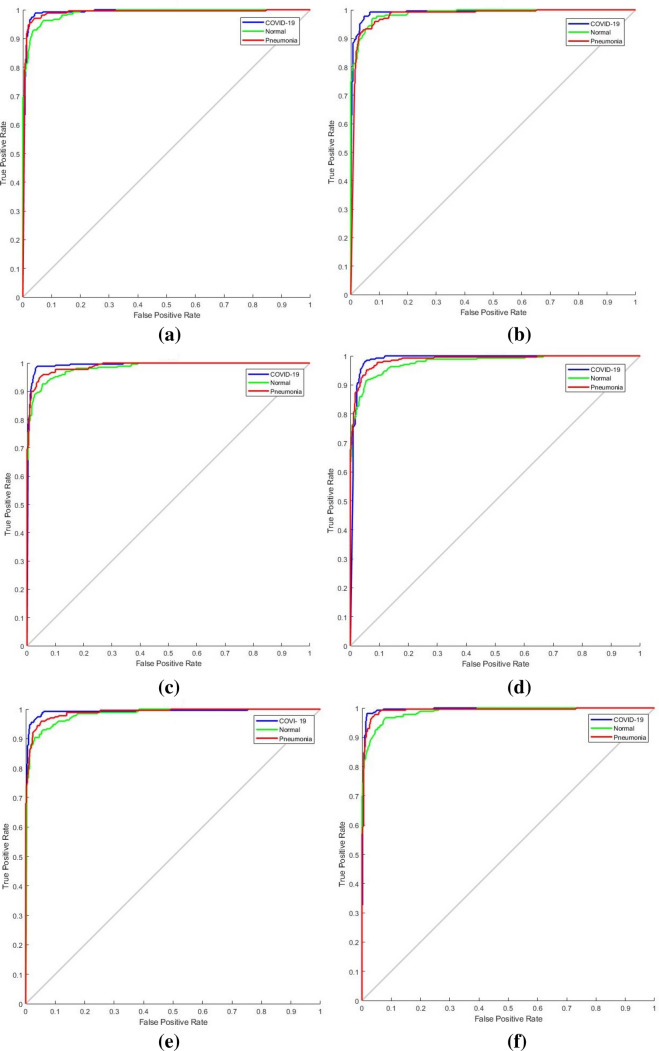
The ROC curve (shown in Fig. 7) and the confusion matrix (shown in Fig. 8) has generated for the proposed method to analyze the effectiveness of the classification. With the application of the proposed methodology in 270 testing chest X-ray images, 98.15% were classified within the class of COVID-19, 87.4% were classified within the class of normal images and 95.93% were classified within pneumonia images. The highlight of the proposed classification method is more classification accuracy has achieved in COVID-19 images. Hence this E-DiCoNet has been used to automatic diagnosis of COVID-19.
Fig. 7.
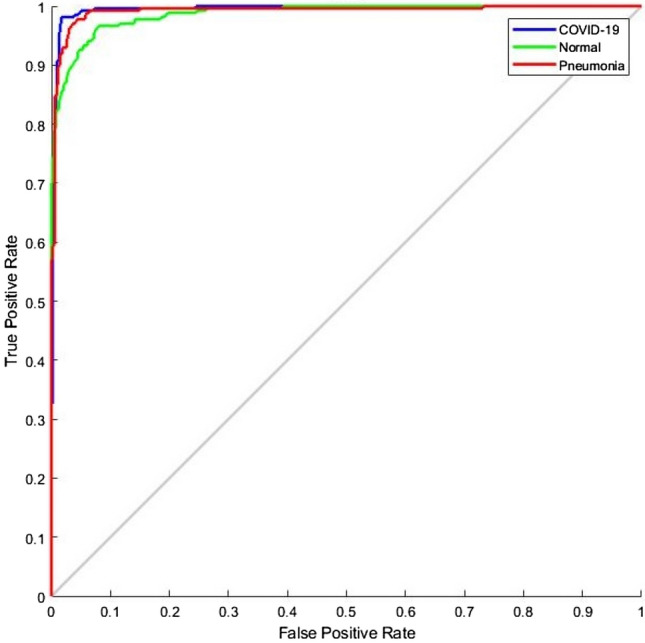
Generated ROC
Fig. 8.
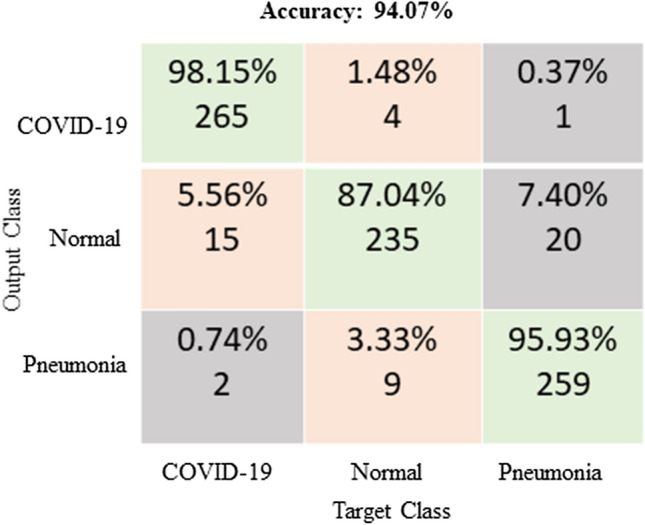
Confusion matrix
Performance analysis
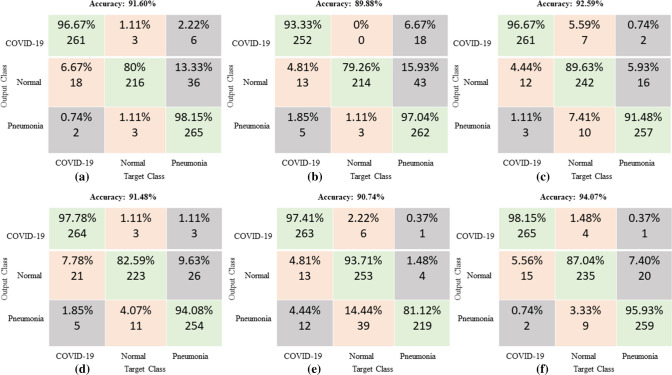
The proposed work has been validated with five standard pre-trained networks such as ResNet, GoogleNet, InceptionNet, SqueezeNet, AlexNet. For training of DL networks, 70% of the data is used for training, and the rest 30% data is used for testing. The performance metrics such as accuracy, specificity, sensitivity, precision, and F1 score has been analyzed and reported in Table 4. Comparison in terms of the confusion matrix and of ROC are presented in Figs. 8, 9 and 10. The proposed E-DiCoNet provides the best performance values from all these analyses and comparisons to other pre-trained networks. Therefore, the proposed network can be reliably used to diagnose COVID-19 for real-time applications.
Table 4.
Performance analysis with pre-trained networks
| Method | Accuracy | Sensitivity | Specificity | Recall | Precision | F1 score |
|---|---|---|---|---|---|---|
| ResNet50 | 91.60 | 96.67 | 89.07 | 81.56 | 96.67 | 88.47 |
| GoogleNet | 89.88 | 93.33 | 88.15 | 79.75 | 93.33 | 86.01 |
| InceptionNet | 92.59 | 96.67 | 90.56 | 83.56 | 96.67 | 89.69 |
| SqueezeNet | 91.48 | 97.78 | 88.33 | 80.73 | 97.78 | 88.44 |
| AlexNet | 90.74 | 97.41 | 87.41 | 79.46 | 97.41 | 87.52 |
| Proposed algorithm | 94.07 | 98.15 | 91.48 | 85.21 | 98.15 | 91.22 |
Fig. 9.
Confusion matrix of (a) ResNet (b) GoogleNet (c) InceptionNet (d) SqueezNet (e) AlexNet (f) Proposed
Fig. 10.
ROC of (a) ResNet (b) GoogleNet (c) InceptionNet (d) SqueezNet (e) AlexNet (f) Proposed
Comparative analysis
This sub-section presents the comparative analysis of the proposed methodology to classify the images into COVID-19, normal, and pneumonia. Then comparisons are made with different Activation Functions of ELM, other states-of-the-art methods, based on the dataset and based on running time using the performance as mentioned earlier metrics. The analysis of the proposed work is given at the end of this sub-section as well.
Comparison with different activation functions of ELM
Activation function (AF) is mathematical representations that decide the output of a neural system. AF helps standardize every neuron’s output to a range somewhere in the range of 1 and 0 or between −1 and 1. The proposed works have been compared with five standards AF to classify the performance apart from Sigmoid. These are the radial basis, hard limit, hyperbolic tan, triangular basis, and sine. A comparison of all these AF has done using metrics: accuracy, specificity, sensitivity, recall, precision, and F1 score is given in Table 5. From all these comparisons, the selected Sigmoid AF provides the best performance values compared to other AF.
Table 5.
Comparison with different activation functions of ELM
| AF | Accuracy | Sensitivity | Specificity | Recall | Precision | F1 score |
|---|---|---|---|---|---|---|
| Radial basis | 89.14 | 97.04 | 85.19 | 76.61 | 97.04 | 85.62 |
| Hard limit | 91.98 | 96.30 | 89.81 | 82.54 | 96.30 | 88.89 |
| Hyperbolic tan | 92.84 | 96.67 | 90.93 | 84.19 | 96.67 | 90.00 |
| Triangular-basis | 87.78 | 95.19 | 84.07 | 74.93 | 95.19 | 83.85 |
| Sine | 32.35 | 35.56 | 30.74 | 20.43 | 35.50 | 25.95 |
| Proposed algorithm | 94.07 | 98.15 | 91.48 | 85.21 | 98.15 | 91.22 |
Comparisons of the proposed method with the state of the arts
This sub-section presents the performance comparisons with the state-of-the-art. The acquired performance parameters are best in class approaches as condensed in Table 4. The advantage of the proposed method is; it is parameter-free. Hence, no tuning is required for different databases, dissimilar to different model-based methodologies, as Hemdan et al. (2020), Khan et al. (2020), Xu et al. (2020), Ghoshal et al. (2020), Wang et al. (2020), Ozturk et al. (2020). The specialists Narin et al. (2020), Abbas et al. (2020), Afshar et al. (2020), Jin et al. (2020a, b), Maghdid et al. (2020), Ioannis et al. (2020) accomplished a marginally good performance metrics. However, the number of images has been used in the proposed method is more. By and large, the proposed approach produced better results than other cutting edge techniques (Table 6).
Table 6.
Comparisons of the proposed method
| References | Methods | Accuracy | Sensitivity | Specificity | Recall | Precision | F1score |
|---|---|---|---|---|---|---|---|
| Narin et al. (2020) | CNN- ensemble | 94 | – | – | – | – | – |
| Abbas et al. (2020) | DCNN | – | 97.91 | 91.87 | – | 93.36 | – |
| Afshar et al. (2020) | COVID-CAPS | 95.7 | 90 | 95.8 | – | – | – |
| Hemdan et al. (2020) | COVIDX-Net | 90 | – | – | – | – | 91 |
| Shuo Jin et al. (2020a, b) | CNN-Ensemble | – | – | – | 97.4 | 92.2 | |
| Jin et al. (2020a, b) | CNN | 94 | 94.06 | 95.47 | |||
| Khan et al. (2020) | CoroNet | 89.5 | 97 | 100 | – | – | – |
| Maghdid et al. (2020) | CNN-AlexNet | 94 | – | – | – | – | – |
| Xu et al. (2020) | CNN ResNet18 | 86.7 | – | – | – | – | – |
| Song et al. (2020) | CNN-ResNet50 | 93 | – | – | – | – | – |
| Zheng et al. (2020) | CNN | – | 90.7 | 91.1 | – | – | – |
| Ghoshal et al. (2020) | CNN | 92.9 | – | – | – | – | |
| Wang et al. (2020) | CNN | 83.5 | – | – | – | – | – |
| Apostolopoulos, et al. (2020) | VGG-19 | 93.48 | – | – | – | – | – |
| Ozturk et al. (2020) | DarkCovidNet | 87.02 | – | – | – | – | – |
| Proposed | E-DiCoNet | 94.07 | 98.15 | 91.48 | 85.21 | 98.15 | 91.22 |
Comparison based on the dataset and other ResNet methods
This sub-section presents the various comparative analysis, such as accuracy with other methods on the dataset (shown in Fig. 11), accuracy with other ResNet methods (shown in Fig. 12), sensitivity, and specificity values with other ResNet methods (shown in Fig. 13). Compared with a newly published CNN architecture such as Narin et al. (2020), Ghoshal et al. (2020), where the same dataset from GitHub and Kaggle used, the proposed method has achieved better accuracy value. In addition, the comparison with a newly published ResNet50 architecture such as Xu et al. (2020), Song et al. (2020), where the proposed method has achieved better accuracy value. Furthermore, the comparison with a recently reported CNN architecture such as Abbas et al. (2020), Zhang et al. (2020) where the proposed method has achieved better sensitivity and specificity values. Finally, the E-DiCoNet proposed in this study shows promising results to be used to detect COVID-19 despite the more number of images used in the current investigation. Moreover, it should be noted that the E-DiCoNet model proposed in this work is a very simple, effective for diagnosing COVID-19.
Fig. 11.
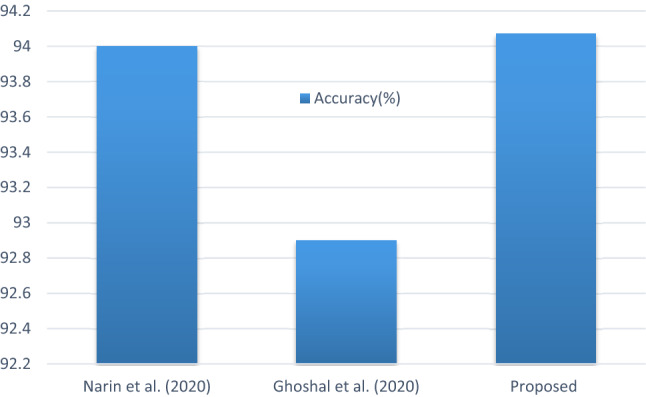
Comparison of accuracy with other methods on dataset
Fig. 12.
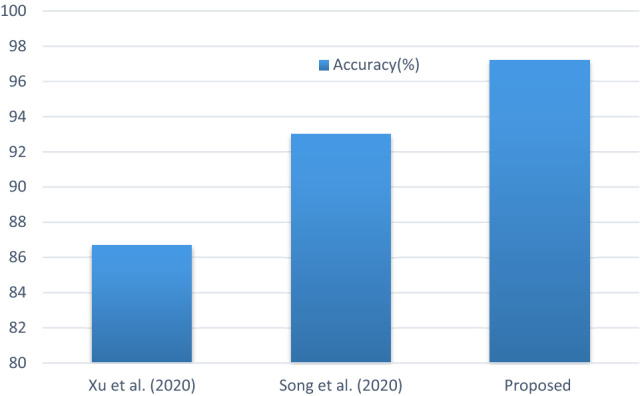
Comparison of accuracy with other ResNet methods
Fig. 13.
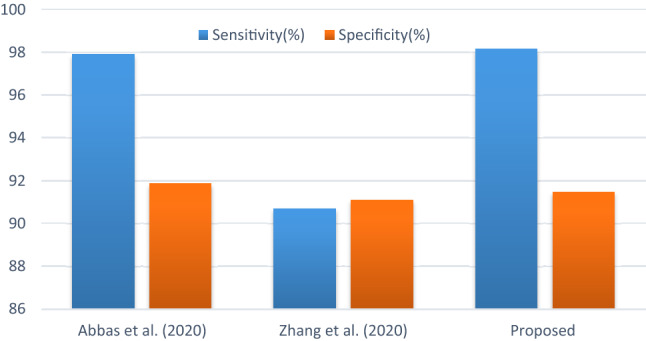
Comparison of sensitivity and specificity values with other CNN methods
Comparison based on time consumption
Table 7 shows the comparison of time consumption with the state-of-the-art (Hemden et al. 2020) and the proposed method. The time consumption of both training and testing are very short because of the GPU (Hemden et al. 2020). In the proposed method, the training time required for data augmentation, feature extractions using transfer learning and training ELM's weights and biases is 280.5 s for training 630 X-ray images. For testing of X-ray image using pre-trained E-DiCoNet is only 2.5 s. Among all the classifiers, the proposed classifier training and testing time is less. Hence the proposed E-DiCoNet to be used for COVID-19 diagnosis.
Table 7.
Comparison based on time consumption with classification accuracy
| Classifier | Training time (seconds) | Testing time (seconds) | Accuracy (%) |
|---|---|---|---|
| DenseNet201 | 2122 | 6 | 90 |
| ResNetV2 | 1086 | 2 | 70 |
| InceptionV3 | 1121 | 2 | 50 |
| InceptionResNetV2 | 1988 | 6 | 80 |
| VGG19 | 2641 | 4 | 90 |
| Xception | 2035 | 3 | 80 |
| Proposed (E-DiCoNet) | 280.5 | 2.5 | 94.07 |
Analysis of the proposed method
In the proposed study, the highest number of images have been used with ResNet50 and ELM classifiers for better execution. The total 2700 images were used to build the model, which comprises different layer architecture. The model accomplished the best execution learning rate by step by step, catching details features minutely from the learning images. Another factor that influenced the outcomes is the size of the images. The finely details data might be lost when fewer size images are taken care of to ResNet50, prompting horrible performance. When the quantity of image input tests is increasing, accepting a less size image as input is moderate as the system will prepare with a more prominent number of images. Taking a higher size input image will take more computational time. It is seen that the size of the image of 224 × 224 × 3 is an appropriate size for our model, which brings the best execution for the proposed architecture.
Moreover, our model comprises various measured kernels, which catches minute changes and lifts the model’s general execution. The implemented architecture achieved better sensitivity, which confirms that the technique recognizes practically all COVID-19 cases as COVID-19. Hence our strategy is the best in the class diagnosis of COVID-19 images with other state-of-the-art methods.
Conclusions
In this paper, a deep convolutional neural network-based ELM classifier model is called E-DiCoNet has been proposed to diagnose the COVID-19, normal, and pneumonia from chest X-ray scanned images. The E-DiCoNet has trained and tested with publicly available X-ray image datasets. The proposed E-DiCoNet has been obtained the best performance metrics such as accuracy, sensitivity, specificity, recall, precision, and F1 score. Therefore the proposed E-DiCoNet algorithm may be applied to a medical application for accurate COVID-19 diagnosis. It will help the medical professionals to handle the ongoing pandemic situation worldwide.
Acknowledgements
The authors acknowledge the authors of Chest imaging, COVID-19, Covid-chestxray, Figure 1 COVID-19 Chest X-ray, Provincial peoples hospital and Kaggle datasets for making publicly online. The authors also acknowledge the medical imaging laboratory of Computer Science and Engineering Department, National Institute of Technology Silchar, Assam for providing the necessary facilities to carry out this work.
Code availability
The source code of E-DiCoNet is publicly available at https://github.com/biomedicallabecenitsilchar/E-DiCoNet.
Compliance with ethical standards
Conflict of interest
The authors declare no conflict of interest.
Ethical approval
This article does not contain any studies with human participants performed by any of the authors. This article does not contain any studies with animals performed by any of the authors. This article does not contain any studies with human participants or animals performed by any of the authors.
Informed consent
There is no individual participant included in the study.
Footnotes
Publisher's Note
Springer Nature remains neutral with regard to jurisdictional claims in published maps and institutional affiliations.
Contributor Information
R. Murugan, Email: murugan.rmn@ece.nits.ac.in
Tripti Goel, Email: triptigoel@ece.nits.ac.in.
References
- Abbas A, Abdelsamea MM, Gaber MM (2020) Classification of COVID-19 in chest X-ray images using DeTraC deep convolutional neural network [DOI] [PMC free article] [PubMed]
- Afshar P, Heidarian S, Naderkhani F, Oikonomou A, Plataniotis KN, Mohammadi A (2020) COVID-CAPS: a capsule network-based framework for identification of COVID-19 cases from X-ray Images [DOI] [PMC free article] [PubMed]
- Ai T, Yang Z, Hou H, Zhan C, Chen C, Lv W, Xia L (2020) Correlation of chest CT and RT-PCR testing in coronavirus disease 2019 (COVID-19) in China: a report of 1014 cases. Radiology 2019:200642 [DOI] [PMC free article] [PubMed]
- Apostolopoulos ID, Mpesiana TA (2020) Covid-19: automatic detection from X-ray images utilizing transfer learning with convolutional neural networks. Physical and Engineering Sciences in Medicine 1 [DOI] [PMC free article] [PubMed]
- Apostolopoulos I, Aznaouridis S, Tzani M (2020) Extracting possibly representative COVID-19 biomarkers from X-Ray images with deep learning approach and image data related to pulmonary diseases [DOI] [PMC free article] [PubMed]
- Bai Y, Yao L, Wei T, Tian F, Jin DY, Chen L, Wang M (2020) Presumed asymptomatic carrier transmission of COVID-19. JAMA [DOI] [PMC free article] [PubMed]
- Cohen JP, Morrison P, Dao L, Roth K, Duong TQ, Ghassemi M (2020) COVID-19 Image data collection: prospective predictions are the future
- Farooq M, Hafeez A (2020) Covid-resnet: a deep learning framework for screening of covid19 from radiographs
- Ghoshal B, Tucker A (2020) Estimating uncertainty and interpretability in deep learning for coronavirus (COVID-19) detection
- Gozes O, Frid-Adar M, Greenspan H, Browning PD, Zhang H, Ji W, Siegel E (2020) Rapid AI development cycle for the coronavirus (covid-19) pandemic: Initial results for automated detection & patient monitoring using deep learning CT image analysis
- Hemdan EED, Shouman MA, Karar ME (2020) Covidx-net: A framework of deep learning classifiers to diagnose covid-19 in x-ray images
- Chest Imaging (2020) This is a thread of COVID-19 CXR (all SARS-CoV-2 PCR+) from my hospital (Spain), Version 1. https://twitter.com/ChestImaging/status/1243928581983670272
- Jin C, Chen W, Cao Y, Xu Z, Zhang X, Deng L, Feng J (2020) Development and evaluation of an AI system for COVID-19 Diagnosis. medRxiv [DOI] [PMC free article] [PubMed]
- Jin S, Wang B, Xu H, Luo C, Wei L, Zhao W, Sun W (2020) AI-assisted CT imaging analysis for COVID-19 screening: Building and deploying a medical AI system in four weeks. medRxiv. [DOI] [PMC free article] [PubMed]
- Khan AI, Shah JL, Bhat M (2020).CoroNet: a deep neural network for detection and diagnosis of COVID-19 from chest X-ray images [DOI] [PMC free article] [PubMed]
- Kong W, Agarwal PP (2020) Chest imaging appearance of COVID-19 infection. Radiology: Cardiothoracic Imaging 2(1):1–22 [DOI] [PMC free article] [PubMed]
- Liang T (2020) Handbook of COVID-19 prevention and treatment. The First Affiliated Hospital, Zhejiang University School of Medicine. Compiled According to Clinical Experience
- Maghdid HS, Asaad AT, Ghafoor KZ, Sadiq AS, Khan MK (2020) Diagnosing COVID-19 pneumonia from X-ray and CT images using deep learning and transfer learning algorithms
- Mooney P (2018) Chest X-Ray Images (Pneumonia), Version 2. Retrieved may 05, 2020, from https://www.kaggle.com/paultimothymooney/chest-xray-pneumonia/metadata
- Narin A, Kaya C, Pamuk Z (2020) Automatic detection of coronavirus disease (COVID-19) using x-ray images and deep convolutional neural networks [DOI] [PMC free article] [PubMed]
- Ozturk T, Talo M, Yildirim EA, Baloglu UB, Yildirim O, Acharya UR. Automated detection of COVID-19 cases using deep neural networks with X-ray images. ComputBiol Med. 2020;121:1–11. doi: 10.1016/j.compbiomed.2020.103792. [DOI] [PMC free article] [PubMed] [Google Scholar]
- Razai MS, Doerholt K, Ladhani S, Oakeshott P (2020) Coronavirus disease 2019 (COVID-19): a guide for UK GPs. BMJ, 368 [DOI] [PubMed]
- SIRM COVID-19 Database (2020) Italian Society of Medical and Interventional Radiology COVID-19 dataset, Version 1. Retrieved may 05, 2020, from https://www.sirm.org/category/senza-categoria/covid-19/
- Song Y, Zheng S, Li L, Zhang X, Zhang X, Huang Z, Chong Y (2020) Deep learning enables accurate diagnosis of novel coronavirus (COVID-19) with CT images. medRxiv [DOI] [PMC free article] [PubMed]
- Wang L, Wong A (2003) COVID-Net: A tailored deep convolutional neural network design for detection of COVID-19 cases from chest X-ray images. 2020 Mar 22 [DOI] [PMC free article] [PubMed]
- Wang L, Wong A, Lin ZQ, Lee J, McInnis P, Chung A, Ross M, VanBerlo B, Ebadi A (2020) Figure 1 COVID-19 Chest X-ray Dataset Initiative, version 1, Retrieved may 05, 2020, from https://github.com/agchung/Figure1-COVID-chestxray-dataset
- Xu X, Jiang X, Ma C, Du P, Li X, Lv S, Li Y (2020) Deep learning system to screen coronavirus disease 2019 pneumonia [DOI] [PMC free article] [PubMed]
- Zheng C, Deng X, Fu Q, Zhou Q, Feng J, Ma H, Wang X (2020) Deep learning-based detection for COVID-19 from chest CT using weak label. medRxiv
Associated Data
This section collects any data citations, data availability statements, or supplementary materials included in this article.
Data Availability Statement
The source code of E-DiCoNet is publicly available at https://github.com/biomedicallabecenitsilchar/E-DiCoNet.


