

Abstract
SOX9 plays an important role in chondrocyte differentiation and, in the developing axial skeleton, maintains the notochord and the demarcation of intervertebral disc compartments. Diminished expression is linked to campomelic dysplasia, resulting in severe scoliosis and progressive disc degeneration. However, the specific functions of SOX9 in the adult spinal column and disc are largely unknown. Accordingly, employing a strategy to conditionally delete Sox9 in Acan-expressing cells (AcanCreERT2Sox9fl/lf), we delineated these functions in the adult intervertebral disc. AcanCreERT2Sox9fl/lf mice (Sox9cKO) showed extensive and progressive remodeling of the extracellular matrix in nucleus pulposus (NP) and annulus fibrosus (AF), consistent with human disc degeneration. Progressive degeneration of the cartilaginous endplates (EP) was also evident in Sox9cKO mice, and it preceded morphological changes seen in the NP and AF compartments. Fate mapping using tdTomato reporter, EdU chase, and quantitative immunohistological studies demonstrated that SOX9 is crucial for disc cell survival and phenotype maintenance. Microarray analysis showed that Sox9 regulated distinct compartment-specific transcriptomic landscapes, with prominent contributions to the ECM, cytoskeleton-related, and metabolic pathways in the NP and ion transport, the cell cycle, and signaling pathways in the AF. In summary, our work provides new insights into disc degeneration in Sox9cKO mice at the cellular, molecular, and transcriptional levels, underscoring tissue-specific roles of this transcription factor. Our findings may direct future cell therapies targeting SOX9 to mitigate disc degeneration.
Keywords: Intervertebral disc degeneration, extracellular matrix, Sox9, mouse model, nucleus pulposus, annulus fibrosus
Introduction
Chronic low back pain (cLBP) and neck pain are ubiquitous pathological conditions imposing immense healthcare and socioeconomic burdens [1]. These conditions are the leading causes of disability worldwide, with cLBP ranked as the first and neck pain as the fourth conditions contributing to years lived with disability [2, 3]. While cLBP has a multifactorial pathology, it has been intricately linked with the health of the intervertebral disc; patients with disc degeneration are 3.2 times more likely to suffer from cLBP [4, 5]. Characterized as a polyaxial, diarthrodial joint, the intervertebral disc is comprised of an inner, proteoglycan-rich nucleus pulposus (NP), surrounded by a collagenous annulus fibrosus (AF), and anchored inferiorly and superiorly to adjacent vertebrae by hyaline, cartilaginous endplates (EP), which allow diffusion between vascularized vertebrae and the avascular discs [6, 7]. Within the hypoxic niche of the NP, a high concentration of aggrecan hydrates the tissue, conferring a high osmotic swelling pressure to counteract the compressive forces exerted by mechanical loading on the spine [8]. Disc degeneration is characterized by discrete cellular and structural changes, but changes in ECM composition and organization are common to all compartments [9, 10]. Consequently, delineating the mechanisms regulating homeostatic maintenance of the disc ECM is critical to our understanding of degenerative processes afflicting the spine [11–14]. Of particular interest is the transcription factor SOX9, known for its functions in cartilaginous tissues, many of which coincide with the ECM-related genes critical to disc health [15].
SOX9 was first noted in skeletogenic mesenchymal progenitors for its role in fate determination and differentiation within the chondrocyte lineage [16]. It features a highly conserved SRY-related high-mobility-group-box DNA-binding domain, the shared characteristic of the SOX family of cell type-specific transcription factors [17, 18]. Conditional deletion of Sox9 in Prx1-expressing mesenchymal progenitors of the limb bud results in cell death and subsequent failure of precartilaginous condensation [16, 19]. Furthermore, inactivation of Sox9 during early stages of chondrogenesis in Col2Cre-expressing chondrocytes showed that cells are unable to express SOX9 targets, including Col2a1 and Acan (encoding the aggrecan core protein) [15, 20, 21]. Observations made in the notochord during axial skeletogenesis complement the findings in chondrocytic cells; Sox9 deletion prevents matrix-rich peri-notochordal sheath formation and results in notochordal cell death [17]. Further, it is suggested that SOX9 regulates cell survival and differentiation in the inner AF during disc development [22]. These studies affirm that SOX9 is critical in cartilage formation and vertebral column development [21, 23].
The role of SOX9 in the post-natal maintenance of the intervertebral disc was briefly explored [24]. Henry et al. showed that Sox9 deletion in Acan-expressing cells of adult mice results in proteoglycan loss, disc compression, and downregulation of various ECM-related genes [24]. Though this study demonstrated SOX9 is crucial for adult disc health, key aspects of the phenotype and mechanistic links between Sox9 deletion and these observations remain unknown. We therefore analyzed temporal changes in the spinal phenotype of AcanCreERT2Sox9fl/fl mice with conditional deletion of Sox9 at skeletal maturity. Our work clearly demonstrates that SOX9 mutant mice experience early-onset, progressive disc degeneration characterized by increased cell death, alterations in ECM organization, and distinct transcriptomic changes in the NP and AF compartments. This work enhances our understanding of SOX9 function in the intervertebral disc, with relevance to human degenerative disc diseases, and provides new insights into the tissue-specific roles of SOX9 in the skeletal system.
Results
Sox9 deletion in Acan-expressing cells of skeletally mature mice causes progressive disc degeneration and vertebral bone changes
Postnatal Sox9 deletion results in gross degenerative changes in the spine [24]. To develop a thorough understanding of the morphological alterations and underlying cellular and molecular mechanisms, 3-month-old AcanCreERT2Sox9fl/fl (Sox9cKO) and Sox9fl/fl (Sox9CTR) mice were injected with tamoxifen [25, 26]. The Acan-CreERT2 driver is highly efficient for targeting of all three disc compartments in adult mice [26–28]. Safranin O/Fast Green staining of lumbar discs showed that up to 1 month post deletion (4-month-old), Sox9cKO animals maintained their disc architecture but evidenced proteoglycan loss and disorganization of the vertebral growth plates (GP) (Fig. 1A–C’). In contrast, at 2 months post deletion (5-month-old), proteoglycan loss and fibrotic remodeling of the NP, buckling of the AF lamellae, and loss of demarcation between the NP and AF were apparent (Fig. 1D, D’). Noteworthy, EP cells in 5-month-old Sox9cKO mice were flatter and devoid of pericellular safranin-o staining, indicating proteoglycan-rich matrix loss. Additionally, partial (4-month-old) and complete (5-month-old) loss of the vertebral GP was observed in Sox9cKO animals. Histological changes in the NP and AF of 4- and 5-month-old animals were separately quantified using a modified Thompson grading scheme, and the EP was scored using grading scheme reported by Tessier et al. [12, 29, 30]. Mild histological changes observed in 4-month-old Sox9cKO mice were reflected in the comparable distribution of average grades in the AF and slight increase in the proportion of discs scoring a 2 in the NP (Fig. 1E). However, there were significant differences in the distribution of average grades in the AF and NP of 5-month-old mice, with Sox9cKO mice exhibiting higher percentages of degenerating discs (Fig. 1F). While 4-month-old Sox9cKO discs showed no differences in collective average grades in the NP and AF (Fig. 1G–G”), higher grades were noted in the EP (Fig.1H–H’). By contrast, at 5 months of age, NP and AF compartments of Sox9cKO mice showed significantly higher average grades (Fig. 1I). Further level-by-level analyses of the NP and AF showed that lower lumbar discs in 5-month-old mice, for the NP (L3/4-L6/S1) and AF (L4/5-L6/S1), were prominently affected (Fig. 1I’–I”). Moreover, the EP of 5-month-old Sox9cKO showed further deterioration of structure and higher grades than Sox9CTR and 4-month-old Sox9cKO (Fig.1J–J’) To investigate possible contributing factors to the phenotype progression from 4 to 5 months, TUNEL staining was performed (Fig. 1K–L’). Quantitative analysis of TUNEL- and DAPI-stained nuclei showed a higher incidence of cell death in the NP and AF at both time points and an overall decrease in AF cellularity by 5 months (Fig. 1M, N).
Figure 1. Sox9cKO mice show signs of early degenerative changes.
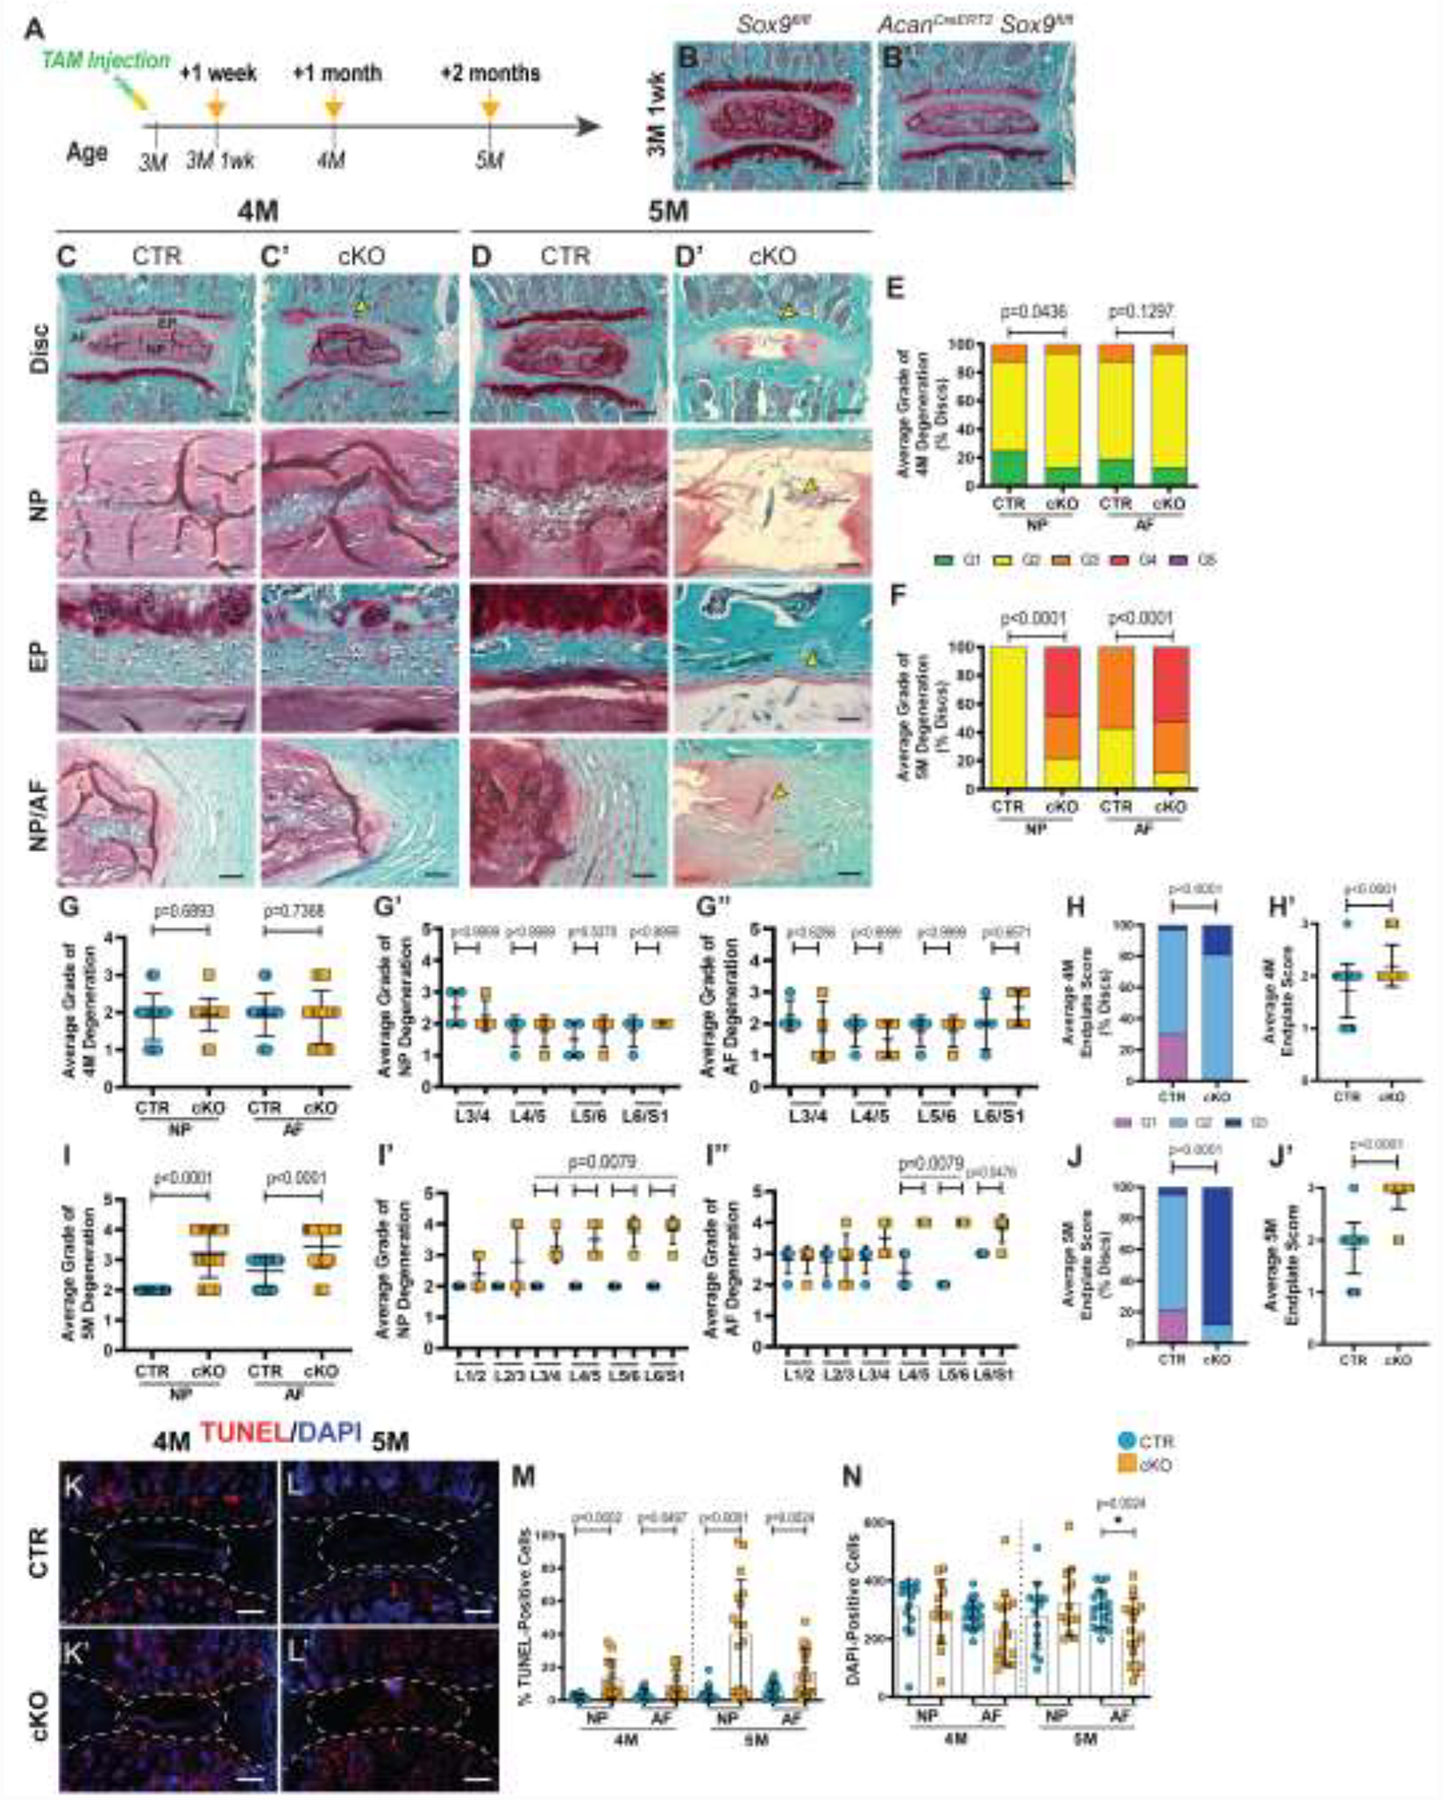
(A) Timeline of tamoxifen administration to generate Sox9CTR (Sox9fl/fl) and Sox9cKO (AcanCreERT2Sox9fl/fl) mice. Mice of both genotypes were injected at 3 months (3M) and analyzed at 1 week (3M 1 wk), 1 month (4M), and 2 months (5M) post injection. (B-D’) Safranin O/Fast Green staining of lumbar discs showing disc morphology and overall proteoglycan content in the intervertebral disc. (B-B’) One week post Sox9 deletion Sox9cKO mice show comparable disc morphology to Sox9CTR (scale bar = 200 μm). (C-D’) Whole disc (row 1, scale bar = 200 μm) and high-magnification images of the NP, EP, and NP/AF boundaries (rows 2, 4, scale bar = 50 μm; row 3, scale bar = 25 μm) in 4- and 5-month-old Sox9CTR and Sox9cKO mice. (C’, D’) Yellow arrowheads indicate proteoglycan loss in the growth plate at 4 months, without changes in other compartments. (D’) Complete ablation of the growth plate, fibrotic remodeling in the NP, loss of hypertrophic cells, and reduced definition between NP and AF compartments was evident in 5-month-old Sox9cKO mice. (E-H”) Histological grading assessment of 4-month- and 5-month-old lumbar discs using the modified Thompson and Tessier scales (n=4–5 discs/animal, 4–5 animals/genotype, 16–25 total discs/genotype). (E, F) Distribution of average histological grades in the NP and AF of 4-month-old (E) and 5-month-old (F) animals, with higher scores indicating higher levels of degeneration. (G-J’) Cumulative average, level-by-level average histological grades of the NP and AF, and average collective EP scores in 4-month-old (G-H’) and 5-month-old (I-J’) animals. (K-L’) TUNEL staining showing apoptotic cells in the NP and AF regions of lumbar intervertebral disc sections from 4-month (n=4 discs/animal, 4 animals/genotype, 16 total discs/genotype) and 5-month-old (n=6 discs/animal, 5 animals/genotype, 30 total discs/genotype) mice (scale bar= 200 μm). (M, N) Corresponding quantification showing the percentage of TUNEL-positive cells and the number of DAPI-stained nuclei. Significance for the grading distribution was determined using a χ2 test. Significance for all other quantitative measures was determined by using an unpaired t-test or Mann-Whitney test if data were not normally distributed. Quantitative measurements represent mean ± SD.
Progressive changes in disc architecture following Sox9 deletion was further evaluated by histologically analyzing lumbar and caudal discs from 12-month-old mice, evidencing increased severity of degeneration with age (Fig. 2A–C’). Notably, Sox9cKO discs showed the presence of non-vacuolated cells in the NP and EP, extensive fibrotic remodeling of the proteoglycan rich NP, severe loss of demarcation between the NP and AF, inward AF buckling, and GP loss (Fig. 2B’, C’). Average grade distributions, cumulative average grades, and level-by-level scores for the NP and AF of lumbar and caudal discs reflected further degeneration relative to 5-month-old mice (Fig. 2D–K). Importantly, level-by-level grading (Fig. 2G–H, J–K) and EP scoring (Fig. 2L–L’, M–M’) demonstrated the phenotype was severe and affected most levels, independent of spinal position.
Figure 2. Sox9cKO mice show severe disc degeneration at 12 months of age.

(A) Timeline of tamoxifen administration to mice at 3 months. 9 months post injection, 12-month-old (12M) Sox9cKO and Sox9CTR mice were analyzed. (B-C’) Safranin O/Fast Green staining of (B, B’) lumbar and (C, C’) caudal discs showing tissue morphology and proteoglycan content (row 1, scale bar= 200 μm) and high magnification images of the NP, EP, and NP/AF tissue boundary (rows 2–4, scale bar= 50 μm). Yellow arrowheads indicate the fibrotic remodeling in the NP, loss of hypertrophic cells, and reduced demarcation between NP and AF compartments. (D-K) Histological grading assessment using the modified Thompson and Tessier scales for 12-month-old (D, F-H) lumbar and (E, I-K) caudal discs (n=3 lumbar discs/animal, 5 caudal discs/animal, 10 animals/genotype, 30 lumbar and 50 caudal discs/genotype). (D-E, F, I) Distribution of and average histological grades in the NP and AF, with higher scores indicating higher levels of degeneration. (G-H, J-K) Level-by-level average grades of NP and AF degeneration. (L-L’, M-M’) Average collective scores of endplate degeneration. Significance for grading distribution was determined using a χ2 test. Significance of level-by-level data was determined using an unpaired t-test or Mann-Whitney test, if data were not normally distributed. Quantitative measurements represent mean ± SD.
A previous study of Sox9cKO mice indicated vertebral size was not impacted by the postnatal conditional deletion of Sox923. However, μCT analysis of 12-month-old mutants clearly showed morphological changes in the vertebrae (Fig. 3). Three-dimensional reconstructions of the hemi-sections of caudal (Fig. 3A, B) and lumbar (Fig. 3C, D) motion segments showed reduced vertebral length and disc compression. Cross-sectional reconstructions demonstrated small changes in trabecular and cortical bone architecture (Fig. 3A’–D’). The vertebral length (Fig. 3E) and disc height (Fig. 3F) were significantly reduced in caudal and lumbar vertebrae; however, these changes were such that only lumbar vertebrae had a lower disc height index (DHI) (Fig. 3G). Trabecular bone properties in the caudal and lumbar spine were also assessed. Lumbar vertebrae also showed reduced trabecular spacing (Fig. 3H) and trabecular thickness (Fig. 3I). For caudal and lumbar regions, the trabecular number, BV/TV, and SMI were unchanged (Fig. 3J–L). Analysis of cortical bone properties demonstrated a thinner cortical shell (Fig. 3M) and lower BV/TV (Fig. 3M, N) in the caudal vertebrae but no change in the cortical thickness (Fig. 3M) or bone volume (Fig. 3O) of the lumbar vertebrae. These results demonstrated Sox9 deletion has a long-term, systemic effect on the vertebrae throughout the spine, with some differential effects between lumbar and caudal regions.
Figure 3. Conditional deletion of Sox9 results in reduced vertebral size and compromised trabecular and cortical bone quality.
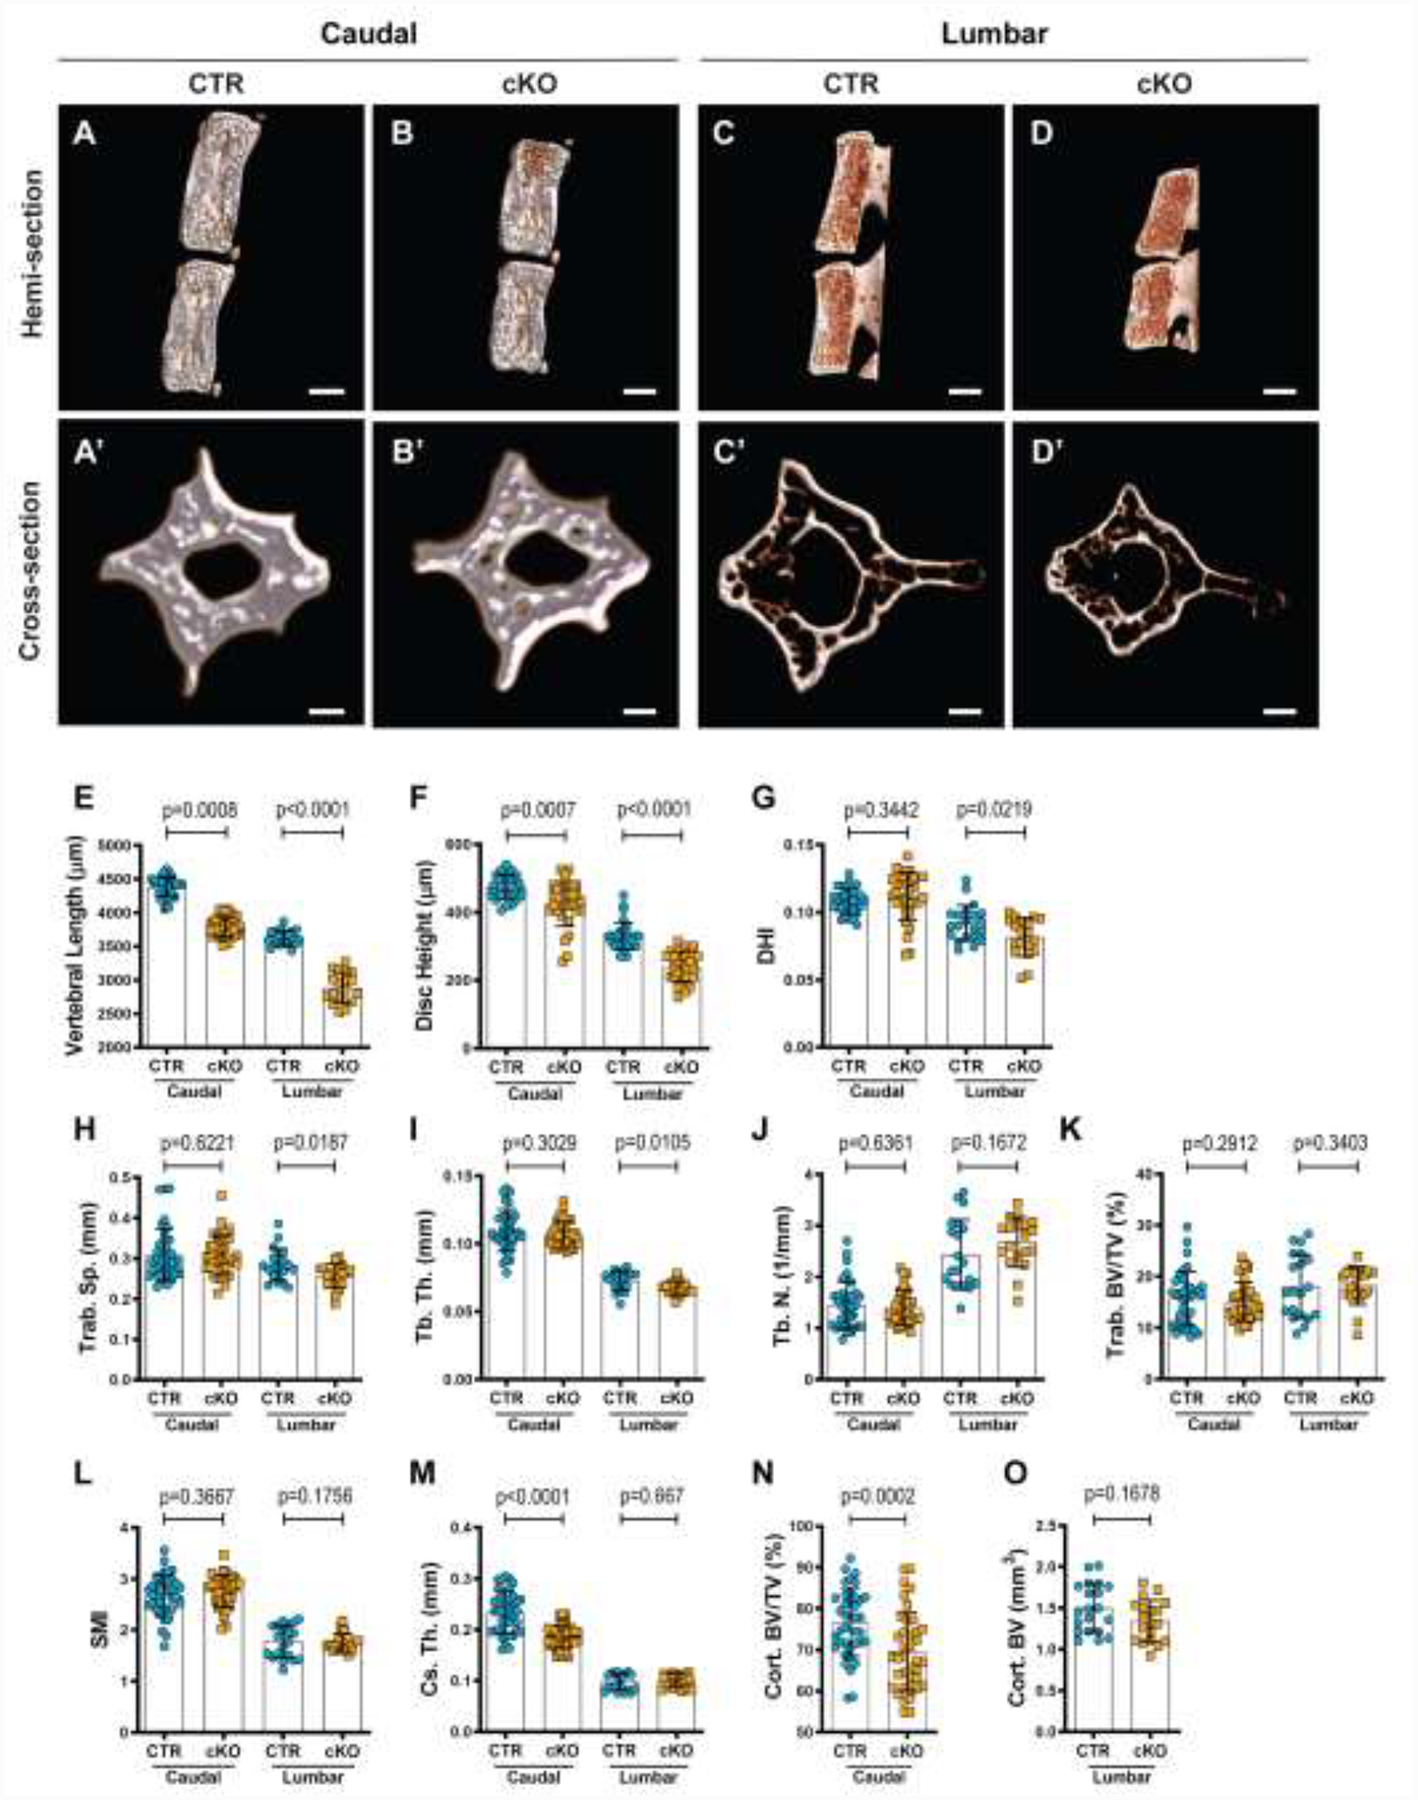
(A-D) Representative μCT reconstructions of the hemi-section of a caudal (A, B) and lumbar (C, D) motion segment in a 12-month-old Sox9CTR and Sox9cKO mouse. (A’-D’) Cross-section of a representative caudal (A’, B’) and lumbar (C’, D’) vertebral body of 12-month-old Sox9CTR and Sox9cKO animals. (E) Vertebral length, (F) disc height, (G) and disc height index (DHI) are shown for caudal and lumbar vertebrae. (H-L) Trabecular bone properties of (H) Trab. Sp, (I) Tb. Th., (J) Tb. N., (K) Trab. BV/TV, and (L) structure model index (SMI) are shown for caudal and lumbar vertebrae. (M-O) Cortical bone properties of (M) Cs. Th. (caudal and lumbar), (N) Cort. BV/TV (caudal only), and (O) Cort. BV (lumbar only) are shown. Quantitative measurements represent mean ± SD (n=3 caudal discs and 4 vertebrae//mouse, 10 mice/genotype; n=2 lumbar discs and 3 vertebrae/mouse, 10 mice/genotype). (A-D) Scale bar = 1mm. (A’-D’) Scale bar = 250 μm. Significance of differences was determined using an unpaired t-test or Mann-Whitney test, if data were not normally distributed.
Sox9cKO mice show progressive loss of disc cells without repopulation
The histological characterization suggested an altered disc cell phenotype in Sox9cKO animals, and TUNEL staining confirmed a degeneration-associated increase in apoptosis. To track the fate of native cell populations in Sox9cKO animals and assess if they were replaced by exogenous cells, lineage tracing was performed in 4-, 5-, 10-, and 12-month-old mice using a tdTomato+ reporter to mark Cre-recombinase activity in Acan-expressing cells (R26tdTomato/+AcanCreERT2Sox9fl/fl). As expected, tdTOM+ cells were present in the NP, AF, EP, and GP in control (R26tdTomato/+AcanCreERT2) discs (Fig. 4A). However, an age-dependent reduction in the numbers of tdTOM+ cells was evident in the NP, AF, and EP compartments of Sox9cKO mice, and such cells were noticeably absent in the vertebral GP of the Sox9cKO animals, (Fig. 4B–E). Interestingly, despite drastic, age-dependent degeneration following Sox9 inactivation, native cell subpopulations (tdTOM+) were not replaced with tdTOM-negative cells, and thus, repopulation with cells from outside the disc or Acan-negative stem cells within the disc was not evident [31].
Figure 4. Sox9cKO mice progressively lose native cell populations and show diminished phenotypic marker expression.
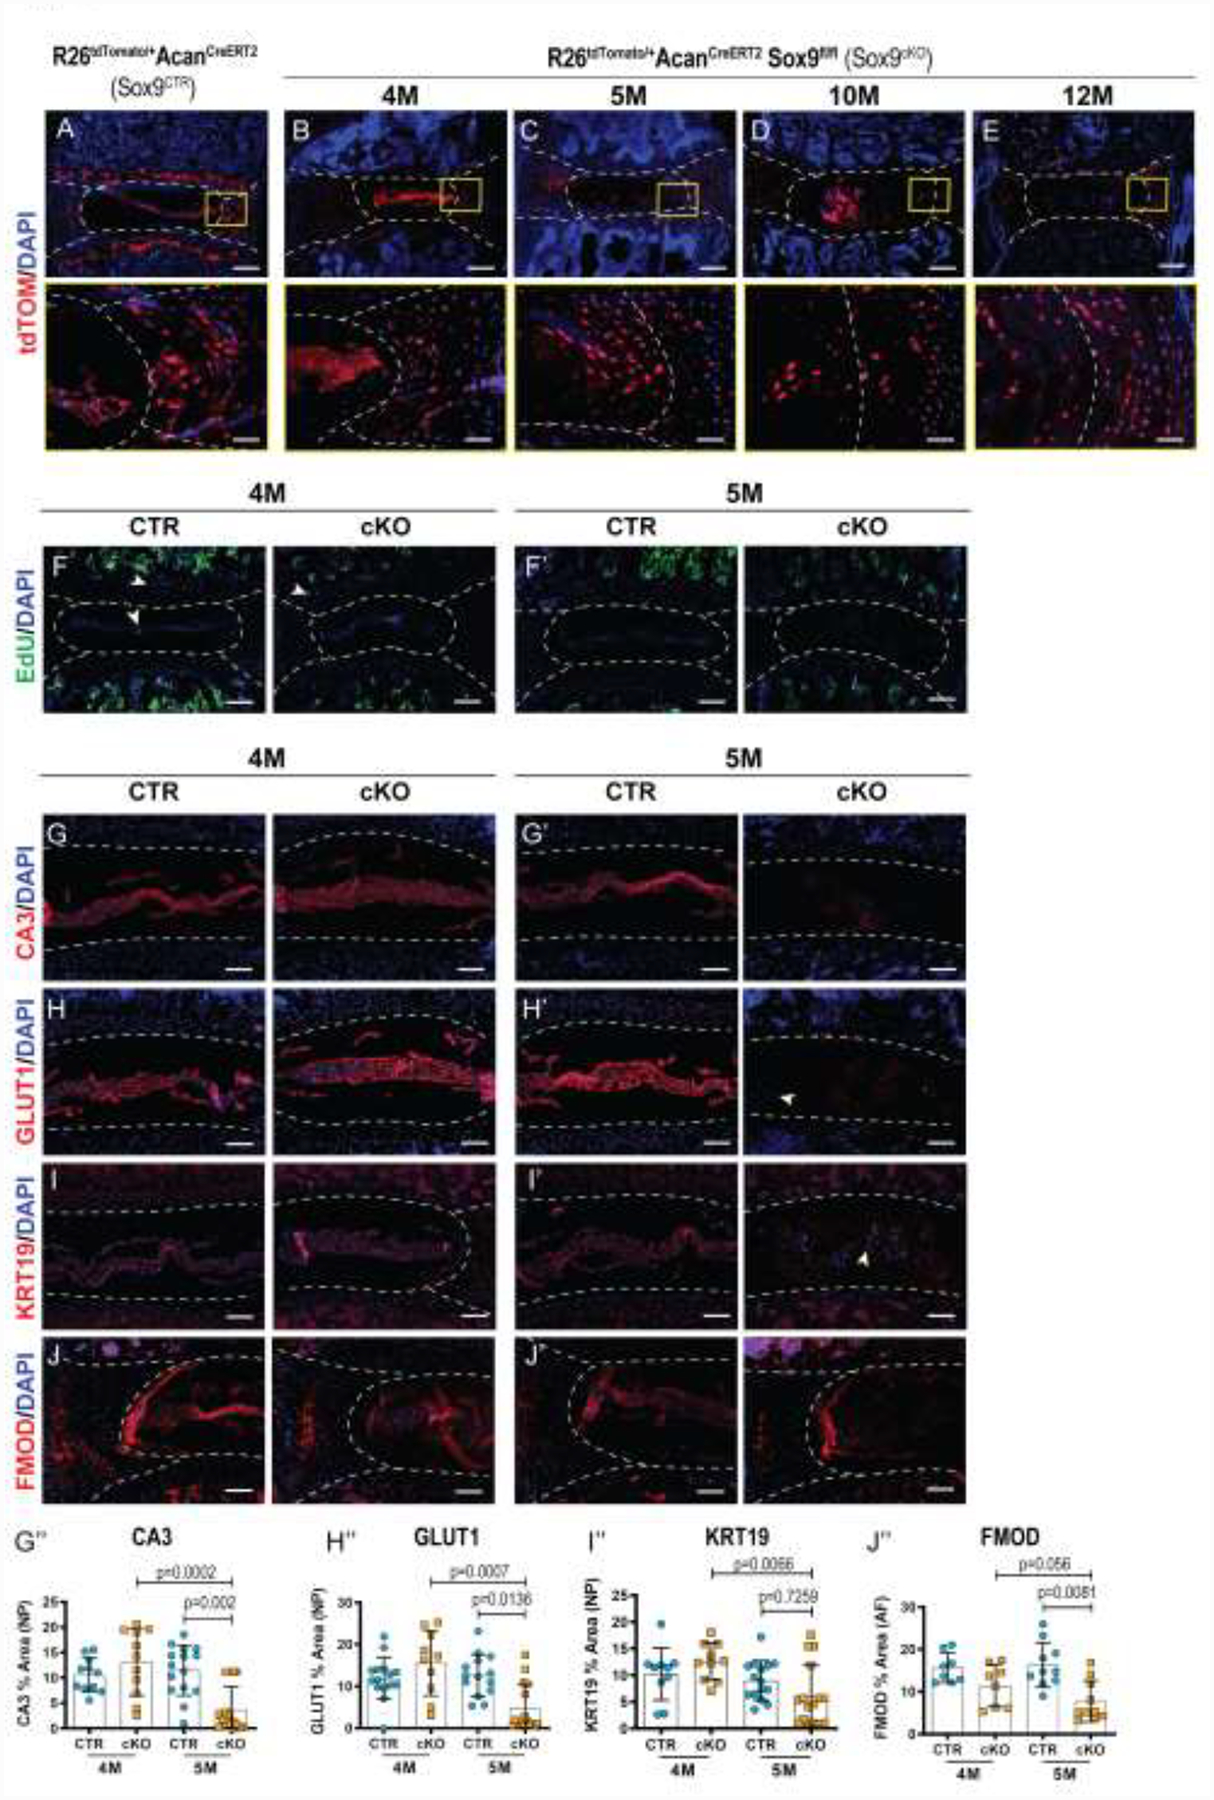
(A-E) Fate mapping using tdTOM in a (A) Sox9CTR and (B) 4M), (C) 5M, (D) 10M and (E) 12M Sox9cKO animals (top row scale bar= 200 μm; bottom row scale bar= 50 μm). Loss of tdTOM+ cells was evident with time without replacement by tdTOM− cell types, n=2 discs/animal, 2 animals/time point, 4 total discs/time point (F-F’) EdU labeling in (F) 4M and (F’) 5M animals, injected 6 hours prior to euthanasia (scale bar = 200 μm). White arrowheads indicate EdU-positive cells. (G-I”) Quantitative immunohistological staining of NP phenotypic markers using 4- and 5-month-old lumbar discs: (G-G”) carbonic anhydrase 3 (CA3); (H-H”) glucose transporter 1 (GLUT1); and (I-I”) keratin 19 (KRT19) (scale bar= 100 μm). Decreased staining area for all the markers and a subpopulation of cells negative for marker expression was evident in Sox9cKO mice. (J-J”) Quantitative immunohistological staining conducted on 4- and 5-month-old lumbar discs for AF phenotypic marker fibromodulin (FMOD) (scale bar= 100 μm). (n=2–4 discs/animal, 4 animals/genotype (4M), 8–15 discs/genotype/stain; 5 animals/genotype (5M), 10–16 discs/genotype/stain). Dotted lines demarcate different tissue compartments within the disc. Quantitative measurements represent mean ± SD. Significance was tested using Kruskal-Wallis and Dunn’s multiple comparison tests.
We next ascertained whether Sox9 deletion resulted in aberrant cell proliferation by performing an EdU incorporation assay in 4- and 5-month-old mice. Congruent with post-mitotic nature of disc cells in skeletally mature mice, we observed very few EdU-incorporating NP and AF cells, indicating marginal or no cell proliferation in both genotypes [32, 33]. As expected, vertebral marrow cells incorporated EdU during the 6-hour chase experiment (Fig. 4F–F’).
The impact of Sox9 deletion on cellular phenotype was assessed by measuring the levels of select NP and AF phenotypic markers in 4- and 5-month-old mice. NP cells in 4-month-old mice showed a comparable abundance of CA3 (carbonic anhydrase 3), GLUT-1 (glucose transporter 1), and KRT19 (keratin 19) between genotypes. However, there was a significant reduction in the abundance of these NP markers in in 5-month-old Sox9cKO, relative to age-matched controls and 4-month-old Sox9cKO (Fig. 4G–I”). Additionally, a few surviving cells in 5-month-old mice did not express any of these phenotypic markers. Similarly, in the AF, FMOD (fibromodulin) expression was markedly reduced in 5-month-old discs (Fig. 4J–J”); however, no differences were observed in staining patterns of the catabolic marker MMP13, known to degrade FMOD and collagen substrates (Supplementary Fig. 1A–A”) [34]. This reduction in the abundance of phenotypic markers in Sox9cKO mice may reflect a loss of cells due to cell death and a possible change in cellular phenotype. Either case indicates that Sox9 deletion promoted an altered cellular phenotype.
Sox9cKO discs show altered ECM organization and composition
We further investigated alterations in disc matrix organization and composition in Sox9cKO mice, with a specific focus on collagens and proteoglycans. To evaluate overall collagen architecture and content during early and late stages of the degenerative cascade, Picrosirius Red-stained discs from 5- and 12-month-old mice were visualized under polarized light (Fig. 5A–E). As expected, the AF and vertebral bone showed strong birefringence, with highly organized collagen fibers in control discs (Fig. 5A–A’, C–C’) [35]. Mutant discs evidenced an expanded AF, with prominent collagen fibril disorganization and inward buckling of the annular lamellae at both time points (Fig. 5B–B’, D–D’). Interestingly, despite a significantly higher number of discs exhibiting disorganized AF fiber architecture, quantitative analysis showed no differences in the collagen fiber thickness distribution in 5- and 12-month-old mice (Fig. 5E–E’).
Figure 5. Changes in chemical composition accompany increased severity of disc degeneration in Sox9cKO mice.
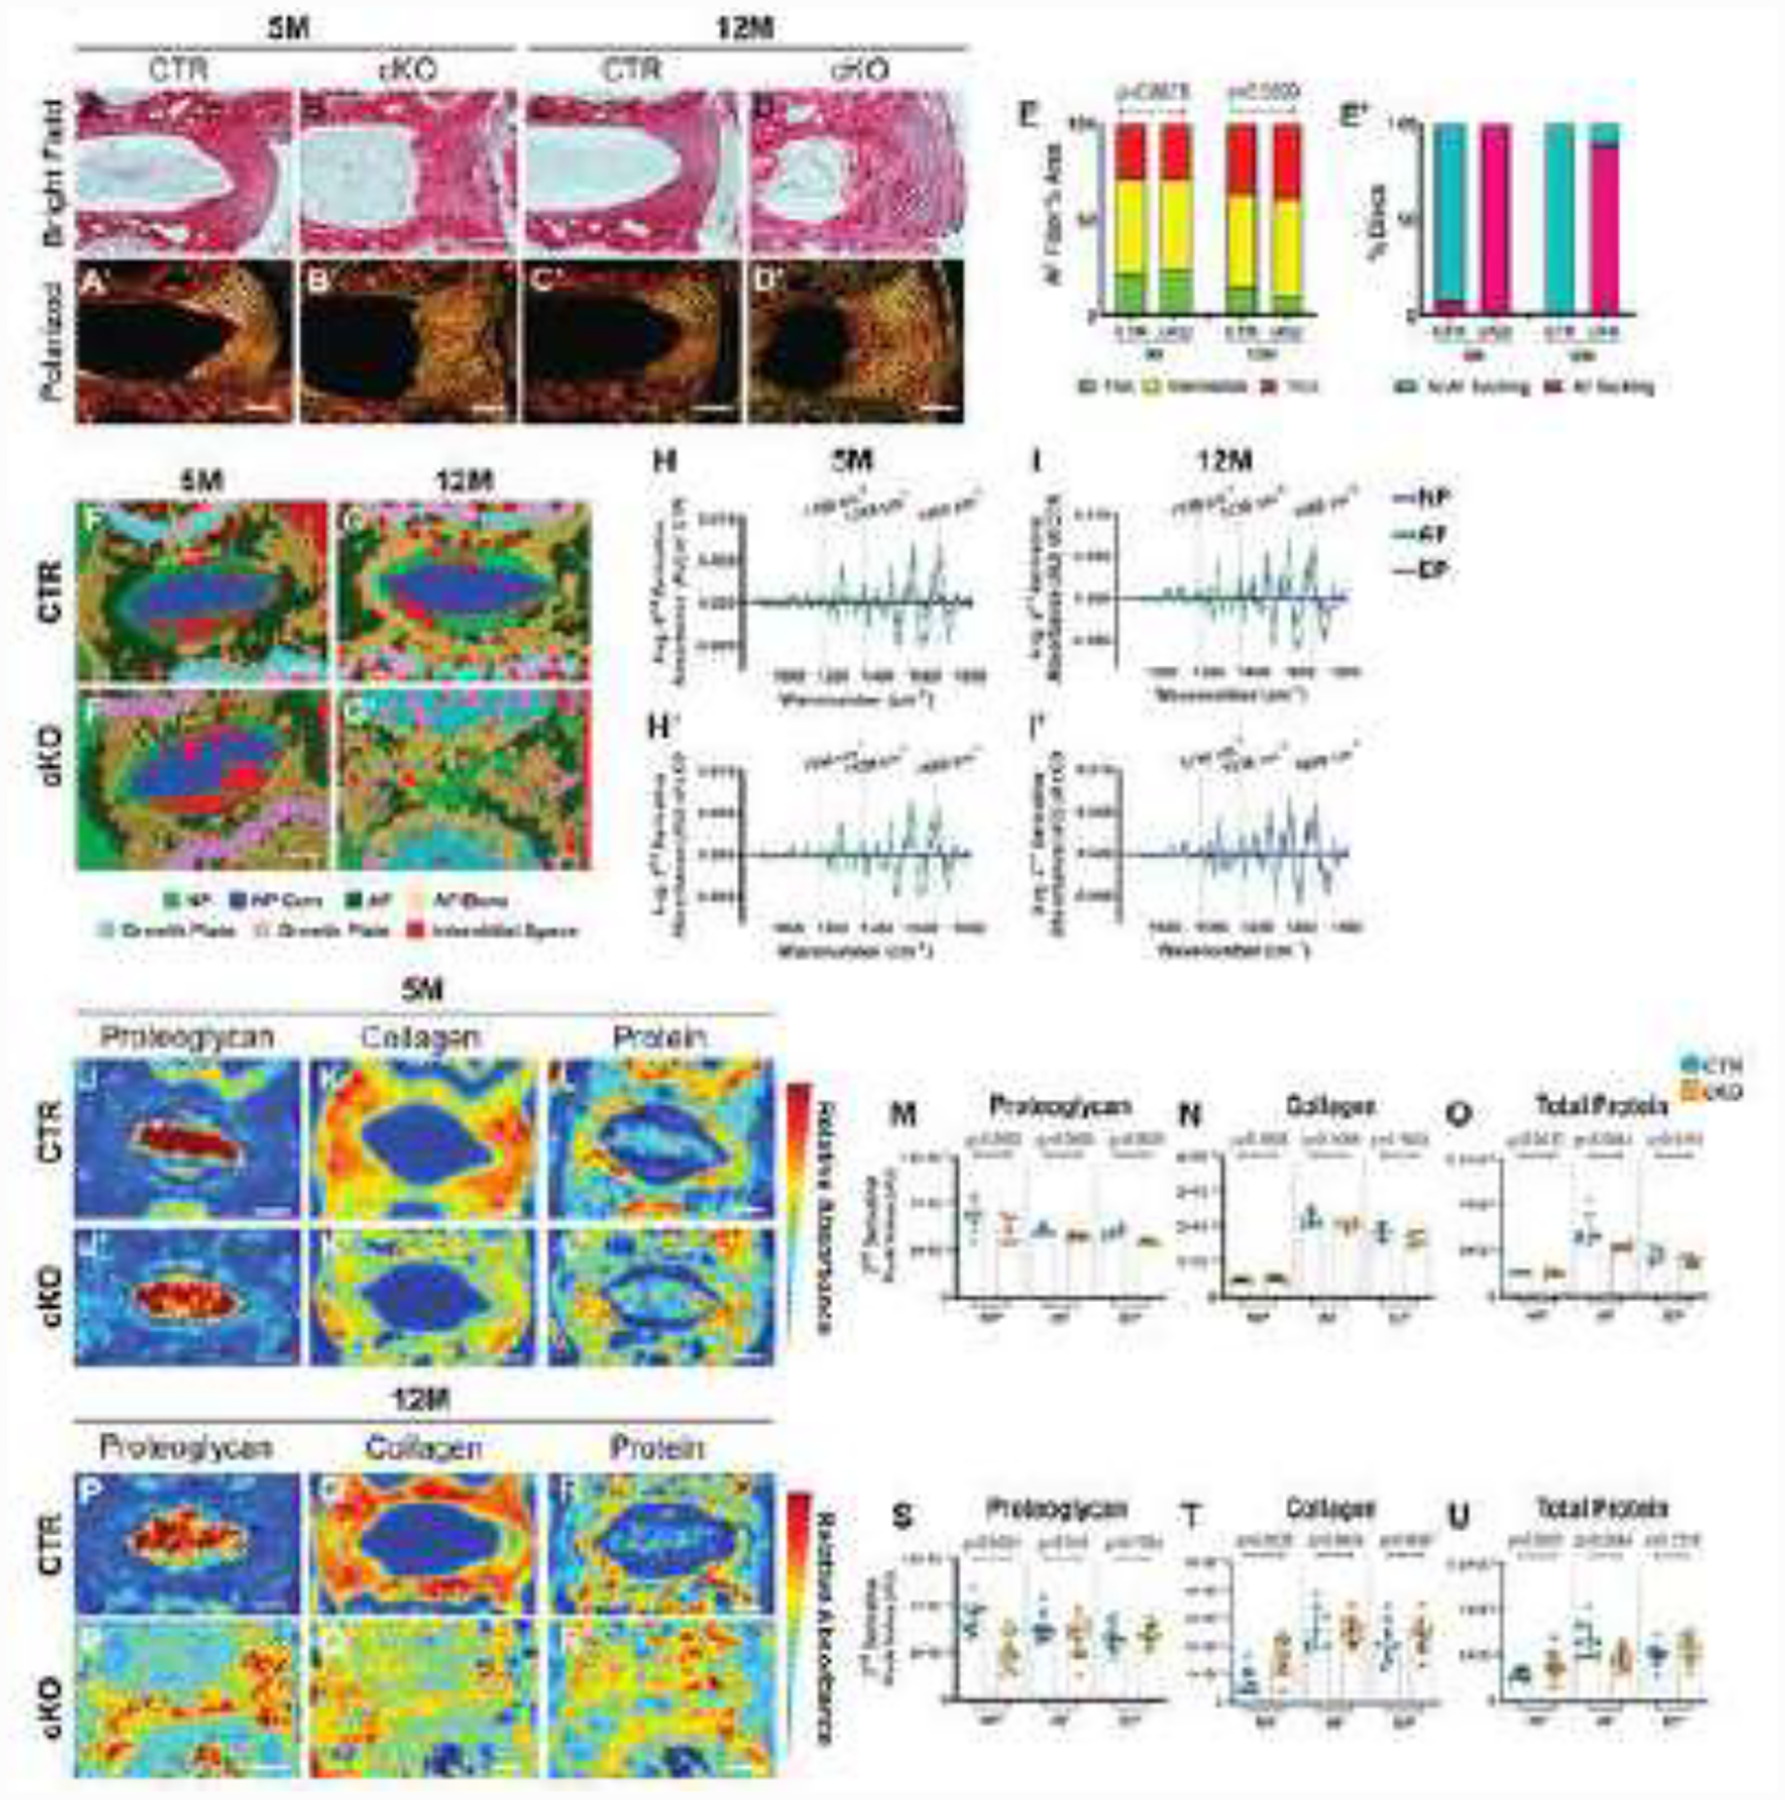
(A-D’) Picrosirius Red staining of (A-B’) 5-month-old and (C-D’) 12-month-old caudal discs showing collagen organization of the AF in the (A-D) bright field and collagen fiber distribution under (A’-D’) polarized light (scale bar= 100 μm). (E-E’) Quantification of (E) fiber thickness distribution and (E’) proportion of discs with AF buckling for 5-month-old (n=4 discs/animal, 5 animals/genotype, 20 total discs/genotype) and 12-month-old (n=3 discs/animal, 6 animals/genotype, 18 total discs/genotype) caudal discs. (F-G’) Spectral cluster analysis images (Scale bar = 200 μm). (H-I’) Average second derivative spectra, inverted for positive visualization, of the NP, AF, and EP of (H, H’) 5-month-old (n=1 disc/animal, 5 animals/genotype, 5 total discs/genotype) and (I, I’) 12-month-old (n=1 disc/animal, 10 animals/genotype). (J-L’ and P-R’) Chemical maps and (M-O and S-U) quantification of mean second derivative peaks for (J-J’, M, P-P’, S) proteoglycan (1156 cm−1), (K-K’, N, Q-Q’, T) collagen (1338 cm−1), and (L-L’, O, R-R’, U) total protein (1660 cm−1) content. Significance between fiber distribution was determined using a χ2 test. AU: arbitrary units. Quantitative measurements represent mean ± SD. Significance of chemical components was determined using an unpaired t-test or Mann-Whitney test, if data were not normally distributed.
Fourier transform infrared (FTIR) spectroscopic imaging was used to further assess the chemical composition of 5- and 12-month-old discs. Spectral clustering that groups and classifies individual pixels based on their chemical compositions showed evidence of matrix remodeling at both timepoints (Fig. 5F–G’). 5-month-old mutant and control discs showed similar clustering patterns, except for the absence of a GP cluster (light blue) in mutants, corresponding to the GP loss noted in histological findings (Fig. 5F–F’). Spectral clustering of discs from 12-month-old mutants showed dramatic phenotypic differences, demonstrating poorly-defined anatomic regions and a complete loss of the NP tissue core and GP, suggesting that by 12 months the NP tissue had an AF-like composition (Fig. 5G–G’). Furthermore, average second derivative spectra were generated and analyzed for each disc compartment at representative peaks for collagen (1338 cm−1), proteoglycans (1156 cm−1), and total protein (1660 cm−1) (Fig.4H–I’). Corresponding chemical maps, quantified for each molecular class, indicated the 5-month-old Sox9cKO EP had an altered proteoglycan content, with no differences in the overall collagen content, and decreased AF total protein (Fig. 5J–O). By contrast, 12-month-old Sox9cKO mice showed reduced NP proteoglycan content, increased NP collagen, and significant changes in NP and AF total protein (Fig. 5P–U). This analysis demonstrated abnormal redistribution of major matrix molecules in Sox9cKO discs.
To further evaluate localization and reorganization of characteristic matrix molecules, quantitative immunohistochemical staining was performed on 12-month-old Sox9cKO discs. Consistent with the decreased NP proteoglycan content seen in the FTIR spectroscopic analysis, ACAN and CS (chondroitin sulfate) levels were significantly reduced in the NP of Sox9cKO mice (Fig. 6A–B’). Likewise, while baseline ACAN levels were appreciably lower in the AF, a decrease was seen in Sox9cKO mice, without a corresponding change in CS abundance. There was pronounced ARGxx (an aggrecan neoepitope generated by ADAMTS-dependent degradation) staining in the NP and AF, indicating active ADAMTS-dependent aggrecan degradation (Fig. 6C–D). COL I and COL II displayed similar staining patterns and showed reduced abundance in the Sox9cKO AF (Fig. 6E–F’). Interestingly, despite the fibrotic morphology and increased collagen content demonstrated by FTIR spectroscopic analysis, the absence of appreciable increases in COL I and COL II staining of the NP suggested the presence of other, minor collagen types [36]. Collagen quality assessment, using a fluorescently labeled peptide (CHP) that binds to denatured collagen, showed the presence of significantly more denatured collagen via a higher CHP signal in the NP but not in the AF of Sox9cKO mice (Fig. 6G–H). However, consistent with Picrosirius Red findings, CHP labeling evidenced disrupted collagen organization in the AF of Sox9cKO animals. Additionally, reduced levels of COMP and FMOD were apparent in Sox9cKO mice, indicating structural disorganization of the collagen network in the AF (Fig. 6I–J’) [37]. Additionally, the catabolic marker MMP13 displayed significantly increased levels in the AF; whereas COL X abundance, a hypertrophic chondrocyte marker, was markedly lower in all compartments of mutant discs, indicating cells did not adopt a hypertrophic chondrocyte-like phenotype, as seen in other models of degeneration (Fig. 6K–M) [36]. Collectively, these results delineated changes in disc matrix composition shown to be associated with disc degeneration.
Figure 6. Sox9cKO mice show matrix remodeling characteristic of disc degeneration.

Quantitative immunohistological staining of 12-month-old Sox9CTR and Sox9cKO lumbar discs for: (A, A’) aggrecan (ACAN); (B, B’) chondroitin sulfate (CS); (C, C’) aggrecan neoepitope, generated by ADAMTS-dependent degradation (ARGxx); (E, E’) collagen I (COL I), (F, F’) collagen II (COL II); (G, G’) denatured collagen, measured by a collagen hybridization peptide binding (CHP); (I, I”) cartilage oligomeric matrix protein (COMP); (J, J’) fibromodulin (FMOD); (K, K’) matrix metalloproteinase 13 (MMP13); (L, L’) collagen X (COL X). Yellow arrowheads indicate (D) ARGxx-expressing cells and (M) COL X deposition. A-C, G, L, : scale bar= 200 μm; E-F, H-K: scale bar= 100 μm, and ARGxx, COL X: scale bar=50 μm. (n=1–3 discs/animal; 6 animals/genotype, 9–16 discs/genotype/stain; 5 animals/genotype, 12–15 total discs/genotype for CHP) Dotted lines demarcate different tissue compartments within the disc. Quantitative measurements represent mean ± SD. Significance was determined using an unpaired t-test or Mann-Whitney test as appropriate.
Sox9 deletion results in distinct transcriptomic changes in NP and AF
To gain insight into transcriptional changes that could prompt disc degeneration and severe NP and AF phenotypes, tissues were collected from mice 5- and 21-days post tamoxifen injection and processed for total RNA extraction (Fig. 7A). Sox9 deletion was confirmed by qRT-PCR (Fig. 7B), and microarray analyses were conducted on samples collected at 5 days. Three-dimensional principal component analysis (PCA) showed distinct clustering in the NP (Fig. 7C), but only three of the four samples clustered in the AF (Fig. 7C’). Hierarchical clustering demonstrated distinctions in gene expression profiles between Sox9CTR and Sox9cKO animals and the proportion of upregulated (green) and downregulated (purple) differentially expressed genes (DEGs) (p ≤ 0.05, 1.75-fold change) in the NP (Fig. 7D) and AF (Fig. 7E). Log-log plots (Fig. 7D’–E’) showed the relative expression of DEGs from NP and AF tissues. Interestingly, the deletion of Sox9 resulted in a larger pool of DEGs in the AF (Fig. 7F). When compared, only 8% overlap was observed between DEGs in the NP and AF; approximately 73% of DEGs in the NP and 90% of DEGs in the AF were identified as tissue-specific (Fig. 7F). Additionally, expression changes in select DEGs were validated by qPCR in the NP (Fig. 7G, G’) and AF (Fig. 7H, H’), with specific attention given to genes known to be regulated by SOX9, including Acan, Col2a1, and other top DEGs.
Figure 7. Sox9cKO mice show early transcriptional reprogramming in NP and AF tissues.

(A) Timeline of tamoxifen administration in Sox9CTR and Sox9cKO mice at 3 months; RNA was analyzed 5 and 21 days post injection. (B) mRNA expression levels of Sox9 in the NP and AF of Sox9CTR and Sox9cKO —mice 5 days post tamoxifen injection (n=17 discs/animal, 4 animals/genotype). (C-C’) Clustering of transcriptomic profiles by Principal Component Analysis of NP (C) and AF (C’) tissues. (D, E) Hierarchical clustering of significantly differentially expressed genes (DEGs) (p < 0.05, ≥ 1.75-fold change). (D’, E’) Log-log scatterplots of DEGs in the (D’) NP and (E’) AF. (F) Venn Diagram showing the distribution and directionality of unique and common DEGs in the NP and AF (p ≤ 0.05, ≥ 1.75-fold change). (G-H’) Relative mRNA expression levels of genes confirmed by qPCR in the (G, G’) NP and (H, H’) AF of animals (G, H) 5 days (n=17 discs/animal, 7 animals/genotype) and (G’, H’) 21 days post tamoxifen injection (n=17 discs/animal, 5 Sox9CTR, 7 Sox9cKO). PCR data represents the mean ± SD. Significance was determined using an unpaired t-test or Mann-Whitney test, if data were not normally distributed.
To provide insights into the possible pathological relevance of the DEGs associated with SOX9 loss in the AF and NP, the CompBio (PercayAI Inc., St. Louis, MO) tool was used for pathway-level analysis [38]. Beginning at the thematic level, we visually assessed the distinctions between the NP and AF using the top ten up- and downregulated themes (Supplementary Fig. 2). Thematic overlap, including directionality, between the NP and AF, was noted for “ECM-Related,” “Articular Cartilage,” “TGF-β Signaling,” and “Inheritance Disorders, Chondrodysplasia.” However, the remaining top themes did not overlap between compartments, suggesting that most concepts were unique. Further exploring this, the CompBio tool was used to determine the relatedness of emergent concepts (shown within spheres) in the literature associated with the lists of DEGs from the AF and NP (Fig. 8, Supplementary Figs. 3, 4) [38]. From these concepts, themes (labels adjacent to spheres) were organized into super clusters, demonstrating the most prominent biological features associated with the transcript-level dysregulation resulting from Sox9 deletion. Within the AF, super clusters related to the immune response, cytoskeleton, cell cycle, and ECM were apparent from the list of upregulated DEGs (Fig. 8A). From the downregulated DEGs, two super clusters, ECM and ion transport, were identified (Fig. 8B). Though it did not fall within a super cluster, a group of downregulated concepts thematically organized into the theme of WNT signaling, a known regulator of disc homeostasis [36, 39]. To predict the most significant genes within each super cluster, the top 20% (defined by thematic CompBio entity score) of genes contributing to each theme were assessed. Duplicate genes were removed, remaining genes were cross-referenced with their CompBio entity high score, and a minimum cutoff of 400 was imposed. This method of analysis allowed for DEGs to be visualized according to their weight in the present body of literature and fold change (Supplementary Figs. 3, 4). Expectedly, several genes known to be regulated by SOX9 in chondrocytes and critical to disc health were downregulated, including ECM-related genes Col2a1, Col11a1, Col9a2, and Acan. Several ion channel-encoding genes, including Trpm4, Trpm7, Piezo2, and Trpv4, encoding osmosensitive ion channel proteins linked to disc degeneration and inflammation, were also downregulated [40]. On the other hand, several genes involved with matrix remodeling and inflammation, including Timp1, Adam10, S100a8, S100a9, and Cxcr4, were upregulated [12].
Figure 8. Sox9 deletion in the AF significantly impacts transcriptional programming related to the immune response, cytoskeleton, cell cycle, extracellular matrix, and ion transport.

(A) Thematic organization of concepts determined by literature correspondence to significantly differentially upregulated genes in the AF of Sox9cKO mice, emphasizing immune responses (blue), the cytoskeleton (red), the cell cycle (orange), and the extracellular matrix (yellow) as prominent physiological features impacted by SOX9 loss of function. (B) Downregulated DEGs in the AF of Sox9cKO mice indicating the extracellular matrix (yellow) and ion transport (pink) as the most prominent physiological features impacted by Sox9 deletion. (n=17 discs/animal, 4 animals/genotype)
This analysis was also conducted for the NP tissue. From the upregulated DEGs, super clusters related to the ECM, ECM subcategory of glycosaminoglycans, and immune response were identified (Fig. 9A). In relation to the pathophysiology of disc degeneration, upregulated matrix genes from the ECM super clusters included Dcn and Bgn, which encode small proteoglycans, and Adamts1, known to be involved in matrix assembly and proteolysis [41]. These genes were organized under themes related to proteoglycans and GAG-biosynthesis, suggesting Sox9 inactivation in the disc promotes the expression of small leucine-rich proteoglycans known to regulate collagen fibril assembly [42]. Downregulated genes resulted in the thematic super clustering of ECM, cytoskeleton, and signaling-related concepts (Fig. 9B). In addition to NP markers, the expression levels of Krt8 and critical matrix genes such as Acan and Col11a1 were decreased. Additionally, decreased expression levels of important signaling genes, such as Fgfr3, Wnt16, and Lrp5, suggested reduced FGF and WNT signaling activity [43, 44].
Figure 9. Sox9 deletion in the NP significantly impacts transcriptional programs related to extracellular matrix, glycosaminoglycans, immune response, cytoskeleton, and signaling.
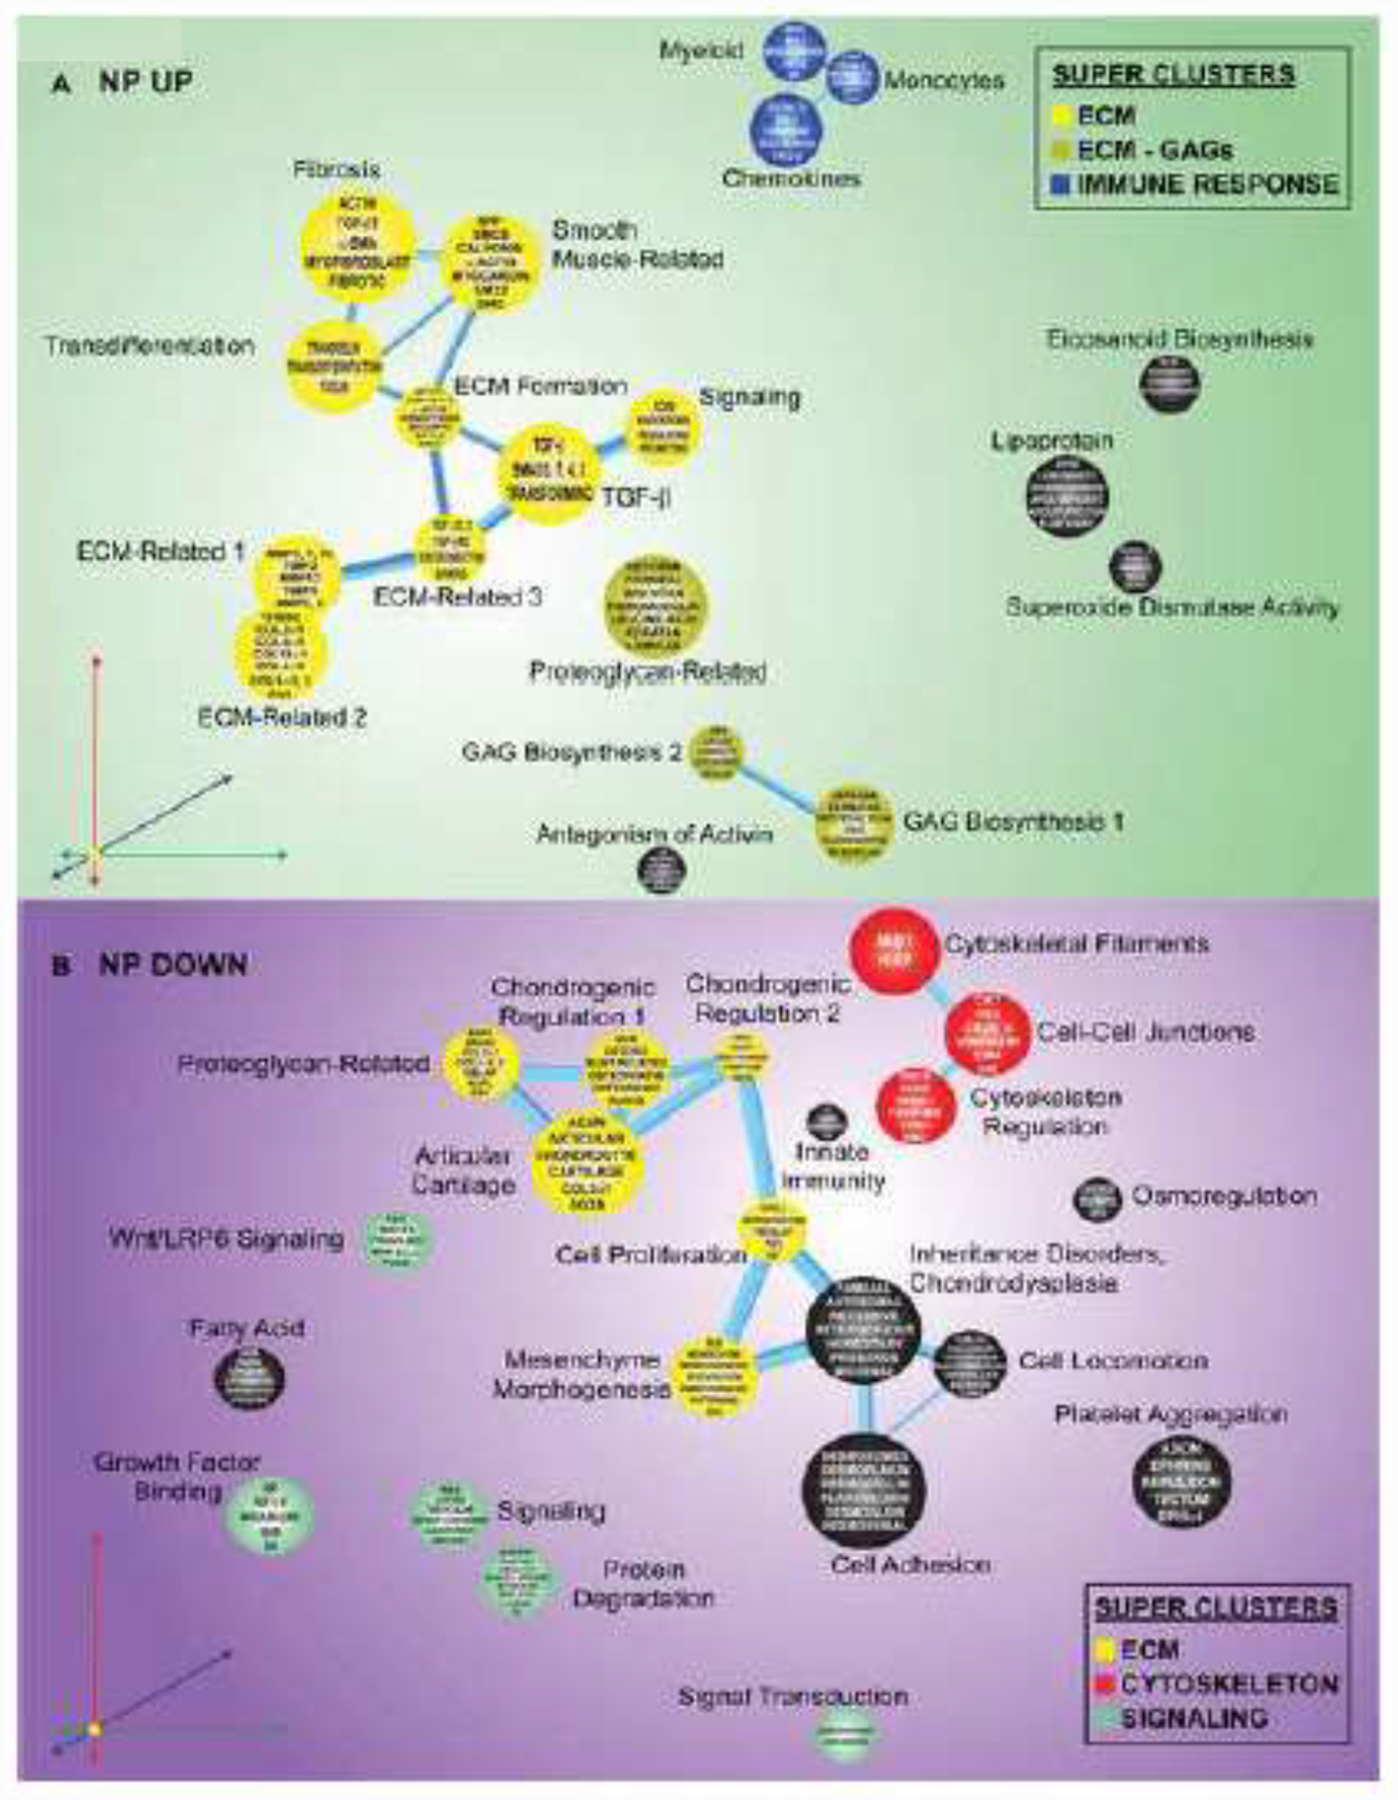
(A) Thematic organization of concepts determined by literature correspondence to significantly differentially upregulated genes in the NP of Sox9cKO mice emphasizes the immune response (blue), the extracellular matrix (yellow), and the extracellular matrix subset of glycosaminoglycans (dark yellow) as prominent physiological features impacted by Sox9 deletion. (B) Downregulated genes in the NP of Sox9cKO mice indicate the extracellular matrix (yellow), cytoskeleton (red), and signaling (green) as the most prominent physiological features impacted by Sox9 deletion. (n=17 discs/animal, 4 animals/genotype)
The CompBio analysis was then used to assess compartment-specific changes at the thematic level. The majority of the top themes from the NP and AF did not overlap, as previously noted (Supplementary Fig. 2). In the AF, themes pertaining to “Signaling Pathways” were shown to be affected predominantly in this region. Themes pertaining to “ECM & Cytoskeleton Related” and “Metabolic Pathways” were shown to be of greater significance in the NP. Interestingly, there was no overlap within “Cell Growth and Proliferation”; however, an apparent trend was observed with respect to directionality, showing more substantial downregulation in the NP and upregulation in the AF. Further, when the ECM super clusters (a dominant cluster from up- and downregulated themes in the NP and AF) were explored, it became clear that distinct sets of genes were most critical to each compartment (Supplementary Tables 1–4). To assess these compartment-specific changes, the CompBio tool was further used to identify unique concepts from the AF and NP DEGs (Supplementary Figs. 5, 6), using a gene-agnostic approach. Considering all concepts derived from the DEGs in the AF and the NP, the CompBio overlap function was used, and tissue-specific concepts were displayed, removing common concepts. The fraction of remaining concepts is shown in parenthesis, and halos around the spheres indicate the proportion of unique concepts within the theme (lowest to highest-ranked: blue, green, orange, and red). In the AF, themes are super-clustered by the terms ECM, cell-cell communication, and cell cycle, with the ECM having the lowest proportion of unique concepts (Supplementary Fig. 5). Though the NP similarly super-clustered by the terms ECM, cell-cell communication, and development, the majority of concepts represented by the clustered themes were unique to the NP (Supplementary Fig. 6), indicating SOX9 may have distinct functions in each compartment of the disc. Subsequent filtering of genes from each theme of the super clusters further demonstrated that while the tissue compartments may have common DEGs (including Col2a1, Acan, Adamts1, and Prg4), the broader context of the pool of DEGs from which each is analyzed provided greater physiological insight (Supplementary Fig. 7). Accordingly, an examination of individual themes within the shared super cluster of cell-cell communication provided insights into how different genes in the NP and AF relate to the same macro-level function. In the AF, the themes “Cell-Cell Junctions” and “Actin Filament Organization” were strongly influenced by the differential expression of Acta1, Gjb6, Kif2c, and Acta2; in the NP, however, the related themes of “Cell Adhesion” and “Cytoskeleton” were correlated with Krt8, Krt20, and Fasn expression. Altogether, these findings contribute to our overall studies detailing the cellular and molecular regulatory contributions of SOX9 to intervertebral disc health (Fig. 10).
Figure 10.
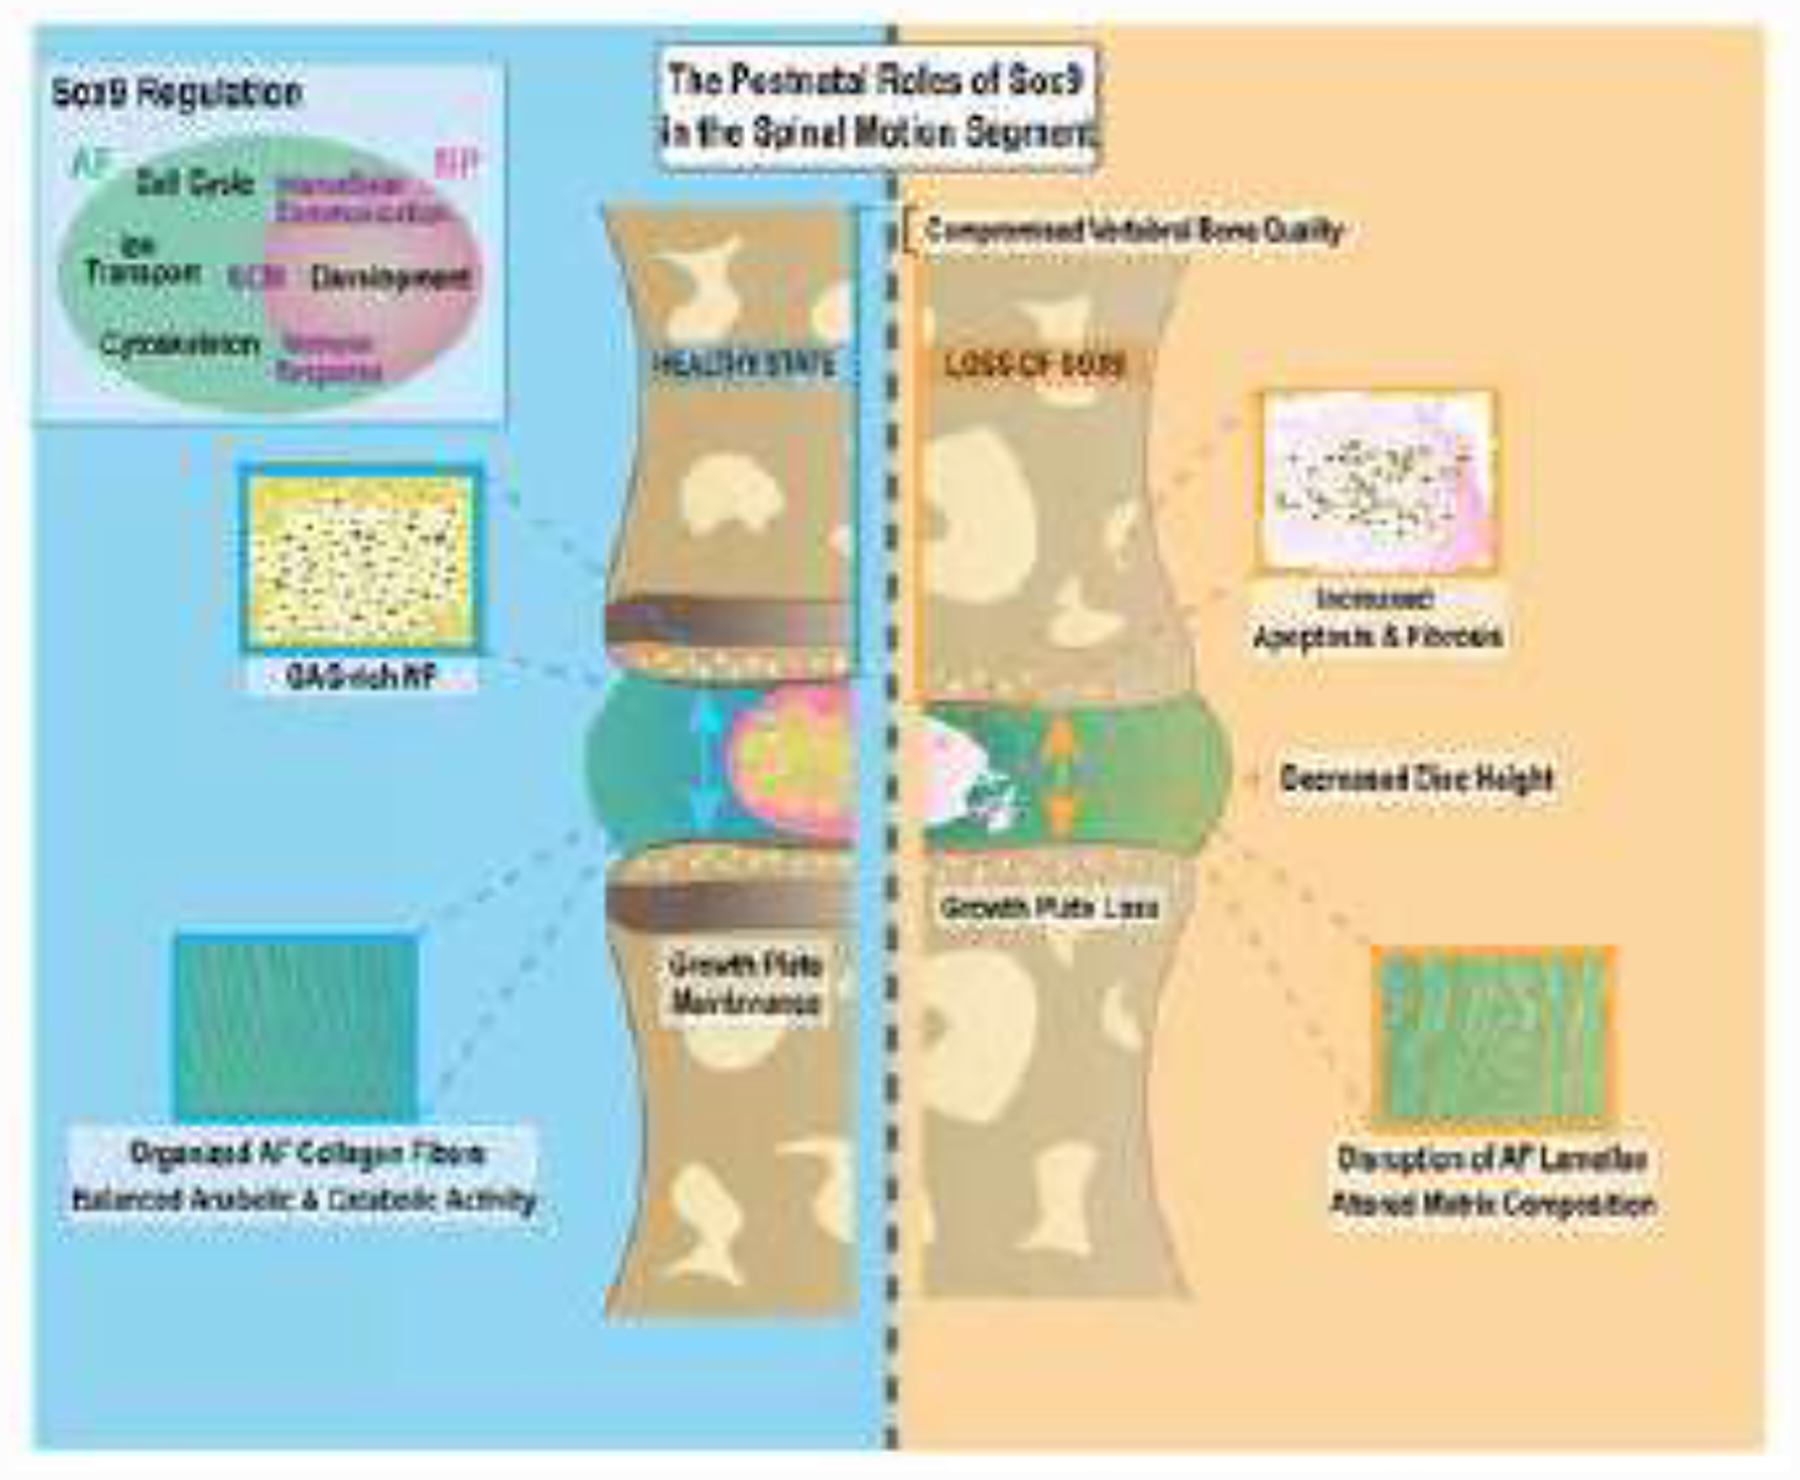
Schematic summarizing roles of SOX9 in post-natal maintenance of the intervertebral disc and its unique biological functions in the AF and NP compartments.
Discussion
The transcription factor SOX9 is critical for the embryonic development and postnatal maintenance of the intervertebral disc [17, 24, 45]. Embryonic inactivation of Sox9 in mice results in the loss of the notochord, preventing proper formation of the vertebral column [17]. While a degenerative spinal phenotype was previously reported in mice with postnatal Sox9 deletion, an understanding of disc compartment-specific temporal, cellular, and molecular changes contributing to this phenotype was still lacking [24, 45]. In this study, we provide novel insights into the phenotype of adult Sox9cKO mice.
Temporal histological characterizations uncovered an early and progressive GP loss, followed by fibrotic remodeling of the NP, and loss of demarcation between the NP and AF in Sox9 mutants. This phenotype was alluded to by previous work demonstrating severe changes in disc architecture following Sox9 deletion before and after mice achieved skeletal maturity [24]. Our findings expanded upon this work in adult mice, demonstrating that one month following Sox9 deletion, the EP was significantly disrupted, and by two months, all compartments exhibited compromised architecture. Given the critical role of the EP in nutrient diffusion into the avascular disc, and thereby disc cell viability, EP degeneration preceding AF and NP changes supports observations made by Fields and colleagues [7, 46]. This disc phenotype progressed with time, resulting in complete collapse of the disc by 12 months. Noteworthy, grading results suggested that these changes affected all compartments with equal severity. Moreover, level-by-level analysis of 5-month-old Sox9cKO mice clearly indicated lower lumbar levels were more prone to degenerative changes during the early stages of disease, an observation consistent with previous studies [47–49]. Our analysis suggests SOX9 directly impacts disc cell survival, as the NP and AF of Sox9cKO mice evidenced increased TUNEL staining, with more pronounced effects in the NP. Previous work demonstrated SOX9 indirectly mediates apoptotic events in NP cells and, in MSCs, attenuates expression of p21, a known pro-survival molecule in the NP [50, 51]. Further, a slow removal of dying cells was evident, as the elevated cell death index did not correlate with absolute cell counts in the NP. This is not surprising, considering the avascularity of the compartment and possibly compromised phagocytic capacity of surviving cells [52].
A lineage tracing strategy marking AcanCreERT2 cells with a tdTomato reporter supported the progressive loss of cells and correlated with histological degeneration. The fate mapping experiment combined with an EdU-chase assay also supported the hypothesis that SOX9 absence does not promote compensatory proliferation, rather contributes to cell survival. Additionally, a lack of evidence for the ingress of extradiscal (tdTOM-negative) cells, despite severe degeneration and remodeling of the compartments, suggests that in the absence of NP herniations and annular tears, immune cell ingress is unlikely. Given the chondrogenic nature of SOX9, it was important to delineate its direct impact on the disc cell phenotype. A subpopulation of the surviving cells lost their molecular identity, evidenced by the lost expression of disc markers CA3, GLUT-1, KRT19, and FMOD. However, unlike other mouse models of early onset disc degeneration or aging, these cells did not assume a hypertrophic chondrocyte-like identity, evident from the lack of prominent COL X and MMP13 staining in Sox9cKO discs [36, 53, 54].
Considering the function of the ECM in maintaining proper disc function and the role of SOX9 in controlling matrix gene expression in chondrocytes, substantial disc matrix remodeling was expected [55]. Despite decreased levels of COL I and II in the AF and evidence of severely disorganized collagen fiber architecture, the proportion of fibers with varying thicknesses remained unaltered. This suggested other fibrillar collagens may have compensated for COL I and II in the AF, an idea supported by FTIR spectroscopic measurements. By contrast, progressive disorganization of collagen could be a consequence of a loss of collagen-interacting and -stabilizing molecules, including FMOD, COMP, and ACAN (inner AF), as well as elevated MMP13 and ADAMTS activity [56–58]. These analyses further revealed the differential sensitivity of disc compartments to SOX9 deletion. Unlike the AF, the EP showed no changes in matrix composition; whereas the degenerated NP of 12-month-old mutants closely resembled the AF than healthy NP tissue, as seen by spectral clustering analysis. This is partially explained by the degradation of aggrecan (increased ARGxx levels in the NP) and increased collagen content, evident from FTIR spectroscopic imaging and CHP staining. This denatured NP collagenous matrix was not due to an increased abundance of COL I and II, as reported in other mouse models of disc degeneration [36]. Moreover, the similarity between the NP and AF gives credence to the idea that SOX9 is critical for the maintenance of the distinct compartmental identities[22]. Together, these results imply compromised disc functionality, providing a possible explanation for the discrepancies in trabecular and cortical bone properties in Sox9cKO vertebrae. Disc degeneration can offset loading on the spine, inducing remodeling responses in the vertebrae [12, 59]. The size difference in caudal and lumbar vertebrae, however, is most likely an attribute of Sox9 deletion impacting chondrocytes in the GP [16].
Despite several similarities between our phenotypic observations and the body off work regarding SOX9 in cartilaginous tissue, our analysis in its totality suggests unique SOX9-related transcriptional programs in the NP and AF. The results of our microarray experiments largely align with the downregulated genes reported by Henry and colleagues (with exceptions for Rspo4 and AA465934 transcripts) [24]. Additionally, our microarray data showed that 212 of 291 NP DEGs were significantly downregulated; whereas 375 of 786 AF DEGs were downregulated. It is likely that DEGs identified in our analysis are enriched with SOX9 transcriptional targets, as tissues were collected within five days of initiating SOX9 deletion; however, many indirectly regulated genes may have also been captured. This explains the contrast between the upregulated genes reported here and those previously identified by RNA-sequencing in animals analyzed one month after Sox9 inactivation [24].
When the concepts associated with NP and AF DEGs were compared, eliminating the overlap between datasets, we found the majority of concepts to be compartment-specific, despite two common super clusters (ECM and cell-cell communication) emerging from the overall analysis. At the gene level, limited overlap was observed among the most significant genes of these super clusters. This variation in genes, concepts, and themes culminating under the same categorical terms suggests the mechanisms through which SOX9 participates in ECM homeostasis and cell-cell communication differ across tissue types. Thematic organization observed, when up-and down-regulated DEGs were separated by disc compartment, evidenced this trend. At the thematic level, the cytoskeleton was significantly impacted by Sox9 inactivation in the AF and NP. In the AF, the upregulation of genes such as Acta1, Acta2, and Kif2c indicated AF cells may respond to the SOX9 deficiency-related destabilization of the native matrix by augmenting their cellular and matrix-based adhesion complexes [60]. On the other hand, the relationship between the cytoskeleton and SOX9 in the NP is captured by Krt8 and Krt20 being the most significant downregulated DEGs under this theme [61]. It is also interesting to note the apparent differences in SOX9 regulatory function between the NP and AF. Though alterations in signaling programs were apparent in both tissues, at the gene, conceptual, and thematic levels, the interplay between ion channels, mechanotransduction, and electrophysiology was predominant in the AF, following Sox9 inactivation. This finding complements a recent study, in which the AF was proposed to be more piezoelectric (largely due to collagen fibril organization) than the NP and previous findings of SOX9 directly controlling Trpv4 [24, 62, 63]. The TRP-family proteins are ion channels of particular interest, as they respond to osmotic and shear stress [64]. The observation that Trpv4, Trpm4, Trpm5, and Trpm7 are significantly downregulated in the AF of Sox9cKO mice in tandem with several other ion channels, including Piezo2 and Kcnip3, provides a strong indication that SOX9 expression is essential to maintaining electrochemical and osmotic gradients in the disc, especially in response to mechanical cues. These observations in Sox9cKO complement reports showing altered ion channel activity during disc degeneration in SM/J mice that evidence spontaneous degeneration and mice deficient in NFAT5, a key osmoregulatory protein [12, 65]. Of additional interest, Adgrg6 and Frzb were downregulated in the AF. Adgrg6 conditional knockout mice are predisposed to disc degeneration marked by endplate herniations [66]. Although animals in the present study did not show herniations, Sox9 expression was unchanged in the former study, suggesting that this gene may be directly or indirectly controlled by SOX9 [66]. FRZB is a WNT-binding protein that inhibits WNT signaling. Its downregulation is demonstrated in osteoarthritis, and disrupted WNT signaling is a feature of spontaneous intervertebral disc degeneration and aging [36, 39, 67]. Further, a ChIP-seq assay evidenced that SOX9 bound to Frzb regulatory sequences in a rat chondrosarcoma-derived cell line, suggesting this may also be the case in the AF [68].
In summary, our work provides detailed insights into disc degeneration in Sox9cKO mice at the cellular, molecular, and transcriptional levels, underscoring tissue-specific roles. This knowledge could be exploited for devising therapeutic strategies to treat intervertebral disc degeneration and, consequently, chronic low back pain. Reduced levels of SOX9 have been correlated with age-related disc degeneration, and SOX9 has long been speculated to be a potential therapeutic target to delay disc degeneration or restore a healthy disc phenotype [69, 70]. Demonstrating a clear, positive relationship between SOX9 expression, disc cellularity, and maintenance of a healthy ECM, our findings provide novel temporal insights into the relationship between disc health and SOX9 activity. Further, campomelic dysplasia (CMPD), a severe disorder linked to Sox9-inactivating heterozygous mutations, is characterized by generalized malformations of the endochondral skeleton and spinal deformations, largely attributed to improper vertebral development [71]. Work investigating disc degeneration in CMPD patients has yet to be conducted; however, results from the present study may offer insights into disease pathogenesis and a gateway into future studies.
Materials and Methods
Mice
All animal procedures were performed under protocols approved by the Institutional Animal Care and Use Committee (IACUC) of the Children’s Hospital of Philadelphia. Sox9 conditional knock-out (Sox9cKO: AcanCreERT2Sox9fl/fl) and control (Sox9CTR: Sox9fl/fl) mice were generated as shown in Figure 1A and analyzed after 1 week and 1 (4-month-old), 2 (5-month-old), and 9 (12-month-old) months post deletion to assess degeneration [24, 25]. These animals carried previously reported Sox9 conditional null (Sox9fl/fl) and AcanCreERT2 alleles [25, 26]. The Sox9 conditional allele was generated independently of the Sox9 conditional null allele used by Henry and colleagues, but both alleles are virtually identical [19, 24]. They harbor loxP sites flanking exons 2 and 3 of the Sox9 gene, which encode half of the DNA-binding HMG domain and the entire transactivation (TAD) domains, respectively. Cre-mediated recombination of these alleles result in complete inactivation of Sox9 in target cells [25, 26]. The AcanCreERT2 allele used in our study is the same as in the study by Henry and colleagues; here it is documented as AcanCreERT2, as opposed to Agc1CreERT2, because Acan is the HGNC-approved acronym for the aggrecan gene. To perform fate-mapping experiments, a loxP-stop-loxP tdTomato reporter mouse (Gt(ROSA)26Sortm9(CAG-tdTomato)Hze) (Stock # 007909, Jackson Labs) was crossed with mice with (AcanCreERT2Sox9fl/fl) or without (AcanCreERT2) conditional Sox9 loss, and tdTOM+ cells were followed over time [72]. For all experiments, 3-month-old female and male mice of all genotypes received an intraperitoneal injection of 100 mg/kg tamoxifen (Sigma-Aldrich, St. Louis, MO, USA) dissolved in olive oil (Sigma-Aldrich) for 2–5 consecutive days to activate Cre recombinase, and were analyzed at 5, 7, and 21 days as well as after 1 to 9 months to investigate the effects of Sox9 loss on disc health and the fate of resident cells.
Histological Analysis
Spines were dissected and immediately fixed in freshly made 4% paraformaldehyde (PFA) for 48 hours, followed by decalcification in 20% EDTA at 4°C prior to embedding in paraffin. Lumbar motion segments at 4 months (n=4 discs/animal, 4 animals/genotype,16 total discs/genotype) and 5 months (n=6 discs/animal, 5 animals/genotype, 30 total discs/genotype) were processed in addition to lumbar and caudal motions segments at 12 months (n=3 lumbar discs/animal, 5 caudal discs/animal, 10 animals/genotype, 30 lumbar and 50 caudal discs/genotype). Coronal sections 7 μm in thickness were stained with 1% Safranin-O, 0.05% Fast Green, and 1% Hematoxylin to assess morphology and imaged on an Axio Imager A2 microscope using 5x/0.15 N-Achroplan or 20x/0.5 EC Plan-Neofluar (Carl Zeiss) objectives, Axiocam 105 color camera, and Zen2™ software (Carl Zeiss AG, Germany). To evaluate disc degeneration, 4 blinded observers used a Modified Thompson grading scale for the NP and AF and the method reported by Tessier et al. for the EP to perform histological scoring of 4, 5- and 12-month-old Sox9CTR and Sox9cKO animals [27–29, 52]. For both grading scales, higher scores reflect a higher degree of degeneration.
TUNEL Assay and Cell Number Quantification
TUNEL assay was performed on 4- (n=4 discs/animal, 4 animals/genotype, 16 total discs/genotype) and 5-month-old (n=5 discs/animal, 5 animals/genotype, 25 total discs/genotype) disc tissue sections using an “in situ cell death detection” kit (Roche Diagnostic). Briefly, sections were deparaffinized and permeabilized with Proteinase K (20 μg/mL) for 15 min at room temperature. Then TUNEL assay was carried out per manufacturer’s protocol. The sections were washed and mounted with ProLong® Gold Antifade Mountant with DAPI (Thermo Fisher Scientific, P36934). All mounted slides were imaged with an Axio Imager 2 microscope using 5×/0.15 N- Achroplan or 10×/0.3 EC Plan-Neofluar or 20x/0.5 EC Plan-Neofluar objectives (Carl Zeiss) objectives, X-Cite® 120Q Excitation Light Source (Excelitas), AxioCam MRm camera (Carl Zeiss), and Zen2™ software (Carl Zeiss). TUNEL-positive cells and DAPI-positive cells were analyzed respectively to assess cell death and cell number in disc compartments.
Micro-Computed Tomography (μCT) Analysis
μCT imaging was performed on the lumbar and caudal spine of 12-month-old Sox9CTR and Sox9cKO mice (n=4 discs/spine region/animal, 10 mice/genotype, 40 total discs/genotype) using the high-resolution μCT scanner (Skyscan 1272, Bruker, Belgium). Samples were placed in PBS and scanned with an energy of 50kVp and current of 200μA resulting in 15 μm3 voxel size resolution. Intervertebral disc height and the length of the vertebral bones were measured and averaged along the dorsal, midline, and ventral regions in the sagittal plane. Disc height index (DHI) was calculated as previously described [12]. The 3-D microarchitecture of the trabecular bone was tabulated in a region of interest (ROI) defined by contouring the outer boundary of the trabeculae throughout the vertebral body. Resulting datasets were assessed for the following parameters: trabecular separation (Tb. Sp.), trabecular thickness (Tb. Th.), trabecular number (Tb. N.), bone volume fraction (BV/TV), and structure model index (SMI). The cortical bone was analyzed in two dimensions and assessed for mean cross-sectional bone thickness (Cs. Th.), bone volume fraction (BV/TV), and bone volume (BV).
EdU-Chase Assay
EdU-based assay was performed on 4- and 5-month-old lumbar spines (n=2 discs/animal, 4 animals/genotype/time point, 8 total discs/genotype/time point) to assess cell proliferation in situ. Mice were injected with EdU 6 hours prior to tissue collection, using methods previously described [73]. Incorporation was assessed using the Click-iT™ EdU Alexa Fluor™ 594 Imaging Kit per the manufacturer’s protocol (Invitrogen, Carlsbad, CA). The sections were then washed, mounted, and imaged as described above. EdU-positive cells were measured to assess the index of proliferative cells.
Picrosirius Red Analysis
Picrosirius Red staining and analysis was performed on 5- (n=4 discs/animal, 5 animals/genotype, 20 total discs/genotype) and 12-month-old (n=3 discs/animal, 6 animals/genotype, 18 total discs/genotype) caudal spines to visualize the heterogeneity of collagen organization using a polarizing, light microscope, Eclipse LV100 POL (Nikon, Tokyo, Japan) with a 10x/0.25 Pol/WD 7.0 objective Nikon’s Digital Sight DS-Fi2 camera. Images were analyzed in the NIS Elements Viewer software (Nikon, Tokyo, Japan). Under polarized light, stained collagen bundles appear either green, yellow, or red pixels that correlate to fiber thickness. Color threshold levels remained constant.
FTIR Spectroscopic Imaging and Spectral Clustering Analysis
5 μm deparaffinized sections of decalcified mouse caudal disc tissues were collected from control and mutant animals at the 1-year (n=1 disc/animal, 10 animals/genotype, 10 total discs/genotype) and 5-month (n=1 disc/animal, 5 animals/genotype, 5 total discs/genotype) time points and used to acquire FTIR (Fourier Transform Infrared) spectral imaging data using methods previously described [12]. Briefly, spectra were collected across the mid-IR region of three consecutive sections/disc to minimize section-based variation. Using the ISys Chemical Imaging Analysis software (v. 5.0.0.14) mean second-derivative absorbances in the amide I (1660 cm−1), collagen side-chain vibration (1338 cm−1), and proteoglycan sugar ring (1156 cm−1) regions were quantified and compared in control and mutant AF, NP, and EP disc compartments at both time points. Significant differences in parameters were assessed by t-test or Mann-Whitney test, where relevant; p < 0.05 was considered significant.
Collected spectra were analyzed using K-means clustering analysis in the Eigenvector Solo+MIA software (v. 8.8) to agnostically delineate anatomical regions within the disc, using methods previously reported [36]. Briefly, regions of IR images are separated into two or more classes, or “clusters,” according to spectral similarity. The K- means partitional clustering method starts with the manually defined selection of K objects that are to be used as cluster targets, where K is determined a priori; in our analyses, K = 7. During each iteration, the remaining objects (pixels of the spectral image) are assigned to one of these clusters based on the distance from each of the K targets. New cluster targets are then calculated as the means of the objects in each cluster, and the procedure is repeated until no objects are reassigned after the updated mean calculations.
Immunofluorescence Microscopy
Mid-coronal 7 μm sections of lumbar discs from 4- (n=2–4 discs/animal, 4 animals/genotype, 8–15 discs/genotype/stain), 5- (n=2–4 discs/animal, 5 animals/genotype, 10–16 discs/genotype/stain), and 12-month-old (n=1–3 discs/animal, 6 animals/genotype, 9–16 discs/genotype/stain) animals were processed and evaluated by quantitative immunohistochemistry. Paraffin-embedded samples were deparaffinized in histoclear and rehydrated in ethanol prior to antigen retrieval. Antigen retrieval methods included a 20-min incubation in hot citrate buffer, a 10-min incubation at room temperature with proteinase K, or a 30-min incubation at 37°C with Chondroitinase ABC. Sections were then blocked in 5% or 10% normal serum (Thermo Fisher Scientific, 10,000C) in PBS-T (0.4% Triton X-100 in PBS), and incubated with primary antibodies against CA3 (1:150; Santa Cruz Biotechnology; sc-50715), keratin-19 (1:50; DSHB; TROMA-III), fibromodulin (1:100; Abcam; ab81443), and MMP13 (1:200; Abcam; ab39012), aggrecan (1:50; Millipore; AB1031), collagen I (1:100; Abcam; ab34710), collagen II (1:400; Fitzgerald; 70R-CR008), collagen X (1:500; Abcam; ab58632), and COMP (1:200; Abcam; ab231977) in blocking buffer overnight at 4°C. For GLUT-1 (1:200; Abcam; ab40084), ARGxx (1:200; Abcam; ab3773), and chondroitin sulfate (1:300; Abcam; ab11570) staining, a Mouse on Mouse Kit (Vector Laboratories, Burlingame, CA, USA) was used for blocking and subsequent incubation with primary antibodies. Then, sections were washed and incubated with Alexa Fluor-594 or −488 conjugated secondary antibody (1:700; Jackson ImmunoResearch Laboratories, Inc., West Grove, PA, USA) for 1h at room temperature prior to being washed, mounted, and imaged as described above.
Denatured Collagen Hybridizing Peptide (CHP) Assay
Lumbar spines from 12-month-old animals (n=1–3 discs/animal, 5 animals/genotype, 12–15 total discs/genotype) were fixed for 6h in 4% PFA, decalcified in 20% EDTA and then immersed in 30% sucrose prior to OCT-embedding and snap-freezing in a liquid nitrogen bath. 10 μm frozen-cut sections were washed twice with PBS for 5 minutes, and the F-CHP (3Helix) was applied according to the manufacturer’s protocol. Sections were washed and mounted, and images were acquired as described above.
Digital Image Analysis
All immunohistological quantification was conducted in greyscale using the Fiji package of ImageJ [74]. Images were thresholded to create binary images, and NP and AF compartments were manually segmented using the Freehand Tool. These defined regions of interest were analyzed either using the Analyze Particles (TUNEL and cell number quantification) function or the Area Fraction measurement.
RNA Isolation
NP and AF tissues were separately micro-dissected from Sox9CTR and Sox9cKO animals under a stereo microscope (Zeiss, Stemi 503) and immediately placed in RNAlater® Reagent (Invitrogen, Carlsbad, CA) as previously described [52]. For each animal, tissues from L1-S1 and C1-C12 were pooled to serve as a single sample (n=17 discs/animal, 4 animals/genotype). NP and AF tissues were homogenized with a Pellet Pestle Motor (Sigma Aldrich, Z359971), and RNA was extracted from the lysates using an RNeasy® Mini kit (Qiagen).
Microarray Assay and Bioinformatic Analysis
Purified DNA-free RNA was quantified and quality was assessed using a Nanodrop ND- 100 spectrophotometer (Thermo Fisher Scientific) and Agilent 2200 TapeStation (Agilent Technologies, Palo Alto, CA, USA) respectively. The GeneChip WT Plus kit (Thermo Fisher Scientific) was used to synthesize fragmented biotin-labeled cDNA. Mouse Clariom S gene chips were hybridized with fragmented, biotin-labeled cDNA in 100 μL of hybridization cocktail. Arrays were washed and stained with GeneChip hybridization wash and stain kit using GeneChip Fluidics Station 450 (Thermo Fisher Scientific) and subsequently scanned on an Affymetrix GeneChip Scanner 3000 7G, using Command Console Software (Affymetrix, Santa Clara, CA, USA). CHP files were generated by sst- rma normalization from CEL files and quality control of the experiment was performed in the Transcriptome Analysis Console (TAC) v4.0.2 (Affymetrix). The experimental group was compared to the control group in the TAC, including all probe sets where at least 50% of the samples had a DABG (detected above background) p < 0.05. Inclusion cutoffs were defined at a 1.75-fold change and p-value < 0.05. Significantly differentially up- and down-regulated genes from the NP and AF compartments were analyzed using the GTAC-CompBio Analysis Tool (PercayAI Inc., St. Louis, MO) [38].
CompBio performs a literature analysis to identify relevant biological processes and pathways represented by the input differentially expressed entities, in this case, DEGs. This is accomplished with an automated Biological Knowledge Generation Engine (BKGE) that extracts all abstracts from PubMed that reference entities of interest (or their synonyms), using contextual language processing and a biological language dictionary that is not restricted to fixed pathway and ontology knowledge bases. Conditional probability analysis is utilized to compute the statistical enrichment of biological concepts (processes/pathways) over those that occur by random sampling. Related concepts built from the list of differentially expressed entities are further clustered into higher-level themes (e.g., biological pathways/processes, cell types, and structures, etc.). Within CompBio, scoring of entity (DEG), concept, and overall theme enrichment is accomplished using a multi-component function referred to as the Normalized Enrichment Score (NES). The first component utilizes an empirical p-value derived from several thousand random entity lists of comparable size to the user’s input entity list to define the rarity of a given entity-concept event. The second component, effectively representing the fold enrichment, is based on the ratio of the concept enrichment score to the mean of that concept’s enrichment score across the set of randomized entity data. As such, the NES reflects the rarity of the concept event associated with an entity list, as well as its degree of overall enrichment. Based on these empirical criteria, observed entity-concept scores above 10.0, 100.0, and 1000.0 are labeled as moderate, marked, or high in level of enrichment above random. Themes scoring above 500.0, 1000.0, and 5000.0 are labeled similarly.
The program was further used to compare the NP and AF profiles at the concept level. This was done through the consideration of the biological terms/concepts to create a difference filter. This filter, when applied, revealed the unique concepts within each theme, represented as a fraction in parenthesis. Coloring of the theme halos represent the percent of unique concepts, with red (≥ 76%) indicating the most, and blue (≤ 25%) indicating the fewest unique concepts. Orange and green are intermediate, indicating 51–75% and 25–50% respectively.
Real-Time qRT-PCR
Purified DNA- free RNA was converted to cDNA using EcoDryTM Premix (Clontech Laboratories, Palo Alto, CA, USA). Template cDNA and gene-specific primers were combined with SYBR Green master mix (Applied Biosystems, Foster City, CA, USA) and mRNA expression was quantified using the Step One Plus Real- time PCR System (Applied Biosystems). Gene expression was normalized to GAPDH. Specificity and the absence of primer dimer formation were confirmed through melting curve analysis. All samples were assessed in duplicate included a template-free control, and were cycled using a previously described program [27]. Primers were synthesized by Integrated DNA Technologies (Coralville, IA, USA) and as are listed in Supplementary Table 5.
Statistics
Statistical analysis was performed using Prism 8 (GraphPad, La Jolla, CA, USA) with data presented as mean ± standard deviation (SD). Differences between distributions were checked for normality using Shapiro-Wilk tests and further analyzed using an unpaired t-test for normally distributed data and the Mann-Whitney U test for non-normally distributed data. Comparison of multiple distributions of non-normally distributed data used Kruskal-Wallis and Dunn’s multiple comparison tests; whereas normally distributed data were compared using one-way ANOVA with a posthoc Tukey’s multiple comparison test [27]. Analyses of Modified Thompson Grading data distributions and fiber thickness distributions were performed using a χ2 test at a 0.05 level of significance.
Supplementary Material
Highlights.
Sox9 deletion in discs of skeletally mature mice causes progressive degeneration
Sox9 conditional knockout mice show progressive loss of disc cells
Deletion of Sox9 results in extracellular matrix remodeling and changes in disc cell phenotype
Sox9 regulates distinct transcriptomic landscapes in nucleus pulposus and annulus fibrosus tissue compartments
Acknowledgments
This work was supported by grants from the NIH/NIAMS R01 AR055655, AR064733, AR074813 (MVR), and AR072649 (VL). Maria Tsingas and Olivia Ottone are supported by an NIH/NIAMS T32 AR052273 grant. We thank the Sidney Kimmel Cancer Center Cancer Genomics Facility of Thomas Jefferson University, Philadelphia for their role in performing the microarray analysis.
Footnotes
Publisher's Disclaimer: This is a PDF file of an unedited manuscript that has been accepted for publication. As a service to our customers we are providing this early version of the manuscript. The manuscript will undergo copyediting, typesetting, and review of the resulting proof before it is published in its final form. Please note that during the production process errors may be discovered which could affect the content, and all legal disclaimers that apply to the journal pertain.
Competing Interests
R.A. Barve may receive royalty income based on the CompBio technology developed by R.A. Barve and licensed by Washington University to PercayAI.
The remaining authors declare they have no competing interests to disclose in relation to the contents of this article.
Bibliography
- 1.Katz JN (2006). Lumbar disc disorders and low-back pain: socioeconomic factors and consequences. J Bone Joint Surg Am 88 Suppl 2, 21–24. doi: 10.2106/JBJS.E.01273 [DOI] [PubMed] [Google Scholar]
- 2.Murray CJL, Atkinson C, Bhalla K, et al. (2013). The state of US health, 1990–2010: burden of diseases, injuries, and risk factors. JAMA 310, 591–608. doi: 10.1001/jama.2013.13805 [DOI] [PMC free article] [PubMed] [Google Scholar]
- 3.Global Burden of Disease Study 2013 Collaborators (2015). Global, regional, and national incidence, prevalence, and years lived with disability for 301 acute and chronic diseases and injuries in 188 countries, 1990–2013: a systematic analysis for the Global Burden of Disease Study 2013. Lancet 386, 743–800. doi: 10.1016/S0140-6736(15)60692-4 [DOI] [PMC free article] [PubMed] [Google Scholar]
- 4.Arnbak B, Jensen TS, Egund N, et al. (2016). Prevalence of degenerative and spondyloarthritis-related magnetic resonance imaging findings in the spine and sacroiliac joints in patients with persistent low back pain. Eur Radiol 26, 1191–1203. doi: 10.1007/s00330-015-3903-0 [DOI] [PubMed] [Google Scholar]
- 5.Livshits G, Popham M, Malkin I, et al. (2011). Lumbar disc degeneration and genetic factors are the main risk factors for low back pain in women: the UK Twin Spine Study. Ann Rheum Dis 70, 1740–1745. doi: 10.1136/ard.2010.137836 [DOI] [PMC free article] [PubMed] [Google Scholar]
- 6.Risbud MV, Schipani E, Shapiro IM (2010). Hypoxic regulation of nucleus pulposus cell survival: from niche to notch. Am J Pathol 176, 1577–1583. doi: 10.2353/ajpath.2010.090734 [DOI] [PMC free article] [PubMed] [Google Scholar]
- 7.Dolor A, Sampson SL, Lazar AA, et al. (2019). Matrix modification for enhancing the transport properties of the human cartilage endplate to improve disc nutrition. PLoS One 14, e0215218. doi: 10.1371/journal.pone.0215218 [DOI] [PMC free article] [PubMed] [Google Scholar]
- 8.Sivan SS, Wachtel E, Roughley P (2014). Structure, function, aging and turnover of aggrecan in the intervertebral disc. Biochim Biophys Acta 1840, 3181–3189. doi: 10.1016/j.bbagen.2014.07.013 [DOI] [PubMed] [Google Scholar]
- 9.Adams MA, Roughley PJ (2006). What is intervertebral disc degeneration, and what causes it? Spine 31, 2151–2161. doi: 10.1097/01.brs.0000231761.73859.2c [DOI] [PubMed] [Google Scholar]
- 10.Silagi ES, Shapiro IM, Risbud MV (2018). Glycosaminoglycan synthesis in the nucleus pulposus: Dysregulation and the pathogenesis of disc degeneration. Matrix Biol 71–72, 368–379. doi: 10.1016/j.matbio.2018.02.025 [DOI] [PMC free article] [PubMed] [Google Scholar]
- 11.Merceron C, Mangiavini L, Robling A, et al. (2014). Loss of HIF-1α in the notochord results in cell death and complete disappearance of the nucleus pulposus. PLoS One 9, e110768. doi: 10.1371/journal.pone.0110768 [DOI] [PMC free article] [PubMed] [Google Scholar]
- 12.Tessier S, Tran VA, Ottone OK, et al. (2020). TonEBP-deficiency accelerates intervertebral disc degeneration underscored by matrix remodeling, cytoskeletal rearrangements, and changes in proinflammatory gene expression. Matrix Biol 87, 94–111. doi: 10.1016/j.matbio.2019.10.007 [DOI] [PMC free article] [PubMed] [Google Scholar]
- 13.Garantziotis S, Savani RC (2019). Hyaluronan biology: A complex balancing act of structure, function, location and context. Matrix Biol 78–79, 1–10. doi: 10.1016/j.matbio.2019.02.002 [DOI] [PMC free article] [PubMed] [Google Scholar]
- 14.Pan H, Strickland A, Madhu V, et al. (2019). RNA binding protein HuR regulates extracellular matrix gene expression and pH homeostasis independent of controlling HIF-1α signaling in nucleus pulposus cells. Matrix Biol 77, 23–40. doi: 10.1016/j.matbio.2018.08.003 [DOI] [PMC free article] [PubMed] [Google Scholar]
- 15.Lefebvre V, Huang W, Harley VR, et al. (1997). SOX9 is a potent activator of the chondrocyte-specific enhancer of the pro alpha1(II) collagen gene. Mol Cell Biol 17, 2336–2346. doi: 10.1128/mcb.17.4.2336 [DOI] [PMC free article] [PubMed] [Google Scholar]
- 16.Lefebvre V, Dvir-Ginzberg M (2017). SOX9 and the many facets of its regulation in the chondrocyte lineage. Connect Tissue Res 58, 2–14. doi: 10.1080/03008207.2016.1183667 [DOI] [PMC free article] [PubMed] [Google Scholar]
- 17.Barrionuevo F, Taketo MM, Scherer G, Kispert A (2006). Sox9 is required for notochord maintenance in mice. Dev Biol 295, 128–140. doi: 10.1016/j.ydbio.2006.03.014 [DOI] [PubMed] [Google Scholar]
- 18.Lefebvre V (2019). Roles and regulation of SOX transcription factors in skeletogenesis. Curr Top Dev Biol 133, 171–193. doi: 10.1016/bs.ctdb.2019.01.007 [DOI] [PMC free article] [PubMed] [Google Scholar]
- 19.Akiyama H, Chaboissier M-C, Martin JF, et al. (2002). The transcription factor Sox9 has essential roles in successive steps of the chondrocyte differentiation pathway and is required for expression of Sox5 and Sox6. Genes Dev 16, 2813–2828. doi: 10.1101/gad.1017802 [DOI] [PMC free article] [PubMed] [Google Scholar]
- 20.Oh C, Lu Y, Liang S, et al. (2014). SOX9 regulates multiple genes in chondrocytes, including genes encoding ECM proteins, ECM modification enzymes, receptors, and transporters. PLoS One 9, e107577. doi: 10.1371/journal.pone.0107577 [DOI] [PMC free article] [PubMed] [Google Scholar]
- 21.Bi W, Deng JM, Zhang Z, et al. (1999). Sox9 is required for cartilage formation. Nat Genet 22, 85–89. doi: 10.1038/8792 [DOI] [PubMed] [Google Scholar]
- 22.Sugimoto Y, Takimoto A, Akiyama H, et al. (2013). Scx+/Sox9+ progenitors contribute to the establishment of the junction between cartilage and tendon/ligament. Development 140, 2280–2288. doi: 10.1242/dev.096354 [DOI] [PubMed] [Google Scholar]
- 23.Smits P, Lefebvre V (2003). Sox5 and Sox6 are required for notochord extracellular matrix sheath formation, notochord cell survival and development of the nucleus pulposus of intervertebral discs. Development 130, 1135–1148. doi: 10.1242/dev.00331 [DOI] [PubMed] [Google Scholar]
- 24.Henry SP, Liang S, Akdemir KC, de Crombrugghe B (2012). The postnatal role of Sox9 in cartilage. J Bone Miner Res 27, 2511–2525. doi: 10.1002/jbmr.1696 [DOI] [PMC free article] [PubMed] [Google Scholar]
- 25.Kist R, Schrewe H, Balling R, Scherer G (2002). Conditional inactivation ofSox9: A mouse model for campomelic dysplasia. Genesis 32, 121–123. doi: 10.1002/gene.10050 [DOI] [PubMed] [Google Scholar]
- 26.Henry SP, Jang C-W, Deng JM, et al. (2009). Generation of aggrecan-CreERT2 knockin mice for inducible Cre activity in adult cartilage. Genesis 47, 805–814. doi: 10.1002/dvg.20564 [DOI] [PMC free article] [PubMed] [Google Scholar]
- 27.Novais EJ, Diekman BO, Shapiro IM, Risbud MV (2019). p16Ink4a deletion in cells of the intervertebral disc affects their matrix homeostasis and senescence associated secretory phenotype without altering onset of senescence. Matrix Biol 82, 54–70. doi: 10.1016/j.matbio.2019.02.004 [DOI] [PMC free article] [PubMed] [Google Scholar]
- 28.Tessier S, Doolittle AC, Sao K, et al. (2020). Arp2/3 inactivation causes intervertebral disc and cartilage degeneration with dysregulated TonEBP-mediated osmoadaptation. JCI Insight. doi: 10.1172/jci.insight.131382 [DOI] [PMC free article] [PubMed] [Google Scholar]
- 29.Thompson JP, Pearce RH, Schechter MT, et al. (1990). Preliminary evaluation of a scheme for grading the gross morphology of the human intervertebral disc. Spine 15, 411–415. doi: 10.1097/00007632-199005000-00012 [DOI] [PubMed] [Google Scholar]
- 30.Silagi ES, Novais EJ, Bisetto S, et al. (2020). Lactate efflux from intervertebral disc cells is required for maintenance of spine health. J Bone Miner Res 35, 550–570. doi: 10.1002/jbmr.3908 [DOI] [PMC free article] [PubMed] [Google Scholar]
- 31.Sakai D, Nakamura Y, Nakai T, et al. (2012). Exhaustion of nucleus pulposus progenitor cells with ageing and degeneration of the intervertebral disc. Nat Commun 3, 1264. doi: 10.1038/ncomms2226 [DOI] [PMC free article] [PubMed] [Google Scholar]
- 32.Henriksson H, Thornemo M, Karlsson C, et al. (2009). Identification of cell proliferation zones, progenitor cells and a potential stem cell niche in the intervertebral disc region: a study in four species. Spine 34, 2278–2287. doi: 10.1097/BRS.0b013e3181a95ad2 [DOI] [PubMed] [Google Scholar]
- 33.Dahia CL, Mahoney EJ, Durrani AA, Wylie C (2009). Postnatal growth, differentiation, and aging of the mouse intervertebral disc. Spine 34, 447–455. doi: 10.1097/BRS.0b013e3181990c64 [DOI] [PubMed] [Google Scholar]
- 34.Shu CC, Flannery CR, Little CB, Melrose J (2019). Catabolism of Fibromodulin in Developmental Rudiment and Pathologic Articular Cartilage Demonstrates Novel Roles for MMP-13 and ADAMTS-4 in C-terminal Processing of SLRPs. Int J Mol Sci. doi: 10.3390/ijms20030579 [DOI] [PMC free article] [PubMed] [Google Scholar]
- 35.Steplewski A, Fertala J, Beredjiklian PK, et al. (2017). Blocking collagen fibril formation in injured knees reduces flexion contracture in a rabbit model. J Orthop Res 35, 1038–1046. doi: 10.1002/jor.23369 [DOI] [PubMed] [Google Scholar]
- 36.Choi H, Tessier S, Silagi ES, et al. (2018). A novel mouse model of intervertebral disc degeneration shows altered cell fate and matrix homeostasis. Matrix Biol 70, 102–122. doi: 10.1016/j.matbio.2018.03.019 [DOI] [PMC free article] [PubMed] [Google Scholar]
- 37.Ishii Y, Thomas AO, Guo XE, et al. (2006). Localization and distribution of cartilage oligomeric matrix protein in the rat intervertebral disc. Spine 31, 1539–1546. doi: 10.1097/01.brs.0000221994.61882.4a [DOI] [PubMed] [Google Scholar]
- 38.Cowardin CA, Ahern PP, Kung VL, et al. (2019). Mechanisms by which sialylated milk oligosaccharides impact bone biology in a gnotobiotic mouse model of infant undernutrition. Proc Natl Acad Sci USA 116, 11988–11996. doi: 10.1073/pnas.1821770116 [DOI] [PMC free article] [PubMed] [Google Scholar]
- 39.Winkler T, Mahoney EJ, Sinner D, et al. (2014). Wnt signaling activates Shh signaling in early postnatal intervertebral discs, and re-activates Shh signaling in old discs in the mouse. PLoS One 9, e98444. doi: 10.1371/journal.pone.0098444 [DOI] [PMC free article] [PubMed] [Google Scholar]
- 40.Walter BA, Purmessur D, Moon A, et al. (2016). Reduced tissue osmolarity increases TRPV4 expression and pro-inflammatory cytokines in intervertebral disc cells. Eur Cell Mater 32, 123–136. doi: 10.22203/ecm.v032a08 [DOI] [PMC free article] [PubMed] [Google Scholar]
- 41.Cs-Szabo G, Ragasa-San Juan D, Turumella V, et al. (2002). Changes in mRNA and protein levels of proteoglycans of the anulus fibrosus and nucleus pulposus during intervertebral disc degeneration. Spine 27, 2212–2219. doi: 10.1097/01.BRS.0000029249.02864.5B [DOI] [PubMed] [Google Scholar]
- 42.Robinson KA, Sun M, Barnum CE, et al. (2017). Decorin and biglycan are necessary for maintaining collagen fibril structure, fiber realignment, and mechanical properties of mature tendons. Matrix Biol 64, 81–93. doi: 10.1016/j.matbio.2017.08.004 [DOI] [PMC free article] [PubMed] [Google Scholar]
- 43.Dahia CL, Mahoney E, Wylie C (2012). Shh signaling from the nucleus pulposus is required for the postnatal growth and differentiation of the mouse intervertebral disc. PLoS One 7, e35944. doi: 10.1371/journal.pone.0035944 [DOI] [PMC free article] [PubMed] [Google Scholar]
- 44.Silva MJ, Holguin N (2020). Aging aggravates intervertebral disc degeneration by regulating transcription factors toward chondrogenesis. FASEB J 34, 1970–1982. doi: 10.1096/fj.201902109R [DOI] [PMC free article] [PubMed] [Google Scholar]
- 45.Oh C, Yasuda H, Zhao W, et al. (2016). SOX9 directly Regulates CTGF/CCN2 Transcription in Growth Plate Chondrocytes and in Nucleus Pulposus Cells of Intervertebral Disc. Sci Rep 6, 29916. doi: 10.1038/srep29916 [DOI] [PMC free article] [PubMed] [Google Scholar]
- 46.Wong J, Sampson SL, Bell-Briones H, et al. (2019). Nutrient supply and nucleus pulposus cell function: effects of the transport properties of the cartilage endplate and potential implications for intradiscal biologic therapy. Osteoarthr Cartil 27, 956–964. doi: 10.1016/j.joca.2019.01.013 [DOI] [PMC free article] [PubMed] [Google Scholar]
- 47.Vincent K, Mohanty S, Pinelli R, et al. (2019). Aging of mouse intervertebral disc and association with back pain. Bone 123, 246–259. doi: 10.1016/j.bone.2019.03.037 [DOI] [PMC free article] [PubMed] [Google Scholar]
- 48.Tessier S, Madhu V, Johnson ZI, et al. (2019). NFAT5/TonEBP controls early acquisition of notochord phenotypic markers, collagen composition, and sonic hedgehog signaling during mouse intervertebral disc embryogenesis. Dev Biol 455, 369–381. doi: 10.1016/j.ydbio.2019.07.004 [DOI] [PMC free article] [PubMed] [Google Scholar]
- 49.Battié MC, Videman T, Levälahti E, et al. (2008). Genetic and environmental effects on disc degeneration by phenotype and spinal level: a multivariate twin study. Spine 33, 2801–2808. doi: 10.1097/BRS.0b013e31818043b7 [DOI] [PubMed] [Google Scholar]
- 50.Lv J, Li S, Wan T, et al. (2018). Inhibition of microRNA-30d attenuates the apoptosis and extracellular matrix degradation of degenerative human nucleus pulposus cells by up-regulating SOX9. Chem Biol Interact 296, 89–97. doi: 10.1016/j.cbi.2018.09.010 [DOI] [PubMed] [Google Scholar]
- 51.Stöckl S, Bauer RJ, Bosserhoff AK, et al. (2013). Sox9 modulates cell survival and adipogenic differentiation of multipotent adult rat mesenchymal stem cells. J Cell Sci 126, 2890–2902. doi: 10.1242/jcs.124305 [DOI] [PubMed] [Google Scholar]
- 52.Gorth DJ, Ottone OK, Shapiro IM, Risbud MV (2020). Differential Effect of Long-Term Systemic Exposure of TNFα on Health of the Annulus Fibrosus and Nucleus Pulposus of the Intervertebral Disc. J Bone Miner Res 35, 725–737. doi: 10.1002/jbmr.3931 [DOI] [PMC free article] [PubMed] [Google Scholar]
- 53.Novais EJ, Tran VA, Miao J, et al. (2020). Comparison of inbred mouse strains shows diverse phenotypic outcomes of intervertebral disc aging. Aging Cell 19, e13148. doi: 10.1111/acel.13148 [DOI] [PMC free article] [PubMed] [Google Scholar]
- 54.Mohanty S, Pinelli R, Pricop P, et al. (2019). Chondrocyte-like nested cells in the aged intervertebral disc are late-stage nucleus pulposus cells. Aging Cell 18, e13006. doi: 10.1111/acel.13006 [DOI] [PMC free article] [PubMed] [Google Scholar]
- 55.Karamanos NK, Theocharis AD, Neill T, Iozzo RV (2019). Matrix modeling and remodeling: A biological interplay regulating tissue homeostasis and diseases. Matrix Biol 75–76, 1–11. doi: 10.1016/j.matbio.2018.08.007 [DOI] [PMC free article] [PubMed] [Google Scholar]
- 56.Han L, Grodzinsky AJ, Ortiz C (2011). Nanomechanics of the cartilage extracellular matrix. Annu Rev Mater Res 41, 133–168. doi: 10.1146/annurev-matsci-062910-100431 [DOI] [PMC free article] [PubMed] [Google Scholar]
- 57.Tillgren V, Mörgelin M, Önnerfjord P, et al. (2016). The tyrosine sulfate domain of fibromodulin binds collagen and enhances fibril formation. J Biol Chem 291, 23744–23755. doi: 10.1074/jbc.M116.730325 [DOI] [PMC free article] [PubMed] [Google Scholar]
- 58.Halász K, Kassner A, Mörgelin M, Heinegård D (2007). COMP acts as a catalyst in collagen fibrillogenesis. J Biol Chem 282, 31166–31173. doi: 10.1074/jbc.M705735200 [DOI] [PubMed] [Google Scholar]
- 59.Simpson EK, Parkinson IH, Manthey B, Fazzalari NL (2001). Intervertebral disc disorganization is related to trabecular bone architecture in the lumbar spine. J Bone Miner Res 16, 681–687. doi: 10.1359/jbmr.2001.16.4.681 [DOI] [PubMed] [Google Scholar]
- 60.Bachir AI, Horwitz AR, Nelson WJ, Bianchini JM (2017). Actin-Based Adhesion Modules Mediate Cell Interactions with the Extracellular Matrix and Neighboring Cells. Cold Spring Harb Perspect Biol. doi: 10.1101/cshperspect.a023234 [DOI] [PMC free article] [PubMed] [Google Scholar]
- 61.Rodrigues-Pinto R, Berry A, Piper-Hanley K, et al. (2016). Spatiotemporal analysis of putative notochordal cell markers reveals CD24 and keratins 8, 18, and 19 as notochord-specific markers during early human intervertebral disc development. J Orthop Res 34, 1327–1340. doi: 10.1002/jor.23205 [DOI] [PMC free article] [PubMed] [Google Scholar]
- 62.Poillot P, O’Donnell J, O’Connor DT, et al. (2020). Piezoelectricity in the Intervertebral disc. J Biomech 102, 109622. doi: 10.1016/j.jbiomech.2020.109622 [DOI] [PubMed] [Google Scholar]
- 63.Ohba S, He X, Hojo H, McMahon AP (2015). Distinct transcriptional programs underlie sox9 regulation of the mammalian chondrocyte. Cell Rep 12, 229–243. doi: 10.1016/j.celrep.2015.06.013 [DOI] [PMC free article] [PubMed] [Google Scholar]
- 64.Martinac B (2004). Mechanosensitive ion channels: molecules of mechanotransduction. J Cell Sci 117, 2449–2460. doi: 10.1242/jcs.01232 [DOI] [PubMed] [Google Scholar]
- 65.Zhang Y, Xiong C, Kudelko M, et al. (2018). Early onset of disc degeneration in SM/J mice is associated with changes in ion transport systems and fibrotic events. Matrix Biol 70, 123–139. doi: 10.1016/j.matbio.2018.03.024 [DOI] [PubMed] [Google Scholar]
- 66.Liu Z, Easson GWD, Zhao J, et al. (2019). Dysregulation of STAT3 signaling is associated with endplate-oriented herniations of the intervertebral disc in Adgrg6 mutant mice. PLoS Genet 15, e1008096. doi: 10.1371/journal.pgen.1008096 [DOI] [PMC free article] [PubMed] [Google Scholar]
- 67.Fernández-Torres J, Zamudio-Cuevas Y, López-Reyes A, et al. (2018). Gene-gene interactions of the Wnt/β-catenin signaling pathway in knee osteoarthritis. Mol Biol Rep 45, 1089–1098. doi: 10.1007/s11033-018-4260-2 [DOI] [PubMed] [Google Scholar]
- 68.Liu C-F, Lefebvre V (2015). The transcription factors SOX9 and SOX5/SOX6 cooperate genome-wide through super-enhancers to drive chondrogenesis. Nucleic Acids Res 43, 8183–8203. doi: 10.1093/nar/gkv688 [DOI] [PMC free article] [PubMed] [Google Scholar]
- 69.Sive JI, Baird P, Jeziorsk M, et al. (2002). Expression of chondrocyte markers by cells of normal and degenerate intervertebral discs. Mol Pathol 55, 91–97. doi: 10.1136/mp.55.2.91 [DOI] [PMC free article] [PubMed] [Google Scholar]
- 70.Sun W, Zhang K, Liu G, et al. (2014). Sox9 gene transfer enhanced regenerative effect of bone marrow mesenchymal stem cells on the degenerated intervertebral disc in a rabbit model. PLoS One 9, e93570. doi: 10.1371/journal.pone.0093570 [DOI] [PMC free article] [PubMed] [Google Scholar]
- 71.Khoshhal K, Letts RM (2002). Orthopaedic Manifestations of Campomelic Dysplasia. Clin Orthop Relat Res 401, 65–74. doi: 10.1097/00003086-200208000-00010 [DOI] [PubMed] [Google Scholar]
- 72.Madisen L, Zwingman TA, Sunkin SM, et al. (2010). A robust and high-throughput Cre reporting and characterization system for the whole mouse brain. Nat Neurosci 13, 133–140. doi: 10.1038/nn.2467 [DOI] [PMC free article] [PubMed] [Google Scholar]
- 73.Mead TJ, Lefebvre V (2014). Proliferation assays (BrdU and EdU) on skeletal tissue sections. Methods Mol Biol 1130, 233–243. doi: 10.1007/978-1-62703-989-5_17 [DOI] [PMC free article] [PubMed] [Google Scholar]
- 74.Schindelin J, Arganda-Carreras I, Frise E, et al. (2012). Fiji: an open-source platform for biological-image analysis. Nat Methods 9, 676–682. doi: 10.1038/nmeth.2019 [DOI] [PMC free article] [PubMed] [Google Scholar]
Associated Data
This section collects any data citations, data availability statements, or supplementary materials included in this article.