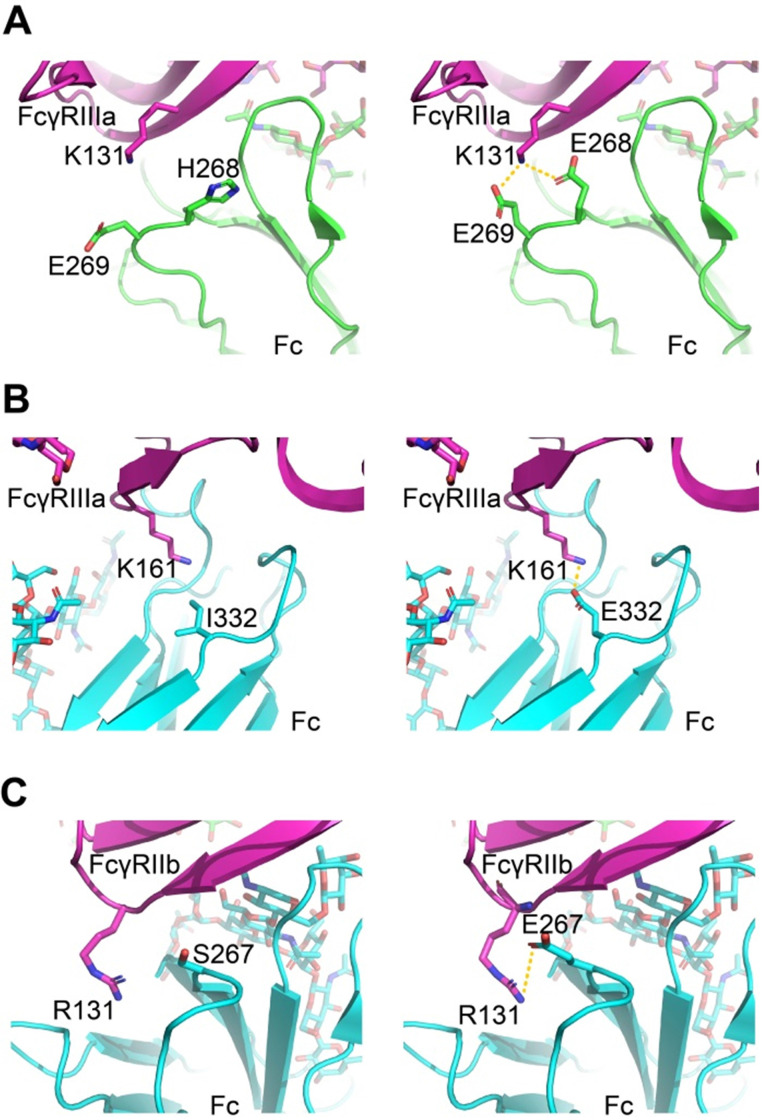
Figure 7.
Molecular models of Fc variant-FcγRs interactions. (A, B) Modeling of FcγRIIIa interacting with Fc variants H268E (A) and I332E (B). (C) Modeling of FcγRIIb interacting with Fc variant S267E. The virtual mutation calculations were performed with Schrödinger software. Salt bridges are indicated by yellow dashed lines.

