Abstract
SoyBase, a USDA genetic and genomics database, holds professionally curated soybean genetic and genomic data, which is integrated and made accessible to researchers and breeders. The site holds several reference genome assemblies, as well as genetic maps, thousands of mapped traits, expression and epigenetic data, pedigree information, and extensive variant and genotyping data sets. SoyBase displays include genetic, genomic, and epigenetic maps of the soybean genome. Gene expression data is presented in the genome viewer as heat maps and pictorial and tabular displays in gene report pages. Millions of sequence variants have been added, representing variations across various collections of cultivars. This variant data is explorable using new interactive tools to visualize the distribution of those variants across the genome, between selected accessions. SoyBase holds several reference-quality soybean genome assemblies, accessible via various query tools and browsers, including a new visualization system for exploring the soybean pan-genome. SoyBase also serves as a nexus of announcements pertinent to the greater soybean research community. The database also includes a soybean-specific anatomic and biochemical trait ontology. The database can be accessed at https://soybase.org.
INTRODUCTION
Soybase was developed in the early 1990s as the USDA-ARS soybean genetics database, using the AceDB database management system. It was redesigned in the early 2000’s as a MySQL database, using PHP for page display. In 2010, the first genome assembly for soybean was published (1) and incorporated into SoyBase. In the decade since publication of that first genome assembly, SoyBase has expanded to incorporate not only the sequence data associated with the original soybean genome sequencing project, but also (as of 2020) the sequence data associated with five other soybean cultivars/species, as well as resequencing and chip-based variant information for thousands of accessions. These sequences also provide the basis for a soybean pan-genome, made accessible through a new gene-based pan-genome visualization tool. As high-throughput genotyping and resequencing technology and capacity have greatly expanded in the last decade, SoyBase has been expanded to include variant data from a number of sources. This variant data can be explored at SoyBase using new query and visualization software. SoyBase also maintains a composite genetic map of soybean that contains quantitative trait locus (QTL) information for over 4800 biparental QTLs, curated from the scientific literature over more than three decades. These genetically identified QTL are related to over 2800 genome wide association study (GWAS) loci, through shared, sequence-based, genetically-mapped markers. This correspondence between genetic map-based QTL and sequence-based GWAS features allows inferences to be drawn regarding candidate gene identification for GWAS and biparental QTLs. In addition to genetic and genomic data, SoyBase is also a center for distribution of announcements of meetings, soybean genetics committee reports and job openings for the whole soybean breeding and research community.
DATABASE UPDATES
New genomic data
The reference genome of the cultivar Williams 82 (Wm82) has undergone three major assembly versions (Wm82.a1, Wm82.a2 and Wm82.a4). These are each viewable in the SoyBase Genome Browser, GBrowse (2) from the Generic Model Organism Database project (GMOD, http://gmod.org) (3). In addition, four additional high-quality assemblies have been incorporated: G. max cultivar Lee (4) and Zhonghuang 13 (5), and two G. soja cultivars PI483463 (4) and W05 (6). Each of these assemblies can be viewed independently, under the ‘Data Source’ pull down menu, with various annotation tracks, including gene predictions on the respective genome assembly and from the other four genomes; and each is also related to the other assemblies via reciprocally mapped genes from each of the assemblies.
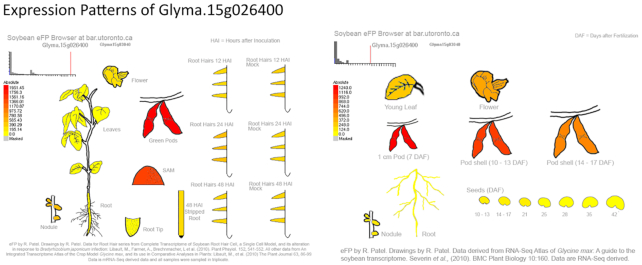
Tracks available for the Williams 82 reference genome include gene expression displays of 49 Affymetrix SoyChip1 and 17 RNAseq GEO accessions, expression displays of the SoyNAM lines (7), soybean nested association mapping (SoyNAM) parents, and selected soybean milestone cultivars (Supplementary Figures S1 and S2). Expression patterns of three soybean tissue expression atlas experiments (8,9) can be visualized as heat maps of read alignments, which highlights expression levels from various tissues, as well as phenomena such as splice-variant differences between the surveyed tissues. These data can also be visualized graphically utilizing the eFP and ePlant visualization software from the University of Toronto (10).
Epigenetic views of the genome are available for the reference Williams 82 genome, based on bisulfite sequencing data. Over 30 samples, representing various soybean tissues at different developmental time points are available for display and comparison with expression tracks (11). Soybean Accessible Chromatin Regions (ACRs) identified by ATAC-seq (12,13) and micro RNAs contained in miRBase v21 are also available (14).
Re-sequencing and single nucleotide polymorphism (SNP) array data from multiple studies (15–18) are viewable under the naturally occurring sequence variants tab (Supplementary Figure S3). Since resequencing studies can produce millions of SNPs, users will need to zoom in to 2 Mb or below to be able to click on an individual SNP glyph. Appropriate zoom level to get reactive objects is indicated in the track name and description. Insertion data for Tgm9 and Ac/Ds mutagenized lines along with deletion data from fast neutron deletion mutants (19) are also available in the genome browser and specialized sections of the database.
SoyBase also houses project pages for important soybean projects including Soybean Nested Association Mapping (SoyNam) (20), large scale resequencing of germplasm (21), Soybean Haplotype Map (16) and Development of an EMS mutagenized population (22).
Metabolic pathway and omic data
Visualization of biochemical and metabolic pathway data is achieved using the Pathway Tools software package (23). Enzymatic annotation of the Wm82 gene models was produced by the Plant Metabolic Network (PMN, https://plantcyc.org) project (24). These annotations were used to populate the SoyCyc pathway database. Pathway Tools allows users to visualize differential expression lists of genes in the context of the metabolic pathways to facilitate hypothesis generation and candidate gene identification. The instance hosted at SoyBase (https://soycyc.soybase.org) includes links to SoyBase gene pages.
Soybean pedigree data
Soybean pedigree data for testing strains and releases were collected from the Soybean Uniform Tests from the Southern and Northern Regions from 1940 to the present. Pedigree data was also collected for all soybean strains in the Plant Variety Protection (PVP) database. The database contains parent information for over 15,000 soybean lines and commercial cultivars.
SoyBase video tutorials
SoyBase offers a number of YouTube video tutorials (https://soybase.org/tutorials) on how to use SoyBase tools and how to search for various types of information. These include how to search and use the genetic and genomic maps, how to use the BLAST sequence search tool, how to use the Gene Expression Explorer to identify candidate genes, and how to use the SoyCyc metabolic pathway explorer to superimpose expression data on the soybean metabolic map.
NEW TOOLS AND FEATURES
Gene expression explorer
A Gene Expression Explorer tool was created in order to help users access the extensive expression data available in the Genome Browser, (Supplementary Figure S4). This tool allows users to choose treatments and tissues for comparing gene expression. The tool presents the GEO experiments by experiment (Supplementary Figure S4A), or by tissue or treatment (Supplementary Figure S4B). The chosen experiments are then presented to the user and each experiment's treatments are presented to the user (Supplementary Figure S5). At this point, the user has the option to select/deselect the individual treatments/tissues in each experiment. Once the treatments/tissues are selected the user is then taken to the Genome Browser with the relevant tracks and subtracts selected.
In addition, tissue level gene expression can be observed graphically utilizing eFP/ePlant displays of individual gene models (Figure 1). This graphical display has been integrated into each gene model report page. Links from this section allows the user access to tabular displays of gene expression values from individual GEO experiments (Supplementary Figure S6). Utilizing the graphical as well as the tabular displays of gene expression allows users to develop functional hypotheses regarding soybean gene function or facilitate candidate gene identification for GWAS and biparental QTLs.
Figure 1.
eFP Graphic of Gene Expression. Gene expression of soybean gene models is graphically depicted using the eFP software at the University of Toronto. Currently, two Gene Atlas experiments are used to allow the user to visualize the general expression level of the selected gene across the sampled tissues. This is particularly useful in candidate gene identification surveys. This example displays the expression of Glyma.15G026400.
Ortholog identification in other legume species
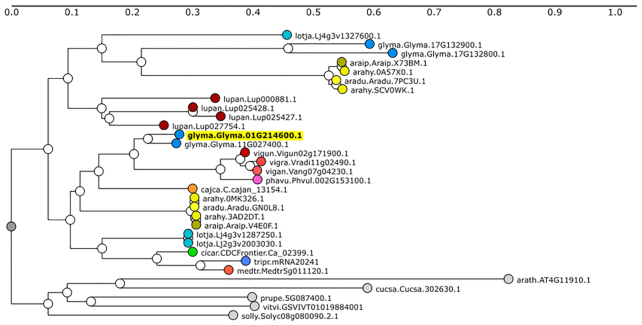
The Legume Information Service (LIS, legumeinfo.org) collects genetic and genomic data from diverse legume species (currently 17 model and crop species). Each soybean gene report page has links to the Legume Information System (LIS) gene family predictions and phylogenies (https://legumeinfo.org/search/phylotree; Figure 2). The SoyBase gene model report page links to the phylogeny viewer at LIS, enabling users to discover orthologous genes in other legume species.
Figure 2.
Ortholog Identification. Ortholog information is available through a collaboration with the Legume Information System and the PhyloTree Tool. This display is useful to allow users to leverage information for orthologs to other legume species. Nodes on the tree indicate the species and gene name within that species (species.gene). Outgroup species are represented as gray circles. In this example Glyma.01G214600 was the starting gene. aradu = Arachis duranensis; arahy = Arachis hypogaea; araip = Arachis ipaensis; cajca = Cajanus cajan; cicar = Cicer arietinum; glyma = Glycine max; lotja = Lotus japonicus; lupan = Lupinus angustifolius; medtr = Medicago truncatula; phavu = Phaseolus vulgaris; tripr = Trifolium praetense; vigan = Vigna angularis; vigra = Vigna radiata; vigun = Vigna unguiculata. Outgroups (one arbitrary sequence selected per species): arath = Arabidopsis thaliana; cucsa = Cucumis sativus; prupe = Prunus persica; solly = Solanum lycopersicum; vitvi = Vitis vinifera.
GCViT diversity browser
The Genotype Comparison Visualization Tool (GCViT Version 1.0) was created to display and explore natural variation between soybean accessions. GCViT allows the user to choose accessions from a list of projects for display. At the writing of this manuscript, there are seven datasets available to view at https://soybase.org/gcvit. GCViT presents the variant data across all chromosomes, based on a user-designated reference accession. The SNP data is binned and can be presented in several ways: as a heatmap, haplotype block, or histogram. Differences or similarities between the reference and each comparison accession can then be displayed.
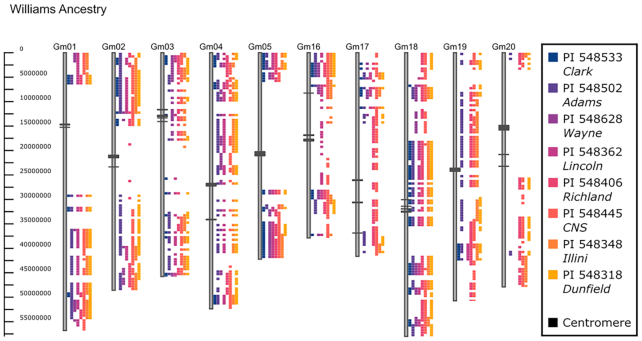
This tool can be used for pedigree analysis, for data assessment and validation, or to identify introgressions or conserved genomic regions between lines (Figure 3). The tool is interactive, allowing users to toggle chromosomes and features off and on, pan and drag the view, and draw boxes around interesting genomic regions.
Figure 3.
Williams ancestry using GCViT. Soybean accession Williams is used as a reference and compared to lines in its direct pedigree. Differences between WIlliams and its ancestors are displayed using the Haplotype view with a threshold of 5. A subset of the chromosomes are shown (Gm01-05, Gm16-20). From left to right Williams ancestors, indicated as PI name/Common name, are PI 548533/Clark, PI 548502/Adams, PI 548628/Wayne, PI 548362/Lincoln, PI 548406/Richland, PI 548445/CNS, PI 548348/Illini and PI 548318/Dunfield. Centromeric regions are indicated as black boxes on the chromosomes.
Pan-genome viewer
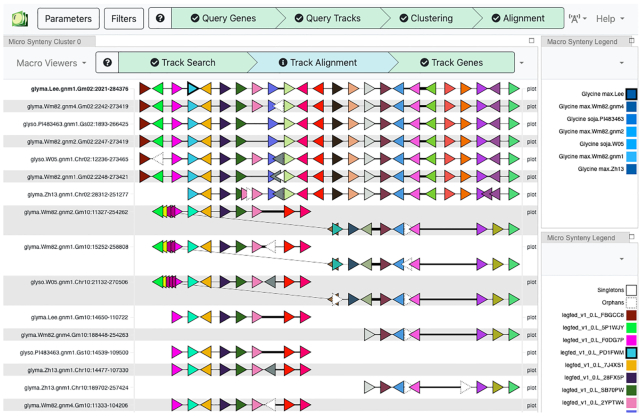
A pan-genome viewer, the Genome Context Viewer (GCV), is available at https://soybase.org/gcv (Figure 4). GCV currently displays seven assemblies and annotations held within SoyBase. The GCV is a generic tool for displaying sets of orthologous genes from syntenic regions from selected taxa (25). GCV currently holds two pan-genome sets: one representing the seven assemblies and annotations held within SoyBase, and the second representing the 26 Glycine assemblies described in Liu et al. (26). It can be configured for sets of species (for example, legumes or grasses), or for accessions within a genus (Glycine, in the case of SoyBase). In typical usage, a gene name is entered as a query; searching by chromosome region is also supported. This is used to retrieve a genomic region from the accession from which that gene comes; and then that region is used to identify corresponding regions from other accessions. These regions are then aligned and displayed, focusing on gene content from the regions. Inversions, insertions, and deletions are all handled and displayed.
Figure 4.
Genome Context Viewer (GCV). View of gene-based synteny for seven soybean assemblies: Lee, Wm82 (v1, v2 & v4), Zhonghuang 13 and G. soja W05 and PI 483463. Each horizontal line is a region from one assembly. Colored triangles represent genes (with orientation), with colors determined by distinct gene families; thus, adjacent red triangles represent tandemly duplicated genes. Thicker line segments indicate greater genomic distance. The top seven rows are from chromosome 2, and the bottom seven rows are from the homoeologous region on chromosome 10. Inversions (diagonal lines) are evident in three assemblies on chromosome 10. Macro-synteny (chromosome-scale) views are also available.
DATA AVAILABILITY
GCViT is open-source software, available at https://github.com/LegumeFederation/gcvit.
GCV is open-source software, available at https://github.com/legumeinfo/gcv/.
Supplementary Material
Contributor Information
Anne V Brown, USDA-ARS Corn Insects and Crop Genetics Research Unit, Ames, IA, USA.
Shawn I Conners, USDA-ARS Corn Insects and Crop Genetics Research Unit, Ames, IA, USA.
Wei Huang, USDA-ARS Corn Insects and Crop Genetics Research Unit, Ames, IA, USA.
Andrew P Wilkey, ORISE Fellow USDA-ARS Corn Insects and Crop Genetics Research Unit, Ames, IA, USA.
David Grant, USDA-ARS Corn Insects and Crop Genetics Research Unit, Ames, IA, USA; Department of Agronomy, Iowa State University, Ames, IA, USA.
Nathan T Weeks, USDA-ARS Corn Insects and Crop Genetics Research Unit, Ames, IA, USA.
Steven B Cannon, USDA-ARS Corn Insects and Crop Genetics Research Unit, Ames, IA, USA.
Michelle A Graham, USDA-ARS Corn Insects and Crop Genetics Research Unit, Ames, IA, USA.
Rex T Nelson, USDA-ARS Corn Insects and Crop Genetics Research Unit, Ames, IA, USA.
SUPPLEMENTARY DATA
Supplementary Data are available at NAR Online.
FUNDING
U.S. Department of Agriculture, Agricultural Research Service [5030-21000-069-00D, in part]; mention of trade names or commercial products in this publication is solely for the purpose of providing specific information and does not imply recommendation or endorsement by the U.S. Department of Agriculture; USDA is an equal opportunity provider and Employer. Funding for open access charge: U.S. Department of Agriculture - Agricultural Research Service Project [5030-21000-069-00D].
Conflict of interest statement. None declared.
REFERENCES
- 1. Schmutz J., Cannon S.B., Schlueter J., Ma J., Mitros T., Nelson W., Hyten D.L., Song Q., Thelen J.J., Cheng J. et al.. Genome sequence of the palaeopolyploid soybean. Nature. 2010; 463:178–183. [DOI] [PubMed] [Google Scholar]
- 2. Donlin M.J. Using the Generic Genome Browser (GBrowse). Curr. Protocols in Bioinformatics. 2009; 28:9.9.1–9.9.25. [DOI] [PubMed] [Google Scholar]
- 3. Generic Model Organism Database (GMOD.org) 2020; http://gmod.org.
- 4. Valliyodan B., Cannon S.B., Bayer P.E., Shu S., Brown A.V., Ren L., Jenkins J., Chung C.Y.L., Chan T.F., Daum C.G. et al.. Construction and comparison of three reference-quality genome assemblies for soybean. Plant J. 2019; 100:1066–1082. [DOI] [PubMed] [Google Scholar]
- 5. Shen Y., Liu J., Geng H., Zhang J., Liu Y., Zhang H., Xing S., Du J., Ma S., Tian Z.. De novo assembly of a Chinese soybean genome. Sci. China Life Sci. 2018; 61:871–884. [DOI] [PubMed] [Google Scholar]
- 6. Xie M., Chung C.Y.L., Li M.W., Wong F.L., Wang X., Liu A., Wang Z., Leung A.K.Y., Wong T.H., Tong S.W. et al.. A reference-grade wild soybean genome. Nat. Commun. 2019; 10:1–12. [DOI] [PMC free article] [PubMed] [Google Scholar]
- 7. Song Q., Yan L., Quigley C., Jordan B.D., Fickus E., Schroeder S., Song B.H., Charles An Y.Q., Hyten D., Nelson R. et al.. Genetic characterization of the soybean nested association mapping population. Plant Genome. 2017; 10:1–14. [DOI] [PubMed] [Google Scholar]
- 8. Libault M., Farmer A., Brechenmacher L., Drnevich J., Langley R.J., Bilgin D.D., Radwan O., Neece D.J., Clough S.J., May G.D. et al.. Complete transcriptome of the soybean root hair cell, a single-cell model, and its alteration in response to Bradyrhizobium japonicum infection. Plant Physiol. 2010; 152:541–552. [DOI] [PMC free article] [PubMed] [Google Scholar]
- 9. Severin A.J., Woody J.L., Bolon Y.T., Joseph B., Diers B.W., Farmer A.D., Muehlbauer G.J., Nelson R.T., Grant D., Specht J.E. et al.. RNA-Seq Atlas of Glycine max: a guide to the soybean transcriptome. BMC Plant Biol. 2010; 10:160. [DOI] [PMC free article] [PubMed] [Google Scholar]
- 10. Waese J., Fan J., Pasha A., Yu H., Fucile G., Shi R., Cumming M., Kelley L.A., Sternberg M.J., Krishnakumar V. et al.. ePlant: visualizing and exploring multiple levels of data for hypothesis generation in plant biology. Plant Cell. 2017; 29:1806–1821. [DOI] [PMC free article] [PubMed] [Google Scholar]
- 11. Kim K.D., El Baidouri M., Abernathy B., Iwata-Otsubo A., Chavarro C., Gonzales M., Libault M., Grimwood J., Jackson S.A.. A comparative epigenomic analysis of Polyploidy-Derived genes in soybean and common bean. Plant Physiol. Plant Physiol. 2015; 168:1433–1447. [DOI] [PMC free article] [PubMed] [Google Scholar]
- 12. Lu Z., Marand A.P., Ricci W.A., Ethridge C.L., Zhang X., Schmitz R.J.. The prevalence, evolution and chromatin signatures of plant regulatory elements. Nat.Plants. 2019; 5:1250–1259. [DOI] [PubMed] [Google Scholar]
- 13. Lu Z., Hofmeister B.T., Vollmers C., DuBois R.M., Schmitz R.J.. Combining ATAC-seq with nuclei sorting for discovery of cis-regulatory regions in plant genomes. Nucleic Acids Res. 2017; 45:e41. [DOI] [PMC free article] [PubMed] [Google Scholar]
- 14. Kozomara A., Birgaoanu M., Griffiths-Jones S.. miRNABase: from microRNA sequences to function. Nucleic Acids Res. 2019; 47:D155–D162. [DOI] [PMC free article] [PubMed] [Google Scholar]
- 15. Song Q., Hyten D.L., Jia G., Quigley C.V., Fickus E.W., Nelson R.L., Cregan P.B.. Development and evaluation of SoySNP50K, a high-density genotyping array for soybean. PLoS One. 2013; 8:e54985. [DOI] [PMC free article] [PubMed] [Google Scholar]
- 16. Torkamaneh D., Laroche J., Valliyodan B., O’Donoughue L., Cober E., Rajcan I., Abdelnoor R.V., Sreedasyam A., Schmutz J., Nguyen H.T. et al.. Soybean (Glycine max) Haplotype Map (GmHapMap): a universal resource for soybean translational and functional genomics. Plant Biotechnol. J. 2020; doi:10.1111/pbi.13466. [DOI] [PMC free article] [PubMed] [Google Scholar]
- 17. Valliyodan B., Brown A.V., Cannon S.B., Nguyen H.. Data from: genetic variation among 481 diverse soybean accessions. Ag Data Commons. 2020; doi:10.15482/USDA.ADC/1518301. [DOI] [PMC free article] [PubMed] [Google Scholar]
- 18. Lee Y.G., Jeong N., Kim J.H., Lee K., Kim H.K., Pirani A., Ha B.K., Kang S.T., Park B.S., Moon J.K. et al.. Development, validation and genetic analysis of a large soybean SNP genotyping array. Plant J. 2015; 81:625–636. [DOI] [PubMed] [Google Scholar]
- 19. Bolon Y.T., Haun W.J., Xu W.W., Grant D., Stacey M.G., Nelson R.T., Gerhardt D.J., Jeddeloh J.A., Stacey G., Muehlbauer G.J. et al.. Phenotypic and genomic analyses of a fast neutron mutant population resource in soybean. Plant Physiol. 2011; 156:240–253. [DOI] [PMC free article] [PubMed] [Google Scholar]
- 20. Song Q., Yan L., Quigley C., Jordan B.D., Ficus E., Schroeder S., Song B., An Y., Hyten D., Nelson R. et al.. Genetic characterization of the soybean nested association mapping population. Plant Genome. 2017; 10:1–14. [DOI] [PubMed] [Google Scholar]
- 21. Valliyodan B., Qiu D., Patil G., Zeng P., Huang J., Dai L., Chen C., Li Y., Joshi T., Song L. et al.. Landscape of genomic diversity and trait discovery in soybean. Sci. Reports. 2016; 6:23598. [DOI] [PMC free article] [PubMed] [Google Scholar]
- 22. Espina M.J., Ahmed C.M., Bernardini A., Adeleke E., Yadegari Z., Arelli P., Pantalone V., Taheri A.. Development and phenotypic screening of an ethyl methane sulfonate mutant population in soybean. Front. Plant Sci. 2018; 9:394. [DOI] [PMC free article] [PubMed] [Google Scholar]
- 23. Karp P.D., Midford P.E., Billington R., Kothari A., Krummenaker M., Latendresse M., Ong W., Subhraveti P., Caspi R., Fulcher C. et al.. Pathway Tools version 23.0 update: software for pathway/genome informatics and systems biology. Brief. Bioinform. 2019; 00:1–18. [DOI] [PMC free article] [PubMed] [Google Scholar]
- 24. Schlapfer P., Zhang P., Wang C., Kim T., Banf M., Chae L., Dreher K., Chavali A.K., Nilo-Poyanco R., Bernard T. et al.. Genome-wide prediction of metabolic enzymes, pathways, and gene clusters in plants. Plant Physiol. 2017; 173:2041–2059. [DOI] [PMC free article] [PubMed] [Google Scholar]
- 25. Cleary A., Farmer A.. Genome Context Viewer: visual exploration of multiple annotated genomes using microsynteny. Bioinformatics. 2018; 34:1562–4. [DOI] [PMC free article] [PubMed] [Google Scholar]
- 26. Liu Y., Du H., Li P., Shen Y., Peng H., Liu S., Zhou G.A., Zhang H., Liu Z., Shi M. et al.. Pan-genome of wild and cultivated soybeans. Cell. 2020; 182:162–176. [DOI] [PubMed] [Google Scholar]
Associated Data
This section collects any data citations, data availability statements, or supplementary materials included in this article.
Supplementary Materials
Data Availability Statement
GCViT is open-source software, available at https://github.com/LegumeFederation/gcvit.
GCV is open-source software, available at https://github.com/legumeinfo/gcv/.


