

Abstract
Protein–protein interactions (PPIs) are crucial to mediate biological functions, and understanding PPIs in cancer type-specific context could help decipher the underlying molecular mechanisms of tumorigenesis and identify potential therapeutic options. Therefore, we update the Protein Interaction Network Analysis (PINA) platform to version 3.0, to integrate the unified human interactome with RNA-seq transcriptomes and mass spectrometry-based proteomes across tens of cancer types. A number of new analytical utilities were developed to help characterize the cancer context for a PPI network, which includes inferring proteins with expression specificity and identifying candidate prognosis biomarkers, putative cancer drivers, and therapeutic targets for a specific cancer type; as well as identifying pairs of co-expressing interacting proteins across cancer types. Furthermore, a brand-new web interface has been designed to integrate these new utilities within an interactive network visualization environment, which allows users to quickly and comprehensively investigate the roles of human interacting proteins in a cancer type-specific context. PINA is freely available at https://omics.bjcancer.org/pina/.
Graphical Abstract
Graphical Abstract.
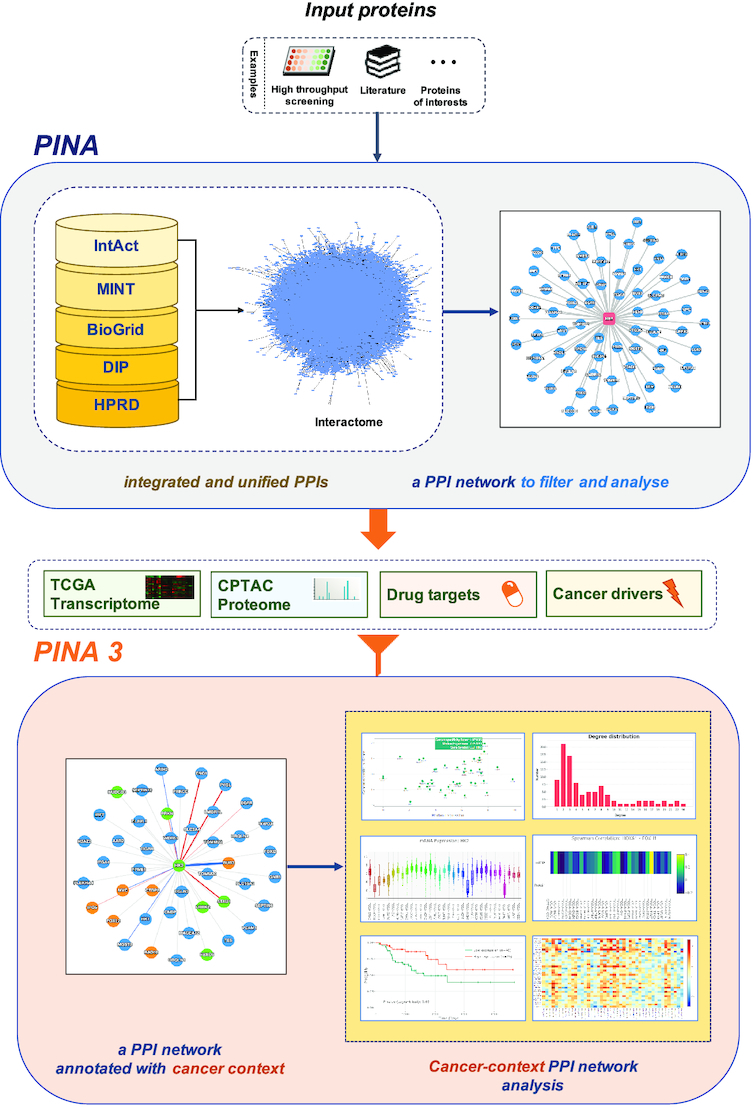
A schematic overview of PINA 3.0.
INTRODUCTION
Protein–protein interactions (PPIs) are crucial for exerting biological functions in most cellular processes. With the quick accumulation of experimental PPI data, human protein interactome has been utilized in a variety of disease research (1–3). However, human proteins could have different interacting partners in different contexts (tissues, cell types, disease conditions) (4,5), which is important for understanding their functions within a specific context and identifying associations with the context-related phenotypes (6). Although this information is extremely valuable, a context-specific view of PPI networks has been rarely available.
Building a context-specific PPI network by experimental approaches is certainly precious. For example, Li et al. (7) detected a set of 397 high-confidence lung cancer-associated PPIs between 83 genes with a high frequency of genomic alterations in lung cancer, and discovered PPI network-implicated tumor vulnerabilities for therapeutic interrogation in lung cancer. However, it remains infeasible to systematically identify endogenous PPIs at protein interactome level for hundreds of pathological and molecular tumor types/subtypes. Thus, it is more common to predict context-specific PPIs based on expression profiles. Efforts have been made to generate context-based PPI networks including HIPPIE (8), IID (9), TissueNet (10), MyProteinNet (11) and HURI (12). However, context-specific PPIs in these databases were mostly inferred based on gene expression profiles of normal human tissues from the GTEx program (13) or the HPA project (14), comprehensive resources to investigate cancer contexts for human PPIs remain limited (15).
Recently, a massive amount of cancer sequencing and molecular profiling datasets have been publicly available from several international consortiums (16–18), which enables inferring tumor type-specific contexts for human reference interactomes, and offers unparalleled opportunities to reveal PPIs with functional significance and therapeutic implications, e.g. targeting interacting partners of hard-to-drug tumor suppressors. The Cancer Genome Atlas (TCGA) released RNA-seq data for ∼10 000 tumor samples across 33 cancer types, and the Clinical Proteomic Tumor Analysis Consortium (CPTAC) is rapidly accumulating proteome and phosphoproteome data for TCGA sequenced tumor samples as well as new samples, across tens of cancer types. Moreover, associating expression profiles with the accompanied patient outcome from these large cohort studies will help to indicate the functions of PPIs in tumorigenesis and progression. Taken together, characterizing tumor type-specific context for a given PPI network could be with great functional and therapeutic implications.
Thus, we release PINA version 3.0 to facilitate PPI network analysis within the cancer context. Using the integrated TCGA and CPTAC datasets, we developed several new utilities to infer proteins with tumor type-specific expression, to investigate expression correlations of interacting proteins across tumor types, to indicate interacting proteins associated with patient survival, to highlight mutational cancer drivers and therapeutic targets in a given PPI network. Furthermore, a brand-new web interface has been provided to integrate these new functions within an interactive network visualization environment, which allows users to quickly and comprehensively investigate the roles of human interacting proteins across tumor types in PINA version 3.0.
MATERIALS AND METHODS
PPI data update
PPI datasets were downloaded from five manually curated databases including IntAct (version 4.2.15) (19), MINT (download on 21 May 2020) (20), BioGRID (version 3.5.185) (21), DIP (version 20170205) (22) and HPRD (release 9) (23), and unified as described in the previous versions (24,25) to build a non-redundant PPI database for seven model organisms: Homo sapiens, Mus musculus, Rattus norvegicus, Drosophila melanogaster, Caenorhabditis elegans, Saccharomyces cerevisiae and Arabidopsis thaliana. All PPI data were stored in a MySQL relational database, and statistics of the current PINA release is available at https://omics.bjcancer.org/pina/stats.action.
Integrated cancer datasets
Cancer transcriptomic profiles (26) were downloaded from the Genomic Data Commons (GDC) portal of TCGA (version 20190101). The batch-corrected and upper quartile normalized RSEM measurements were log2 transformed for further processing. Cancer proteomic profiles were downloaded from CPTAC data portal (version 20200511). The relative abundance of proteins generated by the Common Data Analysis Pipeline (CDAP) (27) was subjected to quantile normalization using normalizeQuantiles function implemented in R package limma (28) v3.36.1. Both mRNA and protein expression profiles were filtered by removing genes with zero or NA values in >80% samples in a dataset. Clinical information (survival time, tumor site, age, ethnicity and grade) were downloaded from both GDC and CPTAC for corresponding samples with molecular data. Only primary tumors were included in the PINA database.
Tumor type-specific prognosis biomarkers
We used R package ‘survival’ (version 2.43.3) for Kaplan–Meier survival analysis. Samples were stratified into two groups: high expression versus low expression using six pairs of cutoffs for users’ choice (90% quantile versus 10% quantile, 80% quantile versus 20% quantile, 70% quantile versus 30% quantile, 75% quantile versus 25% quantile, 60% quantile versus 40% quantile and 50% quantile versus 50% quantile). Overall survival (OS) was used as the clinical endpoint. P-value was calculated by log-rank test for Kaplan–Meier analysis, and a gene with P-value less than 0.05 was considered as a candidate prognosis marker in a given tumor type.
Identification of genes with tumor type-specific expression specificity
Tumor type specificity score was calculated using the method reported by Sonawane et al. (29), which compared the median expression level of a gene in a given tumor type to the median and interquartile range (IQR) of its expression across all tumor types. Specificity scores of each gene were calculated for mRNA and protein expression datasets respectively.
Annotations of cancer driver genes and therapeutic targets
Cancer driver genes were obtained from a recent TCGA pan-cancer analysis (30), which characterized 9423 tumor exomes (comprising all 33 TCGA projects) and identified 299 mutational driver genes with implications regarding their anatomical sites and cancer types, including 258 genes from a systematic approach and 41 genes recovered after manual curation of previous TCGA marker papers of each individual study. Drugs and their potential targets were downloaded from the Genomics of Drug Sensitivity in Cancer (GDSC) release 8.3, which have been screened in >1000 human cancer cell lines in a previous pharmacogenomics study (31); and 812 cell lines were mapped to 30 cancer types based on TCGA classification. The pan-cancer information and links will be shown for a normal PPI network, while tumor type-specific information will be provided for a cancer-context PPI network.
Website implementation
Since the last update of PINA, significant advances have been achieved in web technologies and network visualization (32). To provide better visualization effects in modern Internet browsers, we implemented a new web interface using HTML5 and open-source templates based on Bootstrap4 (http://getbootstrap.com/). The web application was built using Java Server Pages (JSP) technology hosted by an Apache Tomcat web server. Open-access web frameworks including Spring (https://spring.io/) and MyBatis (https://github.com/mybatis/mybatis-3/) were utilized to improve the sustainability and reliability of the web services.
PPI network visualization was mainly implemented using Cytoscape.js (32) (http://js.cytoscape.org/), and customized network functions were developed using native JavaScript libraries and JQuery (http://jquery.com). We implemented interactive plots using Plotly.js (https://github.com/plotly/plotly.js/), and dynamic tables using DataTables.js (https://www.datatables.net/).
RESULTS
PINA 3.0 integrated non-redundant human PPIs with RNA-seq profiles of 9870 tumors across 33 cancer types from TCGA, and mass spectrometry-based proteomic profiles of 936 tumors across eight cancer types from CPTAC, to enable tumor type context-specific PPI network analysis. The schematic overview of PINA 3.0 is illustrated in Figure 1. The detailed documentation and a step-by-step case study tutorial are provided on the PINA website.
Figure 1.

A schematic overview of PINA 3.0. PPIs were integrated and unified from five public databases to generate protein interactomes, which will be used to construct a user PPI network for input proteins of interests. PINA 3.0 enables cancer context-specific network annotation, visualization and analysis for a user PPI network, based on the integrated cancer datasets.
New web interface with enhanced network visualization and interactive data reporting
We re-designed and implemented a brand new web interface using modern JavaScript libraries in this release, to improve network visualization and data reporting. After querying a network, all related information will be shown within a single web page consisting of two panels: a graphical network-view panel (Figure 2A) and a network-details panel (Figure 2B–D).
Figure 2.

Enhanced network visualization and data reporting. A newly designed web interface consists of two panels: a graphical network-view panel (A) and a network-details panel showing respective details for an analyzed PPI network (B), a selected node (C) and a selected edge (D) correspondingly. Co-expression significance for a selected edge will only be available after cancer context annotated. Contents of ‘Tumor type specify’, ‘Pan-Cancer’ and ‘Cancer Survival’ tabs are shown in Figure 3C, D, F correspondingly.
The network-view panel depicts proteins and their interactions as nodes and edges respectively with a force-direct layout by default. A toolbar menu is provided for changing network layout, highlighting proteins of interests, filtering interactions, building a cancer-context PPI network, presenting links to analysis tools, downloading network in multiple file formats, and saving network in the user space for long-term access. The newly developed highlight function enables users to highlight single protein, common interacting proteins, and cancer-related proteins (cancer drivers and therapeutic targets), which will be useful to efficiently identify proteins of interests in a big PPI network.
The network-details panel presents diverse rich information of interactors and interactions in a network. It consists of four tabs including network details (Figure 2B) using a sortable and searchable table, and a number of newly introduced cancer utilities (described in the next section). This panel is highly interactive with the network-view panel, by dynamic showing corresponding information upon clicking a node (Figure 2C) or an edge (Figure 2D) in the network-view panel.
Novel features to help reveal tumor type-specific insights from PPI networks
We integrated TCGA and CPTAC datasets and developed new utilities to provide a ‘cancer context’ for a PPI network, which can be dynamically inferred through the network menu (‘Cancer Context’ tab, Figure 3A). A cancer-context PPI network provides multiple novel features to help reveal tumor type-specific insights from the original PPI network, as shown in the following sub-sections.
Figure 3.

New features for cancer context annotation and analysis. (A) Query parameters to specify a cancer type context to annotate for a PPI network. (B) An example cancer-context PPI network of LKB1 using LUAD (Lung adenocarcinoma) mRNA profiles with parameters shown in (A). Candidate prognosis biomarkers are indicated as orange (poor prognosis) and green (good prognosis) nodes. Positive correlations with statistical significance between the expression levels of interacting proteins are represented as blue edges, while negative correlations are indicated as red edges. Edge width is proportional to the correlation coefficient. (C) A scatter plot illustrating relationships between the median expression of each gene in this network and their tumor type-specificity scores. (D) Correlation coefficients of mRNA expression levels and relatively protein abundance for the selected edge ‘LKB1-CDC37’ across all integrated tumor types. (E) Correlation coefficients of mRNA expression levels between all interaction pairs in the example network across cancer types. (F) A Kaplan–Meier survival curve showing significant survival differences between patients with high and low expression of H2AX.
Cancer driver genes and therapeutic targets
Associating undruggable tumor suppressors with therapeutic targets in their interacting partners could inform cancer treatment options, thus both pan-cancer and cancer type-specific annotations of cancer driver genes and potential therapeutic targets were integrated into PINA 3.0. By clicking a node in a normal PPI network, pan-cancer information regarding cancer driver genes and available drugs (links to GDSC pan-cancer pharmacogenomic analysis results) will be shown in the network-details panel (‘Details’ tab, Figure 2C). For a cancer-context PPI network, the information and links will be changed according to the specified tumor type. Besides, PINA 3.0 provides the highlight function in the network menu (Figure 2A) to quickly identify all cancer driver genes and candidate therapeutic targets in a given PPI network.
Tumor type-expression specificity
Tissue-specific functions are largely mediated by interactions between tissue-specific proteins and uniformly expressed cellular members (12), and molecular profiles of tumors typically exhibit a cell-of-origin pattern (26), thus novel insights could be obtained from interacting proteins showing tumor type-expression specificity. This analysis also complements recent systematic efforts (33,34) in investigating how tissue-specific genes interact with other genes to mediate cancer-specific functions. Tumor type specificity scores were pre-calculated for each gene to represent the level of deviation of expression in a given tumor type compared to the full spectrum of tumor types. The cutoff of specificity score was set as 2 for mRNA expression levels (Supplementary Figure S1A–C), as suggested in previous studies(12,29). Genes having a specificity score >2 were considered as highly-expressed in the analyzed tumor type, and genes having a score ≤ 2 were considered as lowly-expressed (Figure 3B). As the proteomic datasets that PINA integrated were profiled by iTRAQ or TMT labelling methods, protein abundances were quantified relative to pooled samples or paired normal tissues. This resulted in a distribution different from mRNA levels, thus we set the cutoff as 0.5 by default for protein abundances, to have reasonable numbers of proteins with tumor type-expression specificity in each dataset (Supplementary Figure S1D–F). Users can also modify this cutoff at their will during analysis of a PPI network (Figure 3A). Moreover, a scatter plot will be shown in the network details panel (‘Tumor type Specificity’ tab) to illustrate the relationships between the median expression and the tumor type-specificity scores for a PPI network (Figure 3C).
Expression correlations of interacting proteins across tumor types
Gene co-expression analysis is valuable to identify functionally associated genes, and disease candidate genes. Thus, we pre-calculated the Pearson and Spearman correlation coefficients between all pairs of interacting proteins in PINA, for all integrated tumor types respectively. By clicking an edge in a network, a heatmap will be shown in the network-details panel (‘Pan-cancer’ tab) to present correlation coefficients between expression levels (mRNA and protein abundance) of interacting proteins across all integrated cancer datasets (Figure 3D). Two-tailed t-test will be applied to evaluate the statistical significance of correlation in a specific tumor type, with P-values corrected by the Benjamini-Hochberg method, which takes all PPIs in the analyzed network into account. Positive correlations and negative correlations with statistical significance (FDR < 0.05) between pairs of interacting proteins will be highlighted with different edge colors (blue and red) (Figure 3B), while edge width will be proportional to correlation coefficients. Furthermore, we developed a new analysis tool to show an overview of the expression correlation pattern for all pairs of interacting proteins in a given network (Figure 3E), which could help to identify the potential core module and variable components of a PPI network across tumor types.
Tumor type-specific prognosis biomarkers
Identifying tumor type-specific prognosis biomarkers in a PPI network is valuable to discover translational potentials. By specifying a tumor type and a threshold to dichotomize patients based on expression levels, proteins with their expression associated with significant survival difference will be highlighted in a cancer-context PPI network. Proteins associated with good prognosis (log-rank test P-value < 0.05, hazard ratio < 1) and poor prognosis (log-rank test P-value < 0.05, hazard ratio > 1) will be indicated with different node colors (Figure 3B). By clicking a node in a cancer-context PPI network, a Kaplan–Meier survival curve will be shown in the network-details panel (‘Cancer survival’ tab) to present survival differences between the patients with high-expression and low-expression of the selected protein (Figure 3F).
DISCUSSION
PINA 3.0 is equipped with a revamped web interface, and a number of new functions to characterize the cancer contexts of human protein interactome. We hope to provide a valuable platform, to bridge the gap between cancer genomics research and PPI network analysis, by allowing users to quickly and comprehensively investigate the roles of human interacting proteins across cancer types, which has substantial functional and therapeutic significance. Although genome-wide proteomics data are currently available for a limited number of tumor samples compared to RNA-seq data, it is continuously accumulating from large International studies; thus the cancer datasets integrated in PINA will be updated quarterly to maximize its potentials. In addition, visualization and analysis tools regarding cancer functional screening and pharmacogenomic profiles will be integrated in the future to further extend its utilities in cancer research.
Supplementary Material
ACKNOWLEDGEMENTS
We thank Man Wang, Yanru Hai for comments on the step-by-step tutorial available on the website, and Huan Yu for advice on the schematic figure.
Contributor Information
Yang Du, Center for Cancer Bioinformatics, Key Laboratory of Carcinogenesis and Translational Research (Ministry of Education), Peking University Cancer Hospital & Institute, Beijing 100142, China.
Meng Cai, Institute of Systems Biomedicine, Department of Medical Bioinformatics, School of Basic Medical Sciences, Peking University Health Science Center, Beijing 100191, China.
Xiaofang Xing, Department of Gastrointestinal Translational Research, Key Laboratory of Carcinogenesis and Translational Research (Ministry of Education), Peking University Cancer Hospital & Institute, Beijing 100142, China.
Jiafu Ji, Gastrointestinal Cancer Center, Key Laboratory of Carcinogenesis and Translational Research (Ministry of Education), Peking University Cancer Hospital & Institute, Beijing 100142, China.
Ence Yang, Institute of Systems Biomedicine, Department of Medical Bioinformatics, School of Basic Medical Sciences, Peking University Health Science Center, Beijing 100191, China.
Jianmin Wu, Center for Cancer Bioinformatics, Key Laboratory of Carcinogenesis and Translational Research (Ministry of Education), Peking University Cancer Hospital & Institute, Beijing 100142, China; Peking University International Cancer Institute, Peking University, Beijing 100191, China.
SUPPLEMENTARY DATA
Supplementary Data are available at NAR Online.
FUNDING
PKU-Baidu Fund [2019BD012]; Beijing Municipal Science and Technology Commission [Z201100008320006]; Beijing Municipal Bureau of Health [2019-1]. Funding for open access charge: Beijing Municipal Bureau of Health [2019-1].
Conflict of interest statement. None declared.
REFERENCES
- 1. Magger O., Waldman Y.Y., Ruppin E., Sharan R.. Enhancing the prioritization of disease-causing genes through tissue specific protein interaction networks. PLoS Comput. Biol. 2012; 8:e1002690. [DOI] [PMC free article] [PubMed] [Google Scholar]
- 2. Guan Y., Gorenshteyn D., Burmeister M., Wong A.K., Schimenti J.C., Handel M.A., Bult C.J., Hibbs M.A., Troyanskaya O.G.. Tissue-specific functional networks for prioritizing phenotype and disease genes. PLoS Comput. Biol. 2012; 8:e1002694. [DOI] [PMC free article] [PubMed] [Google Scholar]
- 3. Vidal M., Cusick M.E., Barabasi A.L.. Interactome networks and human disease. Cell. 2011; 144:986–998. [DOI] [PMC free article] [PubMed] [Google Scholar]
- 4. Bossi A., Lehner B.. Tissue specificity and the human protein interaction network. Mol. Syst. Biol. 2009; 5:260. [DOI] [PMC free article] [PubMed] [Google Scholar]
- 5. Emig D., Kacprowski T., Albrecht M.. Measuring and analyzing tissue specificity of human genes and protein complexes. EURASIP J. Bioinform. Syst. Biol. 2011; 2011:5. [DOI] [PMC free article] [PubMed] [Google Scholar]
- 6. Yeger-Lotem E., Sharan R.. Human protein interaction networks across tissues and diseases. Front. Genet. 2015; 6:257. [DOI] [PMC free article] [PubMed] [Google Scholar]
- 7. Li Z., Ivanov A.A., Su R., Gonzalez-Pecchi V., Qi Q., Liu S., Webber P., McMillan E., Rusnak L., Pham C. et al.. The OncoPPi network of cancer-focused protein-protein interactions to inform biological insights and therapeutic strategies. Nat. Commun. 2017; 8:14356. [DOI] [PMC free article] [PubMed] [Google Scholar]
- 8. Alanis-Lobato G., Andrade-Navarro M.A., Schaefer M.H.. HIPPIE v2.0: enhancing meaningfulness and reliability of protein-protein interaction networks. Nucleic Acids Res. 2017; 45:D408–D414. [DOI] [PMC free article] [PubMed] [Google Scholar]
- 9. Kotlyar M., Pastrello C., Malik Z., Jurisica I.. IID 2018 update: context-specific physical protein-protein interactions in human, model organisms and domesticated species. Nucleic Acids Res. 2019; 47:D581–D589. [DOI] [PMC free article] [PubMed] [Google Scholar]
- 10. Basha O., Barshir R., Sharon M., Lerman E., Kirson B.F., Hekselman I., Yeger-Lotem E.. The TissueNet v.2 database: a quantitative view of protein-protein interactions across human tissues. Nucleic Acids Res. 2017; 45:D427–D431. [DOI] [PMC free article] [PubMed] [Google Scholar]
- 11. Basha O., Flom D., Barshir R., Smoly I., Tirman S., Yeger-Lotem E.. MyProteinNet: build up-to-date protein interaction networks for organisms, tissues and user-defined contexts. Nucleic Acids Res. 2015; 43:W258–W263. [DOI] [PMC free article] [PubMed] [Google Scholar]
- 12. Luck K., Kim D.K., Lambourne L., Spirohn K., Begg B.E., Bian W., Brignall R., Cafarelli T., Campos-Laborie F.J., Charloteaux B. et al.. A reference map of the human binary protein interactome. Nature. 2020; 580:402–408. [DOI] [PMC free article] [PubMed] [Google Scholar]
- 13. Mele M., Ferreira P.G., Reverter F., DeLuca D.S., Monlong J., Sammeth M., Young T.R., Goldmann J.M., Pervouchine D.D., Sullivan T.J. et al.. The human transcriptome across tissues and individuals. Science. 2015; 348:660–665. [DOI] [PMC free article] [PubMed] [Google Scholar]
- 14. Uhlén M., Fagerberg L., Hallström B.M., Lindskog C., Oksvold P., Mardinoglu A., Sivertsson Å., Kampf C., Sjöstedt E., Asplund A. et al.. Tissue-based map of the human proteome. Science. 2015; 347:1260419. [DOI] [PubMed] [Google Scholar]
- 15. Meng X., Wang J., Yuan C., Li X., Zhou Y., Hofestadt R., Chen M.. CancerNet: a database for decoding multilevel molecular interactions across diverse cancer types. Oncogenesis. 2015; 4:e177. [DOI] [PMC free article] [PubMed] [Google Scholar]
- 16. Zhang J., Bajari R., Andric D., Gerthoffert F., Lepsa A., Nahal-Bose H., Stein L.D., Ferretti V.. The international cancer genome consortium data portal. Nat. Biotechnol. 2019; 37:367–369. [DOI] [PubMed] [Google Scholar]
- 17. Ellis M.J., Gillette M., Carr S.A., Paulovich A.G., Smith R.D., Rodland K.K., Townsend R.R., Kinsinger C., Mesri M., Rodriguez H. et al.. Connecting genomic alterations to cancer biology with proteomics: the NCI Clinical Proteomic Tumor Analysis Consortium. Cancer Discov. 2013; 3:1108–1112. [DOI] [PMC free article] [PubMed] [Google Scholar]
- 18. Cancer Genome Atlas Research, N. Weinstein J.N., Collisson E.A., Mills G.B., Shaw K.R., Ozenberger B.A., Ellrott K., Shmulevich I., Sander C., Stuart J.M.. The Cancer Genome Atlas Pan-Cancer analysis project. Nat. Genet. 2013; 45:1113–1120. [DOI] [PMC free article] [PubMed] [Google Scholar]
- 19. Orchard S., Ammari M., Aranda B., Breuza L., Briganti L., Broackes-Carter F., Campbell N.H., Chavali G., Chen C., del-Toro N. et al.. The MIntAct project–IntAct as a common curation platform for 11 molecular interaction databases. Nucleic Acids Res. 2014; 42:D358–D363. [DOI] [PMC free article] [PubMed] [Google Scholar]
- 20. Licata L., Briganti L., Peluso D., Perfetto L., Iannuccelli M., Galeota E., Sacco F., Palma A., Nardozza A.P., Santonico E. et al.. MINT, the molecular interaction database: 2012 update. Nucleic Acids Res. 2012; 40:D857–D861. [DOI] [PMC free article] [PubMed] [Google Scholar]
- 21. Oughtred R., Stark C., Breitkreutz B.J., Rust J., Boucher L., Chang C., Kolas N., O’Donnell L., Leung G., McAdam R. et al.. The BioGRID interaction database: 2019 update. Nucleic Acids Res. 2019; 47:D529–D541. [DOI] [PMC free article] [PubMed] [Google Scholar]
- 22. Salwinski L., Miller C.S., Smith A.J., Pettit F.K., Bowie J.U., Eisenberg D.. The Database of Interacting Proteins: 2004 update. Nucleic Acids Res. 2004; 32:D449–D451. [DOI] [PMC free article] [PubMed] [Google Scholar]
- 23. Keshava Prasad T.S., Goel R., Kandasamy K., Keerthikumar S., Kumar S., Mathivanan S., Telikicherla D., Raju R., Shafreen B., Venugopal A. et al.. Human Protein Reference Database–2009 update. Nucleic Acids Res. 2009; 37:D767–D772. [DOI] [PMC free article] [PubMed] [Google Scholar]
- 24. Cowley M.J., Pinese M., Kassahn K.S., Waddell N., Pearson J.V., Grimmond S.M., Biankin A.V., Hautaniemi S., Wu J.. PINA v2.0: mining interactome modules. Nucleic Acids Res. 2012; 40:D862–D865. [DOI] [PMC free article] [PubMed] [Google Scholar]
- 25. Wu J., Vallenius T., Ovaska K., Westermarck J., Makela T.P., Hautaniemi S.. Integrated network analysis platform for protein-protein interactions. Nat. Methods. 2009; 6:75–77. [DOI] [PubMed] [Google Scholar]
- 26. Hoadley K.A., Yau C., Hinoue T., Wolf D.M., Lazar A.J., Drill E., Shen R., Taylor A.M., Cherniack A.D., Thorsson V. et al.. Cell-of-origin patterns dominate the molecular classification of 10,000 tumors from 33 types of cancer. Cell. 2018; 173:291–304. [DOI] [PMC free article] [PubMed] [Google Scholar]
- 27. Rudnick P.A., Markey S.P., Roth J., Mirokhin Y., Yan X., Tchekhovskoi D.V., Edwards N.J., Thangudu R.R., Ketchum K.A., Kinsinger C.R. et al.. A description of the clinical proteomic tumor analysis consortium (CPTAC) common data analysis pipeline. J. Proteome Res. 2016; 15:1023–1032. [DOI] [PMC free article] [PubMed] [Google Scholar]
- 28. Ritchie M.E., Phipson B., Wu D., Hu Y., Law C.W., Shi W., Smyth G.K.. limma powers differential expression analyses for RNA-sequencing and microarray studies. Nucleic Acids Res. 2015; 43:e47. [DOI] [PMC free article] [PubMed] [Google Scholar]
- 29. Sonawane A.R., Platig J., Fagny M., Chen C.Y., Paulson J.N., Lopes-Ramos C.M., DeMeo D.L., Quackenbush J., Glass K., Kuijjer M.L.. Understanding tissue-specific gene regulation. Cell Rep. 2017; 21:1077–1088. [DOI] [PMC free article] [PubMed] [Google Scholar]
- 30. Bailey M.H., Tokheim C., Porta-Pardo E., Sengupta S., Bertrand D., Weerasinghe A., Colaprico A., Wendl M.C., Kim J., Reardon B. et al.. Comprehensive characterization of cancer driver genes and mutations. Cell. 2018; 173:371–385. [DOI] [PMC free article] [PubMed] [Google Scholar]
- 31. Yang W., Soares J., Greninger P., Edelman E.J., Lightfoot H., Forbes S., Bindal N., Beare D., Smith J.A., Thompson I.R. et al.. Genomics of Drug Sensitivity in Cancer (GDSC): a resource for therapeutic biomarker discovery in cancer cells. Nucleic Acids Res. 2013; 41:D955–D961. [DOI] [PMC free article] [PubMed] [Google Scholar]
- 32. Franz M., Lopes C.T., Huck G., Dong Y., Sumer O., Bader G.D.. Cytoscape.js: a graph theory library for visualisation and analysis. Bioinformatics. 2016; 32:309–311. [DOI] [PMC free article] [PubMed] [Google Scholar]
- 33. Kim P., Park A., Han G., Sun H., Jia P., Zhao Z.. TissGDB: tissue-specific gene database in cancer. Nucleic Acids Res. 2018; 46:D1031–D1038. [DOI] [PMC free article] [PubMed] [Google Scholar]
- 34. Tang Q., Zhang Q., Lv Y., Miao Y.R., Guo A.Y.. SEGreg: a database for human specifically expressed genes and their regulations in cancer and normal tissue. Brief. Bioinform. 2019; 20:1322–1328. [DOI] [PubMed] [Google Scholar]
Associated Data
This section collects any data citations, data availability statements, or supplementary materials included in this article.