Abstract
KEGG (https://www.kegg.jp/) is a manually curated resource integrating eighteen databases categorized into systems, genomic, chemical and health information. It also provides KEGG mapping tools, which enable understanding of cellular and organism-level functions from genome sequences and other molecular datasets. KEGG mapping is a predictive method of reconstructing molecular network systems from molecular building blocks based on the concept of functional orthologs. Since the introduction of the KEGG NETWORK database, various diseases have been associated with network variants, which are perturbed molecular networks caused by human gene variants, viruses, other pathogens and environmental factors. The network variation maps are created as aligned sets of related networks showing, for example, how different viruses inhibit or activate specific cellular signaling pathways. The KEGG pathway maps are now integrated with network variation maps in the NETWORK database, as well as with conserved functional units of KEGG modules and reaction modules in the MODULE database. The KO database for functional orthologs continues to be improved and virus KOs are being expanded for better understanding of virus-cell interactions and for enabling prediction of viral perturbations.
INTRODUCTION
Systems and perturbations have been used as a conceptual framework for developing the KEGG (Kyoto Encyclopedia of Genes and Genomes) database resource (1). Since 1995 the primary objective of KEGG has been to enable computational reconstruction of biological systems, including the cell, the organism and the ecosystem, from genome information. Current knowledge of such biological systems is captured from experimental data published in literature, represented in terms of molecular interaction and reaction networks, and accumulated in the KEGG PATHWAY database. The nodes of molecular networks are linked to functional orthologs of the KO (KEGG ORTHOLOGY) database so that experimental evidence observed in specific organisms can be generalized for use in other organisms. This architecture has made KEGG into a generic database with predictive power. The KEGG mapping, a method to reconstruct biological systems and to infer high-level functions, can be applied to any cellular organism once its complete genome sequence is available.
In 2010 the health information category of KEGG was introduced to promote genome-based medical and industrial innovations using the concept of perturbations. Diseases are associated with perturbed states of molecular networks caused by perturbants including human gene variants, viruses, other pathogens and environmental factors. Drugs are treated as different types of perturbants affecting perturbed molecular networks. In 2017, we started developing the KEGG NETWORK database (2) as a collection of disease-related network variants, which are experimentally observed perturbed molecular networks. While KEGG PATHWAY has a predictive power of ‘systems’, the question we ask is whether KEGG NETWORK can have a predictive power of ‘perturbations’. At least for a special class of perturbations, namely those caused by human viruses, we wish to establish better links from viral genomes to viral perturbations and then to human systems, which would enable better understanding of viral diseases.
NEW DEVELOPMENTS IN KEGG
Overview
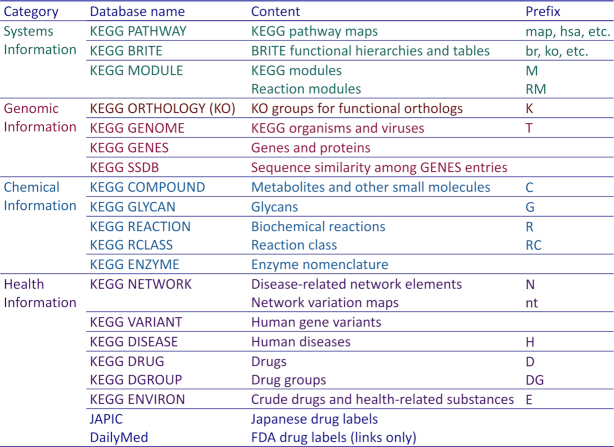
KEGG is an integrated database consisting of eighteen original databases in four categories as shown in Figure 1. The databases in the health information category together with two outside databases of drug labels are collectively called KEGG MEDICUS. The original databases are all manually curated except the computationally generated SSDB database. The content covers wide-ranging biological objects, including genes and proteins (genomic information), chemical substances and reactions (chemical information), molecular interaction/reaction/relation networks (systems information) and human diseases and drugs (health information). Each biological object, when represented in KEGG, is given a unique identifier mostly in the form of a prefix followed by a five-digit number, such as hsa05010 for the pathway map of Alzheimer disease in the PATHWAY database and K04505 for the functional ortholog of presenilin 1 in the KO database. For the GENES, SSDB, ENZYME and VARIANT databases, the identifier takes the form of db:entry, such as hsa:5663 for human presenilin 1 (PSEN1) in the GENES database and hsa_var:5663v1 for PSEN1 mutation in the VARIANT database.
Figure 1.
KEGG consists of eighteen original databases in four categories. The health information category, called KEGG MEDICUS, is supplemented with two outside databases of drug labels: Japanese drug labels obtained from JAPIC (http://www.japic.or.jp) and FDA drug labels linked to the DailyMed database (https://dailymed.nlm.nih.gov). The identifier of each entry in the KEGG database generally takes the form of a prefix followed by a five-digit number and is called, for example, map number, M number and K number for the PATHWAY, MODULE and KO databases, respectively.
One important principle of organizing biological objects in the KEGG database is the distinction of reference data (classes) and variation data (instances). For example, K04505 is a class of presenilin 1 and hsa:5663 is an instance in human. The pathway map for Alzheimer disease is manually drawn as a reference pathway, map05010, where nodes (boxes) are linked to KO identifiers (K numbers). The human pathway map hsa05010 is an organism-specific pathway computationally generated from the reference pathway by converting KO identifiers to human gene identifiers and by coloring nodes (boxes) in green.
Pathway, module and network
The PATHWAY database is the central database in KEGG, consisting of manually drawn KEGG pathway maps, each identified by a five-digit number preceded by ‘map’ (for the reference pathway), three- or four-letter organism code (for an organism-specific pathway) or one of the other defined prefixes. The pathway maps represent the molecular wiring diagrams of the biological systems, categorized into metabolism, genetic information processing, environmental information processing, cellular processes, organismal systems and human diseases. The MODULE database is a collection of manually defined functional units in metabolic pathways, both in terms of conserved enzyme gene sets as KEGG modules and of conserved biochemical reaction steps as reaction modules. The identifiers of modules and reaction modules are M numbers and RM numbers, respectively.
The NETWORK database is a human-specific database consisting of network elements, simply called networks, defined as functionally meaningful segments of signaling and other pathways and identified by N numbers. There are three types of networks: reference networks, disease-related variant (perturbed) networks and drug-target relations. Variant networks are further divided into three types of perturbants: human gene variants, pathogens and environmental factors. The NETWORK database may also be viewed as a collection of network variation maps (see below) identified by nt numbers, displaying aligned sets of both reference and variant networks. Reference networks are linked to reference (non-disease) pathway maps and variant networks are linked to disease pathway maps.
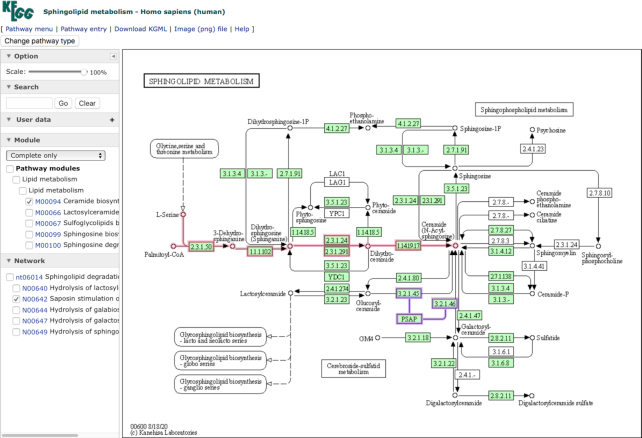
The new KEGG pathway map viewer released in July 2020 comes with a side panel for client-side operations and integrates modules, reaction modules and networks into pathways. Figure 2 shows an example of the human pathway map hsa00600 for sphingolipid metabolism. The side panel can be used to change the scale of the map, to search map objects of boxes (genes and KOs) and circles (chemical substances) by identifiers or aliases, and to selectively display the locations of modules and networks in the map. In Figure 2, the module M00094 for ceramide biosynthesis and the network N00642 for saposin stimulation of GBA and GALC are selected and displayed. PSAP (prosaposin) is known to be a causative gene for sphingolipidosis, but in KEGG metabolic pathway maps such a regulatory element is not usually included. The new pathway map viewer allows additional elements to be displayed and additional links to be enabled when the selection of certain networks are made. In Figure 2, the selection of N00642 displays the additional node of PSAP and regulatory links to 3.2.1.45 (GBA/GBA2) and 3.2.1.46 (GALC), which are not present in the original map.
Figure 2.
The new pathway map viewer with a side panel for client-side operations. Here the human pathway map hsa00600 for sphingolipid metabolism is shown with the module M00094 for ceramide biosynthesis in red and the network N00642 for saposin (PSAP) stimulation of GBA (3.2.1.45) and GALC (3.2.1.46) in purple. The saposin node and regulatory links are not present in the original map and are displayed only when this network is selected.
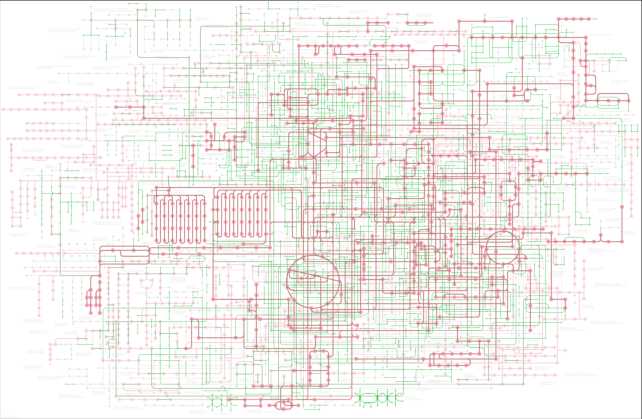
For the global maps (map numbers 01100s) and the overview maps (01200s), the new map viewer allows additional options to be selected. The coloring option in the global map distinguishes whether to use multiple coloring according to the color codes of pathway categories or single coloring of green when displaying an organism-specific pathway. The link option in the global and overview maps is whether to use the normal mode or the module mode, the latter treating the map as consisting of modules rather than individual genes or KOs. The module link mode is useful to characterize metabolic capacity of a genome or a metagenome, for modules are defined as functional units of enzyme genes for specific metabolic processes, enabling automatic evaluation of whether the units are complete. Figure 3 shows the global map of metabolic pathways in the module link mode for an environmental sample (T30798_01100) from the Tara Oceans project (3), where complete modules displayed in brown indicate the presence of specific metabolic processes. The module link mode is also implemented in the Reconstruct Pathway tool of KEGG Mapper (4).
Figure 3.
The global map of metabolic pathways can now be viewed in two modes: normal link mode and the module link mode, the latter treating the map as consisting of modules rather than individual genes or KOs. Here the global map of a Tara Oceans sample (T30798_01100) is shown in the module link mode with the coloring of pink for the background of all modules, green for mapped genes, and brown for complete modules identified in the sample.
Network variation map
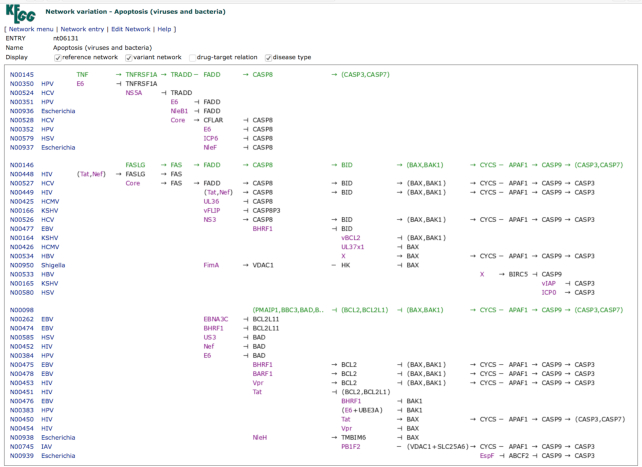
The network variation map is a computationally drawn diagram of network variations containing aligned sets of related networks involved in the same pathway. The map may also be created by collecting all types of variant networks involved in the same disease. As shown in Figure 2, the network (N number) links in the new pathway map viewer is grouped by the network variation map (nt number), directly linking to known variations that are not represented in the KEGG pathway map. Figure 4 is an example of the network variation map, nt06131 for Apoptosis (viruses and bacteria). As shown here, the variation map generally contains blocks of aligned networks, each block consisting of a reference network in green and variant networks with color coding of gene variants in red, pathogen proteins in purple and environmental factors in blue. Variant networks are linked to associated diseases, viral and bacterial infections in Figure 4, enabling comparative analysis of network perturbations.
Figure 4.
The network variation map nt06131 for Apoptosis (viruses and bacteria) showing aligned sets of reference networks in green and variant networks with viral or bacterial proteins in purple. Variant networks are linked to disease types, mostly viral infections but including five bacterial infections.
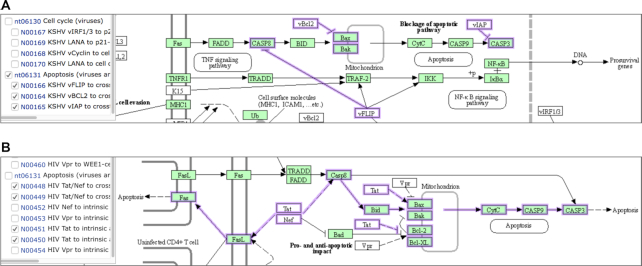
Viruses are known to either inhibit or activate apoptosis pathways depending on the virus type, which are shown in the variation map nt06131, but can be seen more clearly in the corresponding pathway maps. Figure 5 shows portions of the two pathway maps: hsa05167 for KSHV (Kaposi sarcoma-associated herpesvirus) infection and hsa05170 for HIV-1 (Human immunodeficiency virus 1) infection. The highlighted segments of apoptosis pathways in each map correspond to the variant networks included in nt06131. Anti-apoptosis is one of the hallmarks of cancer (5), and oncogenic viruses, such as KSHV, inhibit apoptosis pathways. In contrast, HIV evades the host immune system by activating apoptosis of CD4+ T helper cells.
Figure 5.
Selected networks in the variation map nt06131 are shown on the pathway maps: (A) inhibition of apoptosis by KSHV in the pathway map of hsa05167 for Kaposi sarcoma-associated herpesvirus infection and (B) activation of apoptosis by HIV in the pathway map of hsa05170 for Human immunodeficiency virus 1 infection.
The KEGG NETWORK database currently contains disease-associated variant networks for cancers, neurodegenerative diseases, endocrine and metabolic diseases including inborn errors of metabolism, viral infections and some bacterial infections. The most recent addition consists of six neurodegenerative diseases, Alzheimer disease, Parkinson disease, amyotrophic lateral sclerosis, Huntington disease, spinocerebellar ataxia and prion disease, for which variant networks have been defined from improved pathway maps. Common features of neurodegeneration (6) are found to be linked to molecular networks, including accumulation of abnormal protein aggregates, impairment of ubiquitin-proteasome system, endoplasmic reticulum stress, autophagy impairment, mitochondrial dysfunction and axonal transport defect. The network variation map nt06410 for calcium signaling is the most characteristic signaling pathway involved in many of these common features.
KO annotation and taxonomy
The KEGG Orthology groups or KOs are defined as functional orthologs for the nodes of KEGG pathway maps and BRITE hierarchies. In principle, KOs are created as sequence similarity groups in order to make KO assignment possible from sequence data. As of September 2020, there are about 24 000 KOs with 82% having links to experimentally characterized sequence data. Unfortunately, however, there are still legacy KOs that started as EC number groups and contain diverse sets of sequence data. Legacy KOs are gradually being divided into smaller KOs by considering taxonomic groups.
The KEGG taxonomy data for cellular organisms and viruses are taken from the NCBI taxonomy database (7) and displayed with a predefined framework of the classification system. For cellular organisms, the ordering among the same taxonomic rank is not alphabetical, but rather manually defined. This is why Homo sapiens always appears on top in the KEGG taxonomy. For viruses, the traditional Baltimore classification (8) is used at the top level and integrated into the ICTV (International Committee on Taxonomy of Viruses) classification system (9), according to the correspondence shown in Figure 6.
Figure 6.
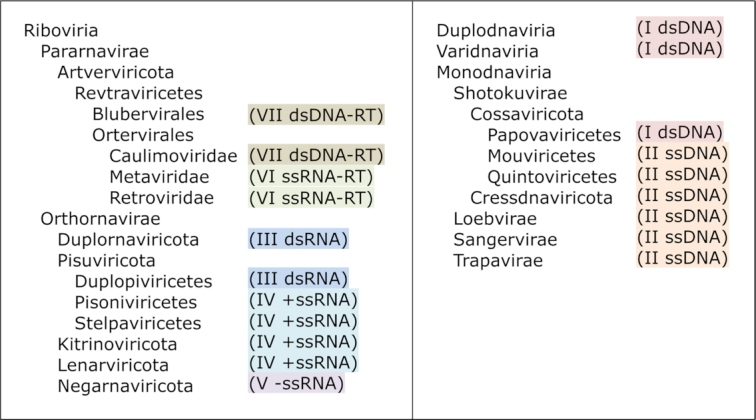
The correspondence between the seven groups of Baltimore classification (colored) and the hierarchy of ICTV virus classification consisting of realm (-viria), kingdom (-virae), phylum (-viricota), class (-viricetes) and family (-viridae).
For the internal annotation of the KEGG GENES database, a new tool named KoAnn (KO Annotation) has been developed for assigning KOs to individual genes. The KoAnn tool uses the SSDB database and the GFIT tables in a similar way as the previously developed KOALA tool (10). The SSDB database is computationally generated from the GENES database and contains sequence similarity scores and best hit relations for all gene pairs in pairwise genome comparisons. The GFIT table is a summary table for each gene of each organism listing top scoring genes in other organisms with attributes including similarity score, identity, best hit flag, sequence length and overlap of alignment. Because KoAnn makes safer predictions using a different weighting scheme overcoming the problems of KOALA, the KO assignment is now more stable and reliable.
As of September 2020, KOs are assigned to 52% of the over 31 million genes (mostly proteins but including RNAs) for cellular organisms, but only 22% of the 460 thousand genes for viruses. Sequence variations of viral proteins appear to be very large, and it will be impossible to decompose viral proteins into KOs. Our approach is to define specific groups of sequences when the need arises for representation of KEGG pathway maps, BRITE hierarchies and other functional features. The grouping is often done by extracting a smaller group from a larger group, such as shown below for coronavirus spike glycoproteins.
K19254 S; Coronaviridae (excluding betacoronavirus) spike glycoprotein
K24325 S; betacoronavirus (excluding SARS and MERS) spike glycoprotein
K24152 S; SARS coronavirus spike glycoprotein
K24324 S; MERS coronavirus spike glycoprotein
K24152 currently contains spike glycoproteins from SARS-CoV, SARS-CoV-2 (COVID-19 virus), and a bat coronavirus.
Drug information
The health information category of KEGG (Figure 1) contains drug labels for all prescription drugs and OTC drugs in Japan and in the USA. The Japanese drug labels are obtained from JAPIC (Japan Pharmaceutical Information Center) every month and processed (i) to assign KEGG DRUG D numbers to drug products according to the active ingredient, (ii) to assign D/C/E numbers to pharmaceutical additives of each drug product, (iii) to extract and standardize drug-drug interactions associated with contraindication and precaution using KEGG identifiers and ATC codes, (iv) to extract and standardize drug metabolism data using KEGG identifiers and (v) to link indications to KEGG DISEASE H numbers. Similar processing is performed on FDA drug labels every month excluding additives and drug-drug interactions. Furthermore, KEGG DRUG incorporates the most up-to-date drug information from the USA, Japan and Europe, keeping track of new drug approvals by FDA, PMDA and EMA, and new drug names incorporated in USAN, JAN and INN.
As a result of these efforts, KEGG has now become one of the most utilized drug information resource for Japanese society at large, being heavily accessed via web searches of drug names. Although the Japanese-language contents may not be of use to non-Japanese users, the processing of the entire set of drug labels has made KEGG annotations more accurate and comprehensive. The DRUG database contains, among others, manually curated data for drug targets with associated pathways, drug metabolizing enzymes and transporters with their interactions, and efficacy and disease information. Furthermore, gene variants as drug targets or markers are incorporated in the DRUG and NETWORK databases.
Virus-cell interaction
Thus far, viruses have been treated in KEGG as perturbants causing human diseases. There are eleven pathway maps for viral infections and their corresponding networks and network variation maps have been developed. Comparisons of viral proteins with bacterial effector proteins have also been made as perturbants in the network variation maps. However, knowledge of viral proteins represented in KEGG is still very much limited. In order to increase the number of experimentally characterized viral proteins and to define functional orthologs (KOs), we started accumulating different types of virus-cell interaction data, such as the interactions of viral entry proteins and cellular receptors, irrespective of whether signaling pathways inside the cell are known or not. We hope an increased number of viral KOs with known functions will enable viral genome based predictions of viral perturbations and possibly lead to practical applications. Eventually, however, in order to better understand viruses, it may be necessary to treat cellular organisms and viruses as a coevolving ecosystem rather than as individual system-perturbation relationships.
DATA AVAILABILITY
KEGG is a self-sustaining database. Without any substantial public funding, it is based mainly on the ‘community funding’ model, whereby the KEGG user community contributes financially for the development and maintenance of the database. KEGG is updated daily and made available at the KEGG website (https://www.kegg.jp/). The content is mirrored to the GenomeNet website (https://www.genome.jp/kegg/) one day later. A fixed version is released every three months with the release number.
ACKNOWLEDGEMENTS
Computational resources were provided by the Bioinformatics Center, Institute for Chemical Research, Kyoto University.
Contributor Information
Minoru Kanehisa, Institute for Chemical Research, Kyoto University, Uji, Kyoto 611-0011, Japan.
Miho Furumichi, Institute for Chemical Research, Kyoto University, Uji, Kyoto 611-0011, Japan.
Yoko Sato, Social ICT Solutions Department, Fujitsu Kyushu Systems Ltd., Hakata-ku, Fukuoka 812-0007, Japan.
Mari Ishiguro-Watanabe, Human Genome Center, Institute of Medical Science, University of Tokyo, Minato-ku, Tokyo 108-8639, Japan.
Mao Tanabe, Institute for Chemical Research, Kyoto University, Uji, Kyoto 611-0011, Japan.
FUNDING
National Bioscience Database Center of the Japan Science and Technology Agency (in part). Funding for open access charge: National Bioscience Database Center of the Japan Science and Technology Agency.
Conflict of interest statement. None declared.
REFERENCES
- 1. Kanehisa M. Toward understanding the origin and evolution of cellular organisms. Protein Sci. 2019; 28:1947–1951. [DOI] [PMC free article] [PubMed] [Google Scholar]
- 2. Kanehisa M., Sato Y., Furumichi M., Morishima K., Tanabe M.. New approach for understanding genome variations in KEGG. Nucleic Acids Res. 2019; 47:D590–D595. [DOI] [PMC free article] [PubMed] [Google Scholar]
- 3. Sunagawa S., Coelho L.P., Chaffron S., Kultima J.R., Labadie K., Salazar G., Djahanschiri B., Zeller G., Mende D.R., Alberti A. et al.. Ocean plankton. Structure and function of the global ocean microbiome. Science. 2015; 348:1261359. [DOI] [PubMed] [Google Scholar]
- 4. Kanehisa M., Sato Y.. KEGG Mapper for inferring cellular functions from protein sequences. Protein Sci. 2020; 29:28–35. [DOI] [PMC free article] [PubMed] [Google Scholar]
- 5. Hanahan D., Weinberg R.A.. The hallmarks of cancer. Cell. 2000; 100:57–70. [DOI] [PubMed] [Google Scholar]
- 6. Jellinger K.A. Recent advances in our understanding of neurodegeneration. J. Neural Transm. (Vienna). 2009; 116:1111–1162. [DOI] [PubMed] [Google Scholar]
- 7. Federhen S. The NCBI Taxonomy database. Nucleic Acids Res. 2012; 40:D136–D143. [DOI] [PMC free article] [PubMed] [Google Scholar]
- 8. Baltimore D. Expression of animal virus genomes. Bacteriol. Rev. 1971; 35:235–241. [DOI] [PMC free article] [PubMed] [Google Scholar]
- 9. Lefkowitz E.J., Dempsey D.M., Hendrickson R.C., Orton R.J., Siddell S.G., Smith D.B.. Virus taxonomy: the database of the International Committee on Taxonomy of Viruses (ICTV). Nucleic Acids Res. 2018; 46:D708–D717. [DOI] [PMC free article] [PubMed] [Google Scholar]
- 10. Kanehisa M., Goto S., Sato Y., Kawashima M., Furumichi M., Tanabe M.. Data, information, knowledge and principle: back to metabolism in KEGG. Nucleic Acids Res. 2014; 42:D199–D205. [DOI] [PMC free article] [PubMed] [Google Scholar]
Associated Data
This section collects any data citations, data availability statements, or supplementary materials included in this article.
Data Availability Statement
KEGG is a self-sustaining database. Without any substantial public funding, it is based mainly on the ‘community funding’ model, whereby the KEGG user community contributes financially for the development and maintenance of the database. KEGG is updated daily and made available at the KEGG website (https://www.kegg.jp/). The content is mirrored to the GenomeNet website (https://www.genome.jp/kegg/) one day later. A fixed version is released every three months with the release number.


