

Abstract
VIrus Particle ExploreR data base (VIPERdb) (http://viperdb.scripps.edu) is a curated repository of virus capsid structures and a database of structure-derived data along with various virus specific information. VIPERdb has been continuously improved for over 20 years and contains a number of virus structure analysis tools. The release of VIPERdb v3.0 contains new structure-based data analytics tools like Multiple Structure-based and Sequence Alignment (MSSA) to identify hot-spot residues within a selected group of structures and an anomaly detection application to analyze and curate the structure-derived data within individual virus families. At the time of this writing, there are 931 virus structures from 62 different virus families in the database. Significantly, the new release also contains a standalone database called ‘Virus World database’ (VWdb) that comprises all the characterized viruses (∼181 000) known to date, gathered from ICTVdb and NCBI, and their capsid protein sequences, organized according to their virus taxonomy with links to known structures in VIPERdb and PDB. Moreover, the new release of VIPERdb includes a service-oriented data engine to handle all the data access requests and provides an interface for futuristic data analytics using machine leaning applications.
INTRODUCTION
Virus Particle Explorer database (VIPERdb) (http://viperdb.scripps.edu) is a repository of virus capsid structures and their structure-derived properties (1–4). In addition to icosahedral virus capsid structures, which are curated by orienting them in a single icosahedral convention, the structures of helical viruses and non-icosahedral capsids are now included in VIPERdb. Moreover, in some cases (e.g. Flaviviridae, Rotaviruses), the models of glycoprotein layers are included. Majority of the virus capsid structures are analyzed in terms of protein-protein interactions and annotation of surface accessible residues as well as calculation of simple properties such as particle diameter (size) and net surface charge etc. The results are stored in a MySQL database along with the metadata on virus taxonomy, virus architecture and displayed as dynamic webpages with tables and graphs. Moreover, a number of web-based tools are provided for the users to access the structure-derived data and query the database for properties specific to a particular virus or a virus family (e.g. Amino Acid Info, Contact Finder under Utilities tab).
The first version of VIPERdb, simply known as VIPER at that time, was launched in 1998 with the aim of providing the biologically accurate virus assemblies and their computational analysis (1). It was later converted into a MySQL relational database in 2005 (2) and subsequently developed into an API (Application Program Interface) enabled database in 2008 (3). Here, we describe the release of new version of VIPERdb v3.0 that is designed for performing data analytics and knowledge discovery applications, termed ‘viral-informatics’. In addition to the new data analytics tools, such as multiple structure-based sequence alignment (MSSA) tool and validation of structural descriptors within individual virus families, we release the first version of Virus World database (VWdb) that contains all the characterized viruses (∼181,000), that are currently documented at ICTVdb (5,6) and NCBI databases (7,8), along with the information on viral coat protein (VCP) sequences and virus taxonomy. Moreover, in VIPERdb v3.0, all the tools and databases are managed by service-oriented data engine and next generation APIs that allow straightforward communication between the applications and offers a user-friendly interface for future machine learning projects involving VIPERdb and VWdb.
NEW DATABASE ARCHITECTURE AND APPLICATIONS
The new database architecture can be divided into two main modules VIPERdb Graphics Engine (VGE) and VIPERdb Data Engine (VDE) (Figure 1).
Figure 1.
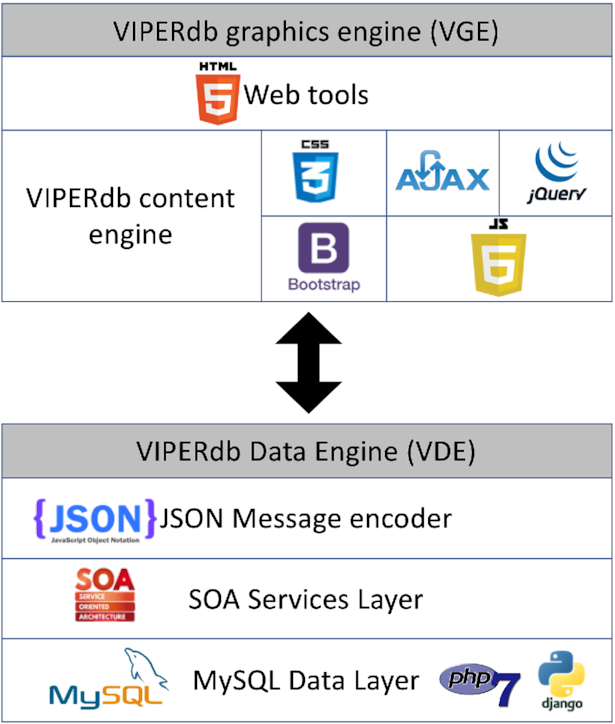
A schematic showing the modular organization of VIPERdb in terms of data engine (VDE) and graphics engine (VGE) along with the various programming languages and web technologies used in their design and development.
VIPERdb Graphics Engine (VGE)
Technological advances in data analytics and improvements in web design and programming provided new opportunities to develop sophisticated web-based tools as part of this new release (e.g. MSSA, Anomaly Detection). In general, the tools used by the structural biology community require multiple pieces of information and subsequent calculations in order to derive new knowledge. The tools that are available at VIPERdb use interactive 2D, 3D graphics interfaces, plots and tables or a combination of them. All in all, there are at least thirty different tools that allow the exploration of various aspects of the viral capsids (Supplementary Tables S1–S3). These tools have been created by a number of developers with a wide range of programing skills at different time periods in the past two decades. The VIPER-Graphis engine (VGE) is a subsystem of VIPERdb 3.0 that provides a way to simplify, improve and standardize how various tools access and return the data. The VGE was developed with the latest web technology standards (HTML5, PHP7, Django, CSS3, Java Script 6) and the frameworks: Bootstrap, AJAX and JQuerry (Figure 1). This in turn allows the development of modular object-oriented functionalities that can be used in more than one tool. This implementation of VGE that required a rewrite and cleaning up of the previous VIPERdb source code, in turn facilitates the development of new tools with minimal effort.
VIPERdb Data Engine (VDE)
One of the key tasks at VIPERdb is to organize, query, process and prepare the data from diverse sources (e.g. display stored information (T-numbers), calculate data (e.g. diameters, surface charge) and links to images (TexMol (9) and Chimera (10) images), external sources (e.g. PDB (11), PubMed, UniProt (12)). Majority of the applications in VIPERdb access the data through the VDE. The design of VDE focused on three key aspects: (i) interoperability, (ii) modular design and (iii) security. The Service Oriented Architecture (SOA) controls the operations of VDE and considers the data operations as services. In simple terms, a service is a small program that receives an input and returns a specific output. Such design is agnostic to the programing language or technology that is requesting the service. This means a service can be used by a program written in C++, Python, java, an HTML web page or a mobile device application. Different data queries are made into specific services e.g., there is a service for obtaining a list of all the virus families in VIPERdb and a separate service for accessing the a.a. residues in a VCP, identified by PDB-ID and chain-IDs. The specifics of a service (query) are hidden from the clients for the security reasons, i.e., protection from hacking attacks.
New graphics layout
The new graphics layout is simplistic and less cluttered with a blue menu bar at the top, which remains a fixture on all pages. The menu bar contains various pulldown menus and a search box for choosing a specific virus structure either by its PDB-ID (default) or by the Title/Name (Figure 2A). Listed just below the menu bar (on the main page) are the total number of structures available in the database and the associated virus families and genera they belong to. By clicking on ‘View Details’ provides further details in the respective categories. Below the panels showing the statistics are the pictures of a few latest entries that scroll through in a loop. By clicking on the ‘View’ button on the picture takes one to the info_page of the corresponding entry. Following that is a bar graph of number of virus structures available in individual virus families that are currently available in VIPERdb. This graph provides a quick glimpse of relative abundance of the available structures from individual families. By clicking on any of the bars shows a table of names of viruses in the virus family and the associated metadata (e.g., genus, PDB-IDs, T-number etc.). On to its right is a plot showing the number of virus structures determined in each year by X-ray crystallography and cryo-electron microscopy (cryo-EM). The main page also shows the details of the user statistics and their global geographical location.
Figure 2.
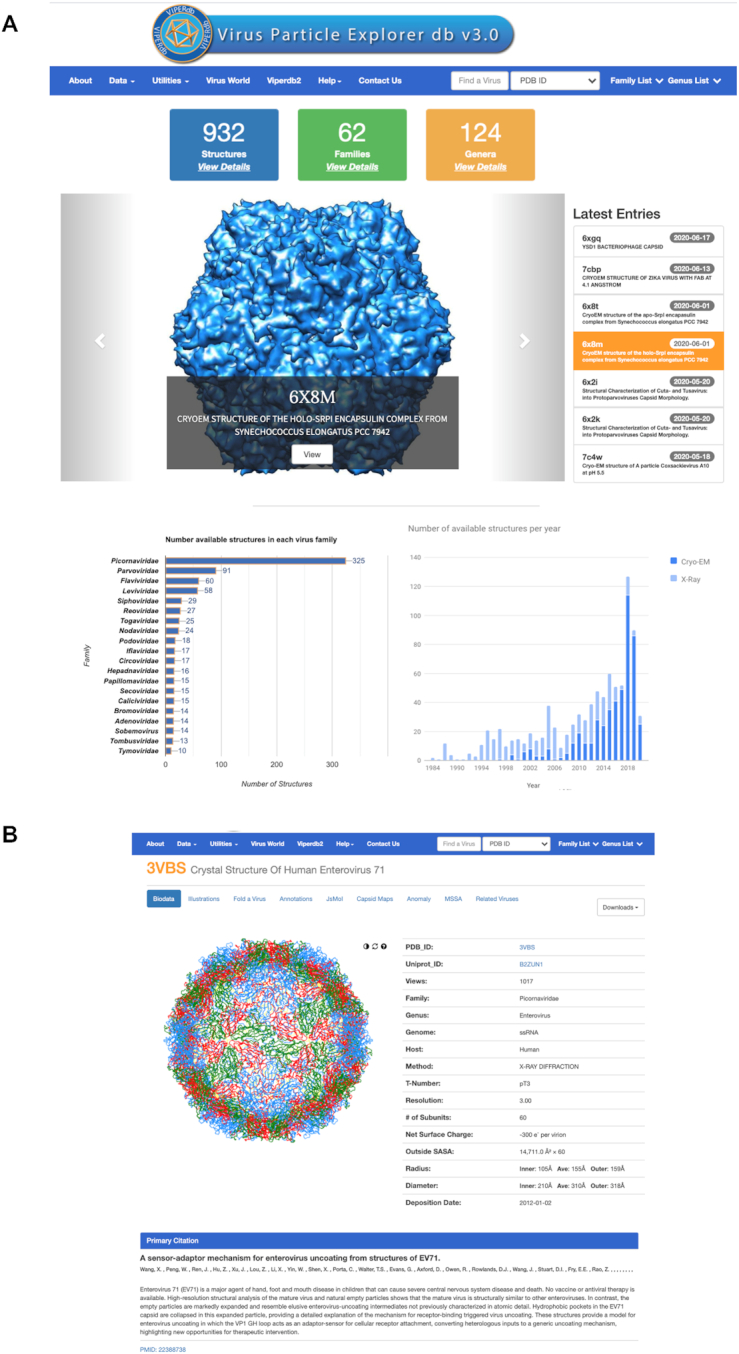
Graphical layouts at VIPERdb v3.0. (A) Top of the main page showing various items in the menu bar and the statistics of total number of structures in the database along with the number of virus families and genera they belong to. Below that is a window showing the pictures and list of a few latest structures in the database. On the bottom left is a bar graph showing the number of structures available in each virus family. The list of structures in the family can be accessed by clicking on the corresponding bar. On the bottom right is a plot of number of virus structures determined by X-ray crystallography and cryo-electron microscopy (cryo-EM) in each year. The full-length of the bars corresponds to the total number of virus structures (Y-axis) determined in each year (X-axis), while the extent of the light and dark blue regions of the bars indicate the number of structures determined by X-ray crystallography and cryo-EM respectively. (B) An example info_page of Human Enterovirus 71 (PDB-ID: 3VBS).
However, the new layout of info_pages of individual viruses maintain the similar organization as in the previous version with a few changes to make it more user friendly (Figure 2B). The Supplementary Tables S1 and S2 show the description of various items in the data and utilities pulldown menus, respectively. As in the earlier release, various pictorial/graphics representations and the structure-derived results of individual viruses are arranged in individual tabs (e.g. Biodata, Illustrations, Fold-a-Virus etc.). Notably, however, all the downloadable files (e.g. VIPER coordinates, PDB2VIPER matrix) can be accessed from the ‘Downloads’ button towards the right of the above-mentioned tabs (Figure 2B).
Multiple structure-based sequence alignment (MSSA)
The MSSA tool generates structure-based sequence alignments of the chosen VCPs. The structure superpositions and the subsequent sequence alignments were calculated using the KPAX program (13). Significantly, every amino acid (a.a.) in the alignment is identified with the respective structural roles as interface, core or surface residues that were precalculated and stored in the VIPERdb. In addition to comparing the a.a. sequence, the structure roles of the individual residues are compared for all the aligned positions. Such comparisons highlight the locations in the structure, where the structure roles are maintained even when the sequence is not conserved and the ‘hotspot’ locations, where both the sequence and the structural roles of the aligned residues are conserved.
The MSSA tool can be accessed from the Utilities menu from the (blue) menu bar at the top. The interface of the tool is divided into four steps (Figure 3A): The first step is to provide the PDB/VDB accession code into a textbox, labeled PDB/VDB, and then select subunit (chain) of interest (second step). Of note, MSSA does not by default select all the subunits (e.g. A, B and C) in a structure (PDB file) at the same time, hence the need to provide one subunit at the time. The third (‘Add’) step actually selects and adds the subunit (chain) to the list of subunits to be aligned. The steps 1–2–3 are repeated until all the subunits to be compared are selected. The final fourth step is to ‘Generate Alignment’. For example, to compare the B and C-subunits of Black Beetle Virus (2bbv) with Nodamura virus (1nov) A and B subunits—first, input the PDB accession code 2bbv (step-1), then select subunit B (step-2) and click the ‘Add’ button (step-3). Then repeat the 1–2–3 steps by inputting, 2bbv, C and Add; 1nov, A and Add; 1nov, B and Add and finally clicking on ‘Generate alignment’ button. The multiple structure-based sequence alignment and the mapping of structural annotations onto the alignment are generated on the fly.
Figure 3.

Description of Multiple Structure-based Sequence Alignment (MSSA) utility. (A) Various steps involved in the data input to MSSA. (B) An example output of MSSA for the alignment of A-subunit of 1NOV and B-subunit of 2BBV. The aligned residues are colored, red, green, dark blue and light blue according their structural annotations as interface, core, outer surface and interior surface residues, respectively. The positions where the structural roles are conserved, but not their sequence, are indicated with the corresponding symbols of their structural roles in the structural conservation (Str-Cons) row as described in the color/symbol-key at the top. Not conserved residues (locations) either according to their sequence or structural roles are identified with a dot (.) in the Seq-Cons or Str-Cons rows accordingly. The positions, where the both sequence and structural roles conserved, are considered as the hotspot residues and identified with a yellow box in the Seq-Cons and Str-Cons rows. Shown below the alignment is the summary of sequence and structure-role conserved residues and hotspot residues as well as the composition of the residue structural roles shown as a pie chart. Additionally, the characteristic composition of structural roles of residues in individual VCPs are also shown as pie charts.
An example of annotated structure-based sequence alignment is shown in the Figure 3B. The alignment is annotated with three colors that represent corresponding structural roles of individual amino acids—red: interface; green: core; and blue: surface. The dark blue and light blue colors distinguish outer surface and inner surface residues, respectively. Additionally, each alignment block contains two additional rows that describe the consensus/conserved locations in the sequence and structural roles. The first (top) row shows the consensus (single letter) a.a. sequence at each location if it is conserved in all the CPs, otherwise a dot (.) is shown. The second row shows the conserved structural role of aligned residues, indicated by a symbol that is associated with the corresponding structural role. The keys for the symbols and colors of the respective structural roles are shown at the top of the alignment (Figure 3B). When both the sequence and structure roles are conserved, the consensus column is highlighted in yellow, which represents a hotspot residue (location).
The summary of the aligned and conserved residues is shown at the end of the alignment along with a pie chart highlighting the composition of residues with the conserved structural roles (Figure 3B). Not surprisingly there are greater number of structure-role conserved residues than sequence conserved or hotspot residues. In addition, the pie charts of the composition of residues according to their structural roles in each selected CP are shown as the characteristic structural fingerprints, ‘pinwheel’ style.
Data curation by anomaly detection
The increase in the number of virus capsids and the associated structure-derived properties presents a need and also provides an opportunity to evaluate the consistency and characteristics of structure descriptors within individual virus families. Significantly, the results from such data analytics enable us to curate the data and to identify potential anomalies that may not obey the trends observed in the individual virus families (e.g. Bromoviridae). The basis for the capsids for not obeying the trends in structural characteristics seen in the respective families could be due to one or more of following reasons: (i) forming different capsid architectures (e.g., T = 1 versus T = 3), (ii) inconsistent set of symmetry matrices used to generate proper capsid assembly and (iii) errors in the estimation of PDB2VIPER matrix. For this purpose, we developed a tool for anomaly detection (AD) based on gaussian kernel analysis of the structural descriptors of virus capsids.
The structural descriptors for each virus capsid, represented by the VCPs in the icosahedral asymmetric unit (IAU), are identified as the total number of residues ( in each interface/core/surface structural regions (r). To detect anomalies within a particular virus family, all members in the family were used for establishing a normal distribution of each structural region, r;
 . The
. The  values correspond to probabilities of the structural descriptors conforming to normal distribution.
 |
Using the above  values, we calculate the overall probability for each virus capsid adhering to the normal distribution as
  .
.
The  values are then normalized to be between 0 and 1.
  The capsids with
  , are considered outliers (anomalies), where
  .
.
The AD tool can be accessed from the Utilities menu. Figure 4 shows the application interface and the output of AD tool that contains a dropdown menu at the top for selecting the virus family of our interest. Once a family is selected, the application displays a plot of the descriptors of all the viruses in the family and a table with all the relevant information. Shown on the Y-axis are the number of residues annotated to be in the respective structural regions of different capsids in a virus family that are represented on the X-axis. Three different data series correspond to Interface, Core and Surface residues. The members (capsids) that display significant deviations in the number of residues in the corresponding regions from the majority of viruses are considered as anomalies. Shown below the plot is a table containing the details of the viruses in the family including their names and associated metadata along with the scores based on the gaussian approximation as described above. The capsids that have been identified as anomalies are highlighted in red. Significantly, we have successfully used the AD application to curate a few virus capsids that were incorrectly entered into VIPERdb.
Figure 4.

Description of the Anomaly Detection tool. The plot of structural descriptors, in terms of the number of residues at interface, core and surface regions, is shown for each virus/capsid in the family of Bromoviridae. The anomalies are identified as by magenta colored ovals. Example locations of Interface/Core/Surface residues are shown as circular insets for illustration purposes. The metadata associated with individual viruses are shown in the form of a table. The anomaly entries for which the scores are <0.2 are highlighted in red.
Virus world
One of the highlights of the VIPERdb v3.0 is the first release of Virus World database (VWdb). The VWdb is a new database of all the characterized viruses, which include both enveloped and nonenveloped viruses, available to date at NCBI database (7,8) along with the associated metadata on virus taxonomy, genome type, coat protein sequences. We have used the ICTV (International Committee on Taxonomy of Viruses) (5,6) approved family/genus classification of viruses. All this information (data) is stored in an independent MySQL database, separate from VIPERdb. Currently there are 181 476 identified viruses from 158 families and 1038 genera available in the VWdb (Figure 5A). In future, we plan to provide phylogenetic trees of individual virus families based on the coat protein sequences.
Figure 5.

Graphical layout of Virus World db (VWdb). (A) Panel showing the main page of the VWdb with the Virus World Family Tree application (VW-FTA). (B) Illustration of a section of the family tree of Bromoviridae, once selected from the pull-down menu of the VW-FTA. (C) VWdb Info_page of Brome mosaic virus (BMV). (D) Panel showing the individual proteins in the proteome associated with BMV.
Once a family is selected from the pulldown menu of the Virus World Family Tree application (VW-FTA), various genera and individual viruses in the family are shown in the form of a tree representation. The nodes associated with genera can be collapsed to view only specific genera of interest. Going forward we will also provide an option to generate the trees according to the genus of choice. Once you click on a virus of interest, an info_page for the virus is generated (Figure 5C) with the details of virus taxonomy and a.a. sequence of the CP that can be downloaded in FASTA format. We also included a link to the corresponding entry in the UniProt database (12). In future, we will populate the details of all the susceptible hosts and the diseases caused by the individual viruses and include them in the info_pages. Furthermore, if a structure is available for the chosen virus, hyperlinks are provided to the corresponding entries in VIPERdb and PDB. Significantly, the ‘Proteome’ button provides a list of all the proteins associated with the virus (e.g. CP, RDRP, Movement proteins) and their details. There are currently ∼5 million virus related proteome sequences stored in the VWdb. We are very optimistic about the future improvements to VWdb and the interplay between VIPERdb and VWdb.
CONCLUSIONS AND FUTURE DIRECTIONS
The release of VIPERdb v3.0 includes new tools such as MSSA, anomaly detection and importantly contains the first report of the VWdb that comprises the metadata of all the characterized viruses known to date. Moreover, we rewrote the majority of the code using the latest programming and web technologies (e.g. HTML5, PHP7, Django, CSS3 and Java Script 6) by dividing the VIPERdb architecture into two main modules: VGE and VDE and representing different functionalities as services (Web APIs) that can be accessed remotely by the users as detailed in the developers guide (http://viperdb.scripps.edu/Developers_guide.php). Even though the VIPERdb and VWdb are currently standalone databases, we plan to integrate them in future.
Supplementary Material
ACKNOWLEDGEMENTS
We are very appreciative of the efforts of a number of undergraduate students from the Departments of Computer Systems and information Technologies, Tecnologico Nacional de Mexico/Instituto Tecnologico Superior de Irapuato, México, who worked on porting various tools into VIPERdb v3.0 as part of fulfilment of their project work, a requirement for completing their undergraduate studies for the past two years. We gratefully acknowledge the contributions of the following students: André Delgado Gómez, Ignacio Cruz Rodríguez, Brian Alejandro Flores Silva, Alan Misael Mendoza Pérez, Antonio de Jesús Rodríguez García, Noemi Villafaña Navarrete, Diego Abraham Corona Chavéz, Fernando Vargas Bravo, Juan Daniel Zavala Martínez, José Armando Laguna Cardoso and Diego Alfonso Cendejas Vázquez. We also acknowledge the contributions of a number of previous students and research associates, who participated in the development of VIPERdb project in the past two decades: Ian Borelli (deceased), Komath Damodaran, Gabriel Lander, Kevin Li, Ryan Morton, Avinash Nanjundaiah, Padmaja Natarajan, Brian Okerberg, Chunxu Qu, Craig Shepherd, Sangita Venkataraman and Jonathan Wong.
Notes
Present address: Phuong Ho, Department of Bioengineering, University of California San Diego, 9500 Gilman Drive, La Jolla, CA 92039, USA.
Contributor Information
Daniel Montiel-Garcia, Department of Integrative Structural and Computational Biology, The Scripps Research Institute, La Jolla, CA 92037, USA; Departments of Computer Systems and Information Technologies, Tecnologico Nacional de Mexico & Instituto Tecnológico Superior de Irapuato, Irapuato, Guanajuato, México.
Nelly Santoyo-Rivera, Departments of Computer Systems and Information Technologies, Tecnologico Nacional de Mexico & Instituto Tecnológico Superior de Irapuato, Irapuato, Guanajuato, México.
Phuong Ho, Department of Integrative Structural and Computational Biology, The Scripps Research Institute, La Jolla, CA 92037, USA.
Mauricio Carrillo-Tripp, Biomolecular Diversity Laboratory, Centro de Investigación y de Estudios Avanzados Unidad Monterrey, Vía del Conocimiento 201, Parque PIIT, C.P. 66600, Apodaca, Nuevo León, México.
Charles L Brooks III, Department of Computational Medicine and Bioinformatics, University of Michigan, Ann Arbor, MI, USA; Department of Chemistry, University of Michigan, Ann Arbor, MI, USA; Department of Biophysics, University of Michigan, Ann Arbor, MI, USA.
John E Johnson, Department of Integrative Structural and Computational Biology, The Scripps Research Institute, La Jolla, CA 92037, USA.
Vijay S Reddy, Department of Integrative Structural and Computational Biology, The Scripps Research Institute, La Jolla, CA 92037, USA.
SUPPLEMENTARY DATA
Supplementary Data are available at NAR Online.
FUNDING
NIH [R21AI137580 to V.S.R.]. Funding for open access charge: NIH.
Conflict of interest statement. None declared.
REFERENCES
- 1. Reddy V.S., Natarajan P., Okerberg B., Li K., Damodaran K.V., Morton R.T., Brooks C.L. III, Johnson J.E.. Virus Particle Explorer (VIPER), a website for virus capsid structures and their computational analyses. J. Virol. 2001; 75:11943–11947. [DOI] [PMC free article] [PubMed] [Google Scholar]
- 2. Shepherd C.M., Borelli I.A., Lander G., Natarajan P., Siddavanahalli V., Bajaj C., Johnson J.E., Brooks C.L. III, Reddy V.S.. VIPERdb: a relational database for structural virology. Nucleic Acids Res. 2006; 34:D386–D389. [DOI] [PMC free article] [PubMed] [Google Scholar]
- 3. Carrillo-Tripp M., Shepherd C.M., Borelli I.A., Venkataraman S., Lander G., Natarajan P., Johnson J.E., Brooks C.L. III, Reddy V.S.. VIPERdb2: an enhanced and web API enabled relational database for structural virology. Nucleic Acids Res. 2009; 37:D436–D442. [DOI] [PMC free article] [PubMed] [Google Scholar]
- 4. Ho P.T., Montiel-Garcia D.J., Wong J.J., Carrillo-Tripp M., Brooks C.L. III, Johnson J.E., Reddy V.S.. VIPERdb: a tool for virus research. Annu. Rev. Virol. 2018; 5:477–488. [DOI] [PubMed] [Google Scholar]
- 5. Adams M.J., Lefkowitz E.J., King A.M., Harrach B., Harrison R.L., Knowles N.J., Kropinski A.M., Krupovic M., Kuhn J.H., Mushegian A.R. et al.. 50 years of the International Committee on Taxonomy of Viruses: progress and prospects. Arch. Virol. 2017; 162:1441–1446. [DOI] [PubMed] [Google Scholar]
- 6. van Regenmortel M.H., Mahy B.W.. Emerging issues in virus taxonomy. Emerg. Infect. Dis. 2004; 10:8–13. [DOI] [PMC free article] [PubMed] [Google Scholar]
- 7. Coordinators N.R. Database resources of the National Center for Biotechnology Information. Nucleic Acids Res. 2016; 44:D7–D19. [DOI] [PMC free article] [PubMed] [Google Scholar]
- 8. Coordinators N.R. Database resources of the National Center for Biotechnology Information. Nucleic Acids Res. 2017; 45:D12–D17. [DOI] [PMC free article] [PubMed] [Google Scholar]
- 9. Bajaj C., Djeu P., Thane A., Siddavanahalli V.. Proc. of the Annual IEEE Visualization Conference. 2004; Austin, TX: IEEE Computer Society Press; 243–250. [Google Scholar]
- 10. Pettersen E.F., Goddard T.D., Huang C.C., Couch G.S., Greenblatt D.M., Meng E.C., Ferrin T.E.. UCSF Chimera–a visualization system for exploratory research and analysis. J. Comput. Chem. 2004; 25:1605–1612. [DOI] [PubMed] [Google Scholar]
- 11. Berman H.M., Westbrook J., Feng Z., Gilliland G., Bhat T.N., Weissig H., Shindyalov I.N., Bourne P.E.. The protein data bank. Nucleic Acids Res. 2000; 28:235–242. [DOI] [PMC free article] [PubMed] [Google Scholar]
- 12. UniProt C. UniProt: a worldwide hub of protein knowledge. Nucleic Acids Res. 2019; 47:D506–D515. [DOI] [PMC free article] [PubMed] [Google Scholar]
- 13. Ritchie D.W. Calculating and scoring high quality multiple flexible protein structure alignments. Bioinformatics. 2016; 32:2650–2658. [DOI] [PubMed] [Google Scholar]
Associated Data
This section collects any data citations, data availability statements, or supplementary materials included in this article.