

Abstract
BACKGROUND & AIMS:
Celiac disease can reduce bone mineral density. We sought to determine the prevalence and risk factors for low areal bone mineral density (aBMD) in children with celiac disease.
METHODS:
We performed a retrospective cohort study of 673 children with celiac disease (63% female; median age at diagnosis, 10.6 y; interquartile range, 7.8–13.9) who underwent dual x-ray absorptiometry (DXA) from 2009 through 2016 at the Children’s Hospital of Philadelphia. We collected demographic, clinical, and laboratory data from medical records. We performed logistic regression analysis to identify factors associated with low (Z less than −2) lumbar spine aBMD Z (aBMD-Z) scores at initial and subsequent tests.
RESULTS:
The time between diagnosis of celiac disease and first DXA was 0 days (interquartile range, −11 to 31 d). The mean aBMD-Z score at the children’s initial scan was −0.4 ± 1.2; 46 children had aBMD-Z scores less than −2 (6.8%; 95% CI, 5.2%–9.0%). Those who had a second DXA analysis (n = 108; 16.0%) had a significant increase in aBMD-Z score (mean change, 0.29; P = .0005). Higher body mass index (BMI) was associated with lower odds of a low aBMD-Z score at the initial DXA analysis (odds ratio, 0.46, 95% CI, 0.35–0.50). BMI-Z scores greater than −0.4 identified children with a low aBMD-Z at their initial DXA analysis with a 95% negative predictive value.
CONCLUSIONS:
Approximately 7% of subjects with celiac disease had a low aBMD-Z score, determined by DXA, at the time of diagnosis; this value was nearly 3-fold higher than expected from a population of children of this age and sex distribution. BMI-Z scores could be used to identify children with celiac disease at risk for low BMD who should receive DXA screening.
Keywords: Pediatric, Noninvasive, Gluten, Detection
Celiac disease is one of the most common causes of intestinal malabsorption in childhood.1 Celiac disease–related malabsorption leads to alterations in calcium absorption, which negatively influences skeletal maturation and bone density.2-5 Previous studies have shown altered bone metabolism and decreased bone mineral content in children with celiac disease, which leads to poor bone mineral accretion and an increased risk of fracture.2-4,6-9 The mainstay for treatment of celiac disease is a strict gluten-free diet, which typically leads to a rapid clinical response of both the enteritis and low bone density.3,4,10-19 Despite the increased risk of low bone mineral density (BMD), the most recent research has not found an increased risk for fracture in this population.20 In addition, small sample sizes in existing data have not allowed for the development of evidence-based guidelines for appropriate screening and monitoring of BMD in pediatric patients with celiac disease.
Dual x-ray absorptiometry (DXA) is a widely used, noninvasive technique to assess bone health, but its use as a screening tool for low BMD in pediatric celiac disease is controversial. A recent survey of pediatric gastroenterology providers found that 63% of providers do not screen for low BMD in pediatric patients with celiac disease, citing a lack of evidence.21 The International Society for Clinical Densitometry states that there is no strong evidence for routine DXA scans at baseline or at follow-up evaluation for pediatric patients with celiac disease but qualifies its position by noting that additional research is needed.22 We sought to estimate the prevalence of low lumbar spine areal BMD (aBMD) in children with celiac disease as well as to understand risk factors for low aBMD in this population. We hypothesized that by using patient-level factors, we could accurately categorize patients into high or low risk for low BMD around the time of celiac disease diagnosis, with the ultimate goal of using the data to direct evidence-based guidelines for DXA screening in pediatric celiac disease.
Methods
Aims and Study Design
We conducted a retrospective cohort study of children ranging from 3 to 21 years old with celiac disease who underwent a DXA scan up to 1 year before 90 days after diagnosis between 2009 and 2016 at The Children’s Hospital of Philadelphia (Philadelphia, PA), a large, stand-alone, pediatric hospital with a Celiac Center caring for patients throughout Pennsylvania and the surrounding states. Our aims were to determine the prevalence of low lumbar spine aBMD in our cohort and to evaluate risk factors for low lumbar spine aBMD Z-score (aBMD-Z). Our study was reviewed and approved by the Children’s Hospital of Philadelphia Institutional Review Board.
Outcome
The primary outcome of interest was the lumbar spine aBMD-Z result on the initial DXA. Our secondary outcome of interest was the lumbar spine aBMD-Z on a repeat DXA. The prevalence of low lumbar spine aBMD-Z (aBMD-Z, < −2) was determined for each DXA (initial and repeat). The Pearson correlation between sequential DXA scans was calculated for subjects who underwent more than 1 DXA scan in the study period.
Inclusion Criteria
Subjects were included if they had at least 1 International Classification of Diseases, 9th revision (ICD-9) or 10th revision (ICD-10) code (579.0 or K90.0, respectively) for celiac disease and at least 1 DXA scan (Current Procedural Terminology code 77080) completed at the Children’s Hospital of Philadelphia up to 1 year before or 90 days after the date of first celiac diagnosis. Patients were excluded from the initial database if they had a diagnosis of Crohn disease (ICD-9 555.x or ICD-10 K50.0), ulcerative colitis (ICD-9 556.x or ICD-10 K51.0), or liver disease (ICD-9 571.x or ICD-10 K70-K77). To validate the use of ICD-9/10 codes and DXA scan history for a diagnosis of biopsy-proven celiac disease, 100 charts were selected at random, and duodenal biopsy pathology reports were reviewed by 2 pediatric gastroenterologists. Confirmation of celiac disease was defined by increased intraepithelial lymphocytes with crypt hyperplasia (Marsh II classification) or villous blunting/atrophy (Marsh III classification). Any disagreement in biopsy-proven diagnosis was adjudicated by a third expert reviewer. Inter-rater agreement and positive predictive value were determined for the selected 100 charts.
Assessment of Predictors
Data were abstracted from the electronic medical records for evaluation of lumbar spine aBMD-Z results and clinical covariates of interest, including age, sex, body mass index (BMI), and laboratory values (albumin, alkaline phosphatase, hemoglobin, calcium, vitamin D, phosphorous, and tissue-transglutaminase immunoglobulin A). Laboratory values were evaluated if obtained within 90 days (before or after) of a DXA scan.
Statistical Analysis
Data were inspected graphically using histograms and quantile–quantile plots for evidence of normality. Results are reported as means (SD) for normally distributed data or medians (interquartile range [IQR]) for non-normal distributions. The prevalence of low aBMD was determined for each DXA scan (initial or repeat). Logistic regression was used to determine the impact of potential risk factors on low aBMD. If multiple covariates had a P value less than 0.1 in univariable logistic regression, we planned to include them in a multivariable model. We used receiver operating characteristic (ROC) curve analysis to compare the discriminative ability of potential risk factors of interest for low BMD. Bootstrap estimation of area under the ROC curve (AUC) with 1000 repetitions was performed and the mean AUC with 95% CIs is reported. We determined the sensitivity, specificity, positive predictive value, and negative predictive value of significant risk factors. A type 1 error rate of α = 0.05 was found for all analyses. Analyses were performed using Stata 14 (StataCorp LP, College Station, TX).
Results
Cohort Characteristics
We identified 2400 patients who had a diagnosis of celiac disease based on an ICD code during the identified time range. Of those 2400 patients, 1193 patients had a DXA in the electronic medical record and 673 subjects (424 female; 63%) underwent at least 1 DXA scan within the study period. On further chart review, the patients who did not have DXA scan results reported in the electronic medical record typically had an incomplete order or had the scan performed at an outside institution. Age and gender distributions did not differ significantly between patients who did and did not complete a DXA scan (mean age, 9.8 vs 9.9 y; 58.4% vs 62.1% female, respectively; P > .05 for each comparison). However, baseline BMI Z-score (BMI-Z) at diagnosis was lower among patients who completed at least 1 DXA scan (−0.06 vs 0.10; P = .002) vs those who did not complete a DXA scan. The positive predictive value of our use of ICD-9 or ICD-10 codes for identifying biopsy-proven celiac disease was 97% on the subset of 100 reviewed charts and inter-rater agreement between reviewers of charts was high (k = 0.85).
The median number of scans per patient was 1 (IQR, 1-1). A total of 108 subjects (68 female; 63%) had at least 2 DXA scans, and 21 (12 female; 57%) had at least 3 scans during the follow-up period. The median age at celiac disease diagnosis was 10.6 years (IQR, 7.8–13.9 y). The median time between diagnosis and first DXA scan was 0 days (IQR, −11 to 31 d), but ranged from 364 days before diagnosis to 90 days after diagnosis. A total of 212 subjects had a DXA scan up to 1 year before the recorded celiac disease diagnosis, the majority of which occurred 2 to 6 weeks previously (IQR, 14–45 d). The mean BMI-Z was −0.06 ± 1.09 (n = 669) at initial DXA and did not differ between patients who had a DXA before vs up to 90 days after their diagnosis (mean difference, 0.004; P = 1.0) Because of a significant number of missing values, laboratory results were not included in multivariable logistic regression but are summarized in Table 1 and analyzed by univariable logistic regression (Table 2).
Table 1.
Subject Characteristics (n = 673)
| Subjects (n, % female) | 673 (424, 63%) |
| Subjects with 2 or more DXA (n, % female) | 108 (68, 63%) |
| Median number of DXA scans (IQR) | 1 (1–1) |
| Median age at celiac diagnosis, y (IQR) | 10.6 (7.8–13.9) |
| Mean BMI-Z at initial DXA (SD) (n = 669) | −0.06 (1.09) |
| Mean BMI-Z at second DXA (SD) (n = 106) | 0.005 (0.891) |
| Median time between diagnosis and first DXA, d (IQR) | 0 (−11 to 31) |
| Median time between first and second DXA, y (IQR) | 2.3 (1.3–3.5) |
| Within 90 days of DXA 1 |
Within 90 days of DXA 2 |
|||||
|---|---|---|---|---|---|---|
| Laboratory values | n | Means | SD | n | Means | SD |
| 25-OH vitamin D, ng/mL | 559 | 37.9 | 12.0 | 98 | 40.6 | 13.0 |
| Albumin, g/dL | 505 | 4.5 | 0.4 | 97 | 4.6 | 0.3 |
| Calcium, mg/dL | 507 | 9.7 | 0.4 | 98 | 9.8 | 0.4 |
| Phosphorous, mg/dL | 43 | 4.7 | 0.7 | 7 | 5.0 | 0.9 |
| Alkaline phosphatase, U/L | 505 | 201.5 | 117.2 | 97 | 227.5 | 98.2 |
| Hemoglobin, g/dL | 516 | 13.3 | 1.1 | 99 | 13.4 | 1.0 |
| Tissue transglutaminase IgA, U | 460 | 112.6 | 57.3 | 53 | 42.8 | 52.9 |
| Tissue transglutaminase IgA, U/mL | 329 | 25.0 | 35.0 | 63 | 7.2 | 19.5 |
Table 2.
Univariable Logistic Regression for Low aBMD-Z (<−2) at First and Second DXA Scans
| First DXA (n = 673) |
Second DXA (n = 108) |
|||||
|---|---|---|---|---|---|---|
| n | Unadjusted OR (95% CI) | P value | n | Unadjusted OR (95% CI) | P value | |
| Male (reference: female) | 673 | 0.90 (0.48–1.69) | .75 | 108 | 1.15 (0.30–4.34) | .8 |
| Age, y | 673 | 1.02 (0.94–1.10) | .67 | 108 | 1.15 (0.95–1.39) | .2 |
| BMI-Z at first DXA | 669 | 0.46 (0.35–0.60) | <.001a | 108 | 0.83 (0.44–1.56) | .6 |
| BMI-Z at second DXA | 106 | 0.85 (0.39–1.85) | .7 | |||
| Time from diagnosis (or prior DXA), d | 673 | 1.00 (0.99–1.00) | .7 | 108 | 1.00 (1.00–1.00) | .4 |
| Vitamin D, ng/mL | 559 | 1.02 (1.00–1.05) | .1 | 97 | 1.00 (0.96–1.06) | .9 |
| Albumin, g/dL | 505 | 0.70 (0.30–1.63) | .4 | 96 | 9.14 (0.54–153.9) | .1 |
| Alkaline phosphatase, U/L | 505 | 1.00 (1.00–1.00) | .2 | 96 | 1.00 (1.00–1.01) | .3 |
| Hemoglobin, g/dL | 516 | 1.10 (0.79–1.54) | .6 | 98 | 1.05 (0.53–2.08) | .9 |
| Calcium, mg/dL | 507 | 1.14 (0.46–2.78) | .8 | 97 | 1.99 (0.27–14.8) | .5 |
| Phosphorus, mg/dL | 43 | 0.87 (0.30–2.49) | .8 | 7 | 1.62 (0.22–11.7) | .6 |
| tTG, U | 460 | 1.01 (1.00–1.02) | .06 | 52 | 1.01 (1.00–1.03) | .1 |
| tTG IgA, U/mL | 329 | 0.98 (0.96–1.00) | .1 | 62 | 1.02 (0.99–1.05) | .2 |
| Baseline aBMD-Z | – | – | – | 108 | 0.22 (0.11–0.50) | <.001a |
tTG, tissue transglutaminase.
P < .05.
Areal Lumbar Spine Bone Mineral Density Z-Score on Initial and Follow-Up Dual X-Ray Absorptiometry Scan
The mean aBMD-Z on initial scan was −0.4 ± 1.2. Forty-six subjects (6.8%; 95% CI, 5.2%–9.0%) had a low aBMD-Z (< − 2.0) on initial scan. The proportion of subjects with DXA before vs after their celiac disease diagnosis (and presumably gluten-free diet) was not different between subjects with a low vs normal aBMD-Z on initial DXA (69.6% vs 68.4%; P = .9 by the χ2 test). Subjects were significantly more likely to undergo a repeat DXA if the initial aBMD-Z was low (odds ratio [OR], 3.8; 95% CI, 2.0–7.1; P < .001 on univariable logistic regression for repeat DXA). The median time between the first and second scans was 2.3 years (IQR, 1.3–3.5 y), but patients with a low aBMD-Z on initial DXA had a shorter interval to repeat DXA (1.6 vs 2.8 y; P = .001 by Student t test). Initial and repeat aBMD-Z were highly correlated (r = 0.8; P < .001). Of those who underwent a second scan, the aBMD-Z improved significantly (mean aBMD-Z, −0.98; SD, 1.40; vs −0.69; SD, 1.22; P = .0005, mean change, 0.29 by paired t test). Of those with a low aBMD-Z on first scan, the aBMD-Z remained low in 38.9% (7 of 18). Of those with a normal aBMD-Z (>−2) on first scan, 96.7% (87 of 90) remained normal on repeat (Figure 1). Two of the 3 subjects who worsened from normal to low BMD on repeat DXA had an initially borderline-low aBMD-Z score (−1.8 and −1.9).
Figure 1.
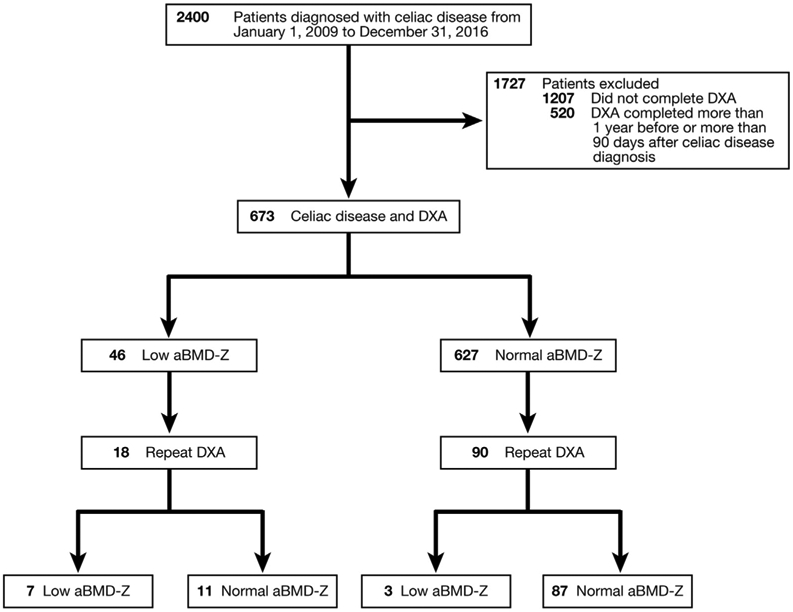
Initial and repeat DXA scan results, stratified by normal or low aBMD-Z.
Risk Factors for Low Lumbar Areal Bone Mineral Density Z-Score on Initial and Repeat Scan
In univariable logistic regression for low aBMD-Z on first scan, only BMI-Z (OR, 0.46; 0.35–0.60) was associated significantly with aBMD-Z. Age and sex were not associated significantly with a low aBMD-Z (P > .05 for each). Because BMI-Z was the only significant risk factor in univariable analysis, multivariable logistic regression was not performed. As assessed by ROC curve analysis, risk discrimination by BMI-Z alone was good (AUC, 0.71; 95% CI, 0.63–0.79). Figure 2 shows the difference in BMI-Z distribution between normal and low aBMD-Z groups. A threshold of BMI-Z less than −0.4 had a sensitivity of 53.0%, a specificity of 66.1%, a positive predictive value of 11.0%, and a negative predictive value of 95.4% for detecting low aBMD-Z on initial DXA. Notably, by using this BMI-Z threshold, the prevalence of low aBMD-Z in the high-risk group with BMI-Z less than −0.4 was 11.3%, which was significantly greater than in subjects with a BMI-Z above this threshold (4.5%; P < .0001).
Figure 2.

BMI-Z by lumbar spine aBMD status (normal vs low, Z < −2) at initial DXA. P < .0001 by t test.
In univariable regression, the only factor associated with a lower odds of a low aBMD-Z on second DXA was a higher baseline aBMD-Z (OR, 0.23; 95% CI, 0.11–0.50). A low aBMD-Z on the second DXA was not associated with BMI-Z at initial or follow-up DXA, age, sex, time between DXA scans, or time from diagnosis. Of note, BMI-Z at the time of the second DXA was missing for 2 subjects, limiting the analysis to 106 from 108.
Discussion
In this large retrospective cohort of children with recently diagnosed celiac disease, we found that approximately 7% of patients had a low lumbar spine aBMD, nearly 3 times higher than would be expected in a healthy sample of children. In our study we found that decreased BMI-Z was associated with a lower aBMD-Z on initial scan. This finding likely was reflective of the fact that BMI-Z is an indicator of overall nutritional status. In addition, the positive association of BMI-Z and aBMD-Z is observed commonly in healthy children, likely owing to the response of the skeleton to bearing greater weight.23
In our study, the subjects who had a repeat scan showed significant improvement in aBMD-Z score from the first to second scan. Nevertheless, among those who had a repeat scan and a low aBMD-Z on first scan, aBMD-Z remained low in 38.9% at the time of the second scan. In addition, almost all of the subjects who had a normal aBMD-Z on the first DXA scan had a normal aBDM-Z on repeat scan, suggesting low clinical utility of repeating DXA scans if the first scan was normal. It is important to recognize the improvement in aBMD with time, assumed to be secondary to adherence to a gluten-free diet, and direct focus on early diagnosis to optimize growth and development in children with celiac disease.3,4,14,17
Our study had several strengths, including a large reported sample of pediatric patients with celiac disease who underwent a DXA scan. Also, as a large, regional, tertiary-care center, patients from a variety of ethnicities, socioeconomic classes, and urban as well as rural backgrounds are cared for, increasing the generalizability of our findings. Finally, we show the potential to use BMI-Z alone as an indicator of the likelihood of a normal aBMD-Z, with a very high negative predictive value using a threshold of BMI-Z less than −0.4. This simple classification method may allow for rapid risk stratification of patients at celiac disease diagnosis for DXA screening.
We acknowledge several limitations of our study, including its retrospective nature and the inability to correlate results with clinical factors and adherence to a gluten-free diet. There was a large amount of missing data for laboratory results, limiting our ability to use laboratory values in our risk stratification. In addition, the subjects who did complete at least 1 DXA scan had a lower baseline BMI, which may have lead to overestimation of the calculated prevalence. Future longitudinal prospective studies of unselected cohorts of children including food diaries and laboratory values could provide unbiased estimates of prevalence as well as identify patients at risk for low aBMD and determine predictive variables for patients who have persistent low BMD despite appropriate dietary modifications.
In conclusion, our findings show that pediatric patients with celiac disease have a high prevalence of low aBMD-Z around the time of diagnosis and that prevalence among those with BMI-Z less than −0.4 exceeds 10%, nearly triple the prevalence among those with BMI-Z above this threshold. Based on these findings, simple risk stratification is possible using BMI-Z alone. In addition, those with normal DXA scan at diagnosis are unlikely to have subsequent low aBMD-Z after diagnosis, likely related to compliance with a gluten-free diet. Appropriate screening for aBMD-Z in celiac disease remains controversial, largely owing to the limited evidence to support recommendations in the pediatric population. If replicated in a separate population, our findings could help to simplify decision making and reduce variability and potential overuse of DXA scans in pediatric patients with celiac disease who are at especially low risk for low aBMD-Z.
What You Need to Know.
Background
Celiac disease is a common cause of malabsorption in children, sometimes resulting in low bone mineral density (BMD). The prevalence of and risk factors for low BMD among children with celiac disease are unknown.
Findings
In a large cohort of children with celiac disease, 7% had low BMD at diagnosis. Low body mass index was the only significant risk factor identified. Children with normal BMD at diagnosis were unlikely to have low BMD on repeat testing.
Implications for patient care
Simple risk stratification of pediatric patients with celiac disease may be possible using body mass index alone. There is low clinical utility in repeating testing for BMD if normal at diagnosis.
Acknowledgments
Funding
Supported by the National Institute of Diabetes and Digestive and Kidney Diseases grants T32 DK07314 and 5K12 DK94723-7 (M.E.V.) and 5R01HD076321-05 (B.Z.).
Abbreviations used in this paper:
- aBMD
areal bone mineral density
- aBMD-Z
areal bone mineral density Z-score
- AUC
area under the receiver operating characteristic curve
- BMD
bone mineral density
- BMI
body mass index
- BMI-Z
body mass index Z-score
- DXA
dual x-ray absorptiometry scan
- ICD
International Classification of Diseases
- IQR
interquartile range
- OR
odds ratio
- ROC
receiver operating characteristic
Footnotes
Conflicts of interest
The authors disclose no conflicts.
References
- 1.Fasano A, Catassi A. Current approaches to diagnosis and treatment of celiac disease: an evolving spectrum. Gastroenterology 2001;120:636–651. [DOI] [PubMed] [Google Scholar]
- 2.Jatla M, Zemel B, Bierly P, et al. Bone mineral content deficits of the spine and whole body in children at time of diagnosis with celiac disease. J Pediatr Gastroenterol Nutr 2009;48:175–180. [DOI] [PubMed] [Google Scholar]
- 3.Barera G, Beccio S, Proverbio CM, et al. Longitudinal changes in bone metabolism and bone mineral content in children with celiac disease during consumption of a gluten-free diet. Am J Clin Nutr 2004;79:148–154. [DOI] [PubMed] [Google Scholar]
- 4.Mora S Celiac disease in children: impact on bone health. Rev Endocr Metab Disord 2008;9:123–130. [DOI] [PubMed] [Google Scholar]
- 5.Krupa-Kozak U Pathologic bone alterations in celiac disease: etiology, epidemiology, and treatment. Nutrition 2014;30:16–24. [DOI] [PubMed] [Google Scholar]
- 6.Margoni D, Chouliaras G, Duscas G, et al. Bone health in children with celiac disease assessed by dual x-ray absorptiometry: effect of gluten-free diet and predictive value of serum biochemical indices. Gastroenterology 2012;54:680–684. [DOI] [PubMed] [Google Scholar]
- 7.West J, Logan R, Card T, et al. Fracture risk in people with celiac disease: a population-based cohort study. Gastroenterology 2003;124:429–436. [DOI] [PubMed] [Google Scholar]
- 8.Olmos M, Antelo M, Vazquez H, et al. Systematic review and meta-analysis of observational studies on the prevalence of fractures in coeliac disease. Dig Liver Dis 2008;40:46–53. [DOI] [PubMed] [Google Scholar]
- 9.Gemme G, Vignolo M, Naselli A, et al. Linear growth and skeletal maturation in subjects with treated celiac disease. J Pediatr Gastroenterol Nutr 1999;29:339–342. [DOI] [PubMed] [Google Scholar]
- 10.Green P, Cellier C. Celiac disease. N Engl J Med 2007; 357:1731–1743. [DOI] [PubMed] [Google Scholar]
- 11.Bardella MT, Velio P, Cesana BM, et al. Coeliac disease: a histological follow-up study. Histopathology 2007;50:465–471. [DOI] [PubMed] [Google Scholar]
- 12.Lee SK, Lo W, Rotterdam H, et al. Duodenal histology in patients with celiac disease after treatment with a gluten-free diet. Gastrointest Endosc 2003;57:187–191. [DOI] [PubMed] [Google Scholar]
- 13.Tau C, Mautalen C, De Rosa S, et al. Bone mineral density in children with celiac disease. Effect of a gluten-free diet. Eur J Clin Nutr 2006;60:358–363. [DOI] [PubMed] [Google Scholar]
- 14.Heyman R, Guggenbuhl P, Corbel A, et al. Effect of a gluten-free diet on bone mineral density in children with celiac disease. Gastroenterol Clin Biol 2009;33:109–114. [DOI] [PubMed] [Google Scholar]
- 15.Kalayci Gazi A, Kansu A, Girgin N, et al. Bone mineral density and importance of a gluten-free diet in patients with celiac disease in childhood. Pediatrics 2001;108:1–5. [DOI] [PubMed] [Google Scholar]
- 16.Kavak U, Yuce A, Kocak N, et al. Bone mineral density in children with untreated and treated celiac disease. J Pediatr Gastroenterol Nutr 2003;37:434–436. [DOI] [PubMed] [Google Scholar]
- 17.Blazina S, Bratanic N, Sirca Campa A, et al. Bone mineral density and importance of strict gluten-free diet in children and adolescents with celiac disease. Bone 2010;47: 598–603. [DOI] [PubMed] [Google Scholar]
- 18.Turner J, Pellerin G, Mager D. Prevalence of metabolic bone disease in children with celiac disease is independent of symptoms at diagnosis. J Pediatr Gastroenterol Nutr 2009; 49:589–593. [DOI] [PubMed] [Google Scholar]
- 19.Mager D, Qiao J, Turner J. Vitamin D and K status influences bone mineral density and bone accrual in children and adolescents with celiac disease. Eur J Clin Nutr 2012;66:488–495. [DOI] [PubMed] [Google Scholar]
- 20.Canova C, Pitter G, Zanier L, et al. Risk of fractures in youths with celiac disease-a population-based study. J Pediatr 2018; 198:117–120. [DOI] [PubMed] [Google Scholar]
- 21.Webster J SK, Shea J, et al. Understanding the variation in use of screening DXA scans in pediatric patients with celiac disease. Int J Celiac Dis 2017;5:155–158. [Google Scholar]
- 22.Bianchi ML, Leonard MB, Bechtold S, et al. Bone health in children and adolescents with chronic diseases that may affect the skeleton: the 2013 ISCD Pediatric Official Positions. J Clin Densitom 2014;17:281–294. [DOI] [PubMed] [Google Scholar]
- 23.Zemel B Bone mineral accretion and its relationship to growth, sexual maturation and body composition during childhood and adolescence. World Rev Nutr Diet 2013;106:39–45. [DOI] [PubMed] [Google Scholar]