

ABSTRACT
Background
Many studies have identified early-life risk factors for childhood overweight/obesity (OwOb), but few have evaluated how they combine to influence later cardiometabolic health.
Objectives
We aimed to examine the association of risk factors in the first 1000 d with adiposity and cardiometabolic risk in early adolescence.
Methods
We studied 1038 mother–child pairs in Project Viva. We chose 6 modifiable early-life risk factors previously associated with child adiposity or metabolic health in the cohort: smoking during pregnancy (yes compared with no); gestational weight gain (excessive compared with nonexcessive); sugar-sweetened beverage consumption during pregnancy (≥0.5 compared with <0.5 servings/d); breastfeeding duration (<12 compared with ≥12 mo); timing of complementary food introduction (<4 compared with ≥4 mo); and infant sleep duration (<12 compared with ≥12 h/d). We computed risk factor scores by calculating the cumulative number of risk factors for each child. In early adolescence (median: 13.1 y) we measured indicators of adiposity [BMI, fat mass index (FMI), trunk fat mass index (TFMI)]. We also calculated OwOb prevalence and metabolic syndrome (MetS) risk z score of adolescents.
Results
Among 1038 adolescents, 71% had >1 early-life risk factor. In covariate-adjusted models, we observed positive monotonic increases in BMI, FMI, TFMI, and MetS z scores with increasing risk factor score. Children with 5‒6 risk factors (compared with 0–1 risk factors) had the highest risk of OwOb [risk ratio (RR): 2.53; 95% CI: 1.63, 3.91] and being in the highest MetS quartile (RR: 2.46; 95% CI: 1.43, 4.21). The predicted probability of OwOb in adolescence varied from 9.4% (favorable levels for all factors) to 63.6% (adverse levels for all factors), and for being in the highest MetS quartile from 9.6% to 56.6%.
Conclusions
Early-life risk factors in the first 1000 d cumulatively predicted higher adiposity and cardiometabolic risk in early adolescence. Intervention strategies to prevent later obesity and cardiometabolic risk may be more effective if they concurrently target multiple modifiable factors.
Keywords: metabolic risk, obesity, body composition, early-life risk factors, adolescence
Introduction
The rapid rise in the global prevalence of childhood obesity, a strong predictor of metabolic syndrome (MetS) and related diseases such as type 2 diabetes mellitus (1–3), remains a public health challenge. The first 1000 d of life, spanning from conception to age 24 mo, represents an important period of risk of the development of later childhood obesity (4–8). Certain prenatal and postpartum factors, such as maternal smoking, excessive gestational weight gain (GWG), maternal gestational diabetes mellitus (GDM), maternal diet during pregnancy, short breastfeeding duration, and short infant sleep duration (9–17), are associated with subsequent risk of childhood obesity. Most of these factors are modifiable and, thus, may provide insight into intervention strategies for childhood obesity prevention in early life. Existing studies typically assess these risk factors individually, rather than in combination, the latter of which is more pertinent to real-life behavioral patterns and, thus, has potential to translate to a larger public health impact (10). Further, previous studies assessing these individual risk factor associations often adjust for other risk factors and, at times, do so inappropriately (14, 18). Such an approach might not only introduce bias in the association estimates, it may also over-adjust for meaningful variation because some risk factors [e.g., excessive GWG and sugar-sweetened beverage (SSB) intake] share biological pathways (12).
To better understand their potential public health impact, prior studies have evaluated such risk factors in combination. Gillman and Ludwig (4) and Gillman et al. (19) previously reported that children exposed to a combination of 4 modifiable risk factors had higher obesity prevalence in early (3–4 y) and mid-childhood (7–10 y) than children not exposed to these risk factors. Findings from other studies (20, 21) have similarly reported that several early-life exposures may have a combined influence on weight status in early childhood. To our knowledge, no study has assessed the combined influence of early-life exposures on adiposity in adolescence, which is a crucial time window for programming of later adiposity and lifelong cardiovascular disease development (22). In addition, we are not aware of prior studies that have examined associations between exposure to a combination of early-life risk factors and direct measures of cardiometabolic risk, which is a stronger predictor of later cardiovascular disease development than BMI (23).
To address these gaps, we aimed to examine the associations of 6 early-life risk factors with weight status and MetS risk in early adolescence. We chose factors encompassing the period of the first 1000 d that are likely to be modifiable and have been demonstrated to be independently associated with adiposity or cardiometabolic health in our cohort and in other studies (12, 24–30). These 6 factors include maternal prenatal smoking status, GWG, consumption of SSBs during pregnancy, breastfeeding duration, timing of complementary food introduction, and infant sleep duration. We hypothesized a positive and graded (i.e., dose–response) association between an increasing risk factor score (calculated as the cumulative number of risk factors for each individual) and early-adolescence overweight/obesity, adiposity, and metabolic risk.
Methods
Study population
The subjects for this study were participants in Project Viva, a prospective, observational cohort study of gestational factors, pregnancy outcomes, and offspring health. The study design has previously been described in detail (31). Briefly, we recruited women attending their initial prenatal visit between April 1999 and November 2002 from obstetric practices at Atrius Harvard Vanguard Medical Associates in eastern Massachusetts. Eligibility criteria included fluency in English, gestational age <22 wk at the initial prenatal clinical appointment, and singleton pregnancy. Of the 2128 liveborn singleton infants, we included in the current analysis 1038 children with ≥1 adiposity or cardiometabolic outcome measured at the early adolescent visit (Figure 1). The Institutional Review Boards of the participating institutions approved the study, and all procedures were in accordance with the ethical standards of the institutional research committee. All women provided written informed consent for themselves and on behalf of their children. Children also provided written assent at the early adolescent visit.
FIGURE 1.
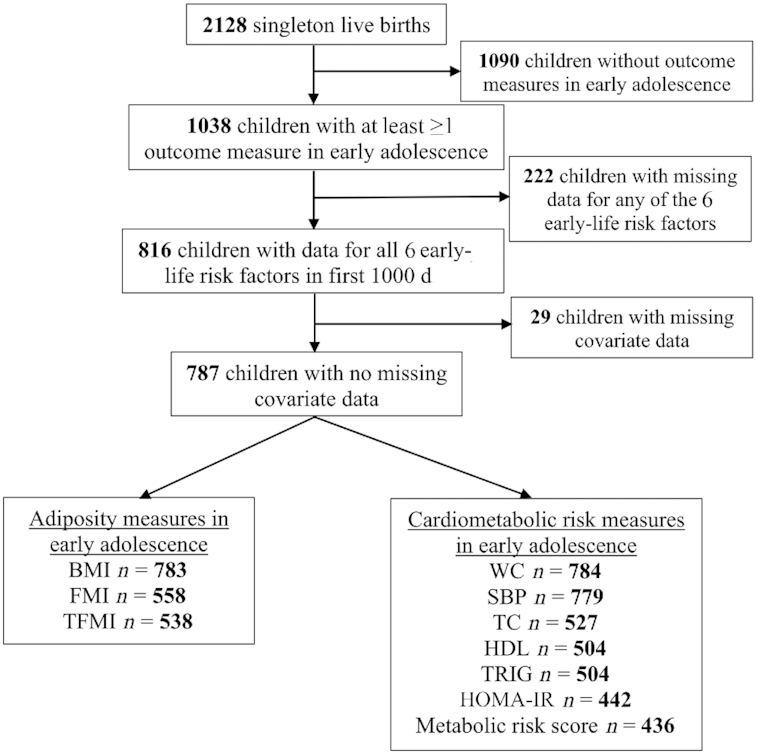
Flowchart of study. FMI, fat mass index; OwOb, overweight/obesity; SBP, systolic blood pressure; TC, total cholesterol; TFMI, trunk fat mass index; TRIG, triglyceride; WC, waist circumference.
Exposures
In this study, we selected 6 potentially modifiable risk factors during the prenatal period and in infancy. We chose these risk factors based on previous studies in our cohort (12, 23–30), as well as prior systematic reviews and meta-analyses that have shown positive associations between each of the risk factors and child adiposity or cardiometabolic outcomes (14, 17, 18, 32–40). We converted each risk factor into a binary variable using reference cutoff values reported in previous literature (12, 24–31).
Smoking during or before pregnancy
At the recruitment visit, mothers reported their cigarette smoking status before and during pregnancy (never smoker, former smoker, or smoked during pregnancy). We categorized smoking status as smoked during pregnancy and never/former smoker.
GWG
Mothers self-reported their prepregnancy weight at the recruitment visit. We collected mothers’ weight measures during pregnancy from the medical records at all prenatal visits. We calculated total GWG by subtracting prepregnancy weight from the last prenatal weight before delivery. We defined excessive GWG based on the 2009 recommendations of the Institute of Medicine (41). We categorized GWG status as excessive and nonexcessive GWG.
SSB consumption during pregnancy
We used semiquantitative FFQs to collect data on mothers’ SSB consumption during pregnancy. Mothers completed FFQs during both their first trimester (mean ± SD: 11.9 ± 3.5 weeks of gestation) and second trimester (29.2 ± 2.6 weeks of gestation). The FFQs were slightly modified for use during pregnancy from a validated FFQ used in cohorts of adults (42). Participants endorsed categories of frequency of beverage consumption, including “never/less than 1 per month,” “once per week,” “2–4 times per week,” “nearly daily or daily,” and a maximum of “2 or more glasses per day” for some fruit drinks and “4 or more cans per day” for soda. The recall time frame for the first-trimester FFQ was “during this pregnancy,” that is, from the woman's last menstrual period until she completed the FFQ. For the second-trimester FFQ, the time referent was the previous 3 mo. We defined sweetened beverages as fruit drinks (1 type) and soda (3 types). We averaged the 4 kinds of sweetened beverages from both FFQs and calculated the number of servings of beverages per day for each mother (12). Finally, we categorized SSB consumption into high (≥0.5 servings/d) and low (<0.5 servings/d) consumption. We chose this cutoff based on preliminary analyses that showed significantly higher BMI z scores among adolescents whose mothers consumed ≥0.5 servings/d of SSBs (compared with <0.5 servings/d).
Breastfeeding duration
At 6, 12, and 24 mo after delivery, we asked mothers whether they were still breastfeeding and the age at cessation. We categorized breastfeeding duration as any breastfeeding <12 mo or ≥12 mo, based on the recommendation of the American Academy of Pediatrics (43).
Timing of complementary feeding introduction
Six months after delivery, mothers completed a validated questionnaire (44) querying the timing of the first introduction of 13 different foods or food groups, including infant cereal, other starches (e.g., teething biscuits), fruit, vegetables, meat, chicken or turkey, peanut butter, other cow milk dairy products (e.g., cheese), eggs, fish, sweets, cow milk or soy milk (not formula), and fruit juice. Each question had 5 categorical response options: “Have not fed this to my child,” “<2 months old,” “2 or 3 months old,” “4 or 5 months old,” or “6 months or older.” We defined the timing of the introduction of complementary foods as the child's age at the earliest introduction of any complementary food, divided into 2 age categories: <4 mo or ≥4 mo (28, 30).
Infant sleep duration
Mothers reported the average amount of daily sleep their children obtained over the past month at 6 and 12 mo postpartum. The sleep duration included morning and afternoon naps in addition to nighttime sleep. We used the mean of 6-mo and 12-mo sleep duration among participants with data at both time points; for participants missing 1 time point value, we used the nonmissing value to represent the mean. In this analysis, we categorized daily sleep duration as <12 h or ≥12 h (19).
Outcome measures
Adiposity measurements
During the early-adolescence visit (mean ± SD: 13.2 ± 0.9 y), we measured weight (TBF-300A scale, Tanita) and standing height (calibrated stadiometer; Shorr Productions) to calculate BMI, and derived age- and sex-specific BMI z scores based on the CDC reference data (45). We defined overweight/obesity (OwOb) as BMI z scores ≥ 85th percentile for age and sex. Research assistants administered whole-body DXA scans with the Hologic model Discovery A (Hologic). We used Hologic software version 12.6 for scan analysis. A single trained research assistant checked all scans for positioning, movement, and artifacts, and defined regions of total and trunk fat mass for analysis. Intrarater reliability was high (r = 0.99) (46). We calculated total fat mass index (FMI) as fat mass (kg) divided by height (m). We also calculated trunk fat mass index (TFMI). We derived age- and sex-specific internal z scores of FMI and TFMI, with age floored per 0.5 y.
Metabolic health measures
At the early-adolescence visit, we measured plasma glucose enzymatically and assayed insulin using an electrochemiluminescence immunoassay (Roche Diagnostics). Using these values, we estimated insulin resistance using the HOMA-IR [(glucose mg/dL × insulin mIU/mL)/405]. We derived age- and sex-specific z scores for HOMA-IR based on NHANES 1999–2002 data (47). We measured serum total cholesterol, triglycerides, and HDL enzymatically with correction for endogenous glycerol. We derived age- and sex-specific z scores for triglycerides and HDL cholesterol (48). We measured systolic blood pressure (SBP) using biannually calibrated automated oscillometer monitors (Dinamap Pro100) on the child's upper arm ≤5 times at 1-min intervals. We used the mean of the 5 measurements for the statistical analysis and focused this analysis on SBP rather than diastolic blood pressure because it was measured more accurately with our automated instrument (29, 49). We measured children's waist circumference using a Hoechstmass nonstretchable measuring tape (Hoechstmass Balzer GmbH). We derived age-, sex-, and height-specific SBP z scores based on reference data of the American Academy of Pediatrics (50). We derived a global metabolic risk score as the mean of external z scores for waist circumference, SBP, HDL cholesterol (scaled inversely), HOMA-IR, and triglycerides (51). Higher scores indicate greater metabolic risk.
Other measures
We assessed potential covariates using interviewer-administered questionnaires, including maternal age at enrollment (y), prepregnancy BMI (in kg/m2), maternal education (college graduate or less than a college graduate), median neighborhood household income based on home address at birth (in US dollars), parity (nulliparous or multiparous), and paternal BMI reported by the mother at enrollment. We calculated gestational age by subtracting the date of the last menstrual period from the date of delivery. However, we used the ultrasound result to determine gestational duration if gestational age according to the second-trimester ultrasound scan differed from that according to the last menstrual period by >10 d. At the 3-y visit, we asked mothers, “Which of the following best describes your child's race or ethnicity?” Mothers had a choice of ≥1 of the following racial/ethnic groups: Hispanic or Latina, white or Caucasian, black or African American, Asian or Pacific Islander, American Indian or Alaskan Native, and Other (please specify). Because of the small sample size, we combined children whose race/ethnicity was Asian, American Indian, Other, or >1 race/ethnicity into a single category (52). We extracted child sex from delivery medical records and reconfirmed it at subsequent research visits. At the mid-childhood visit (median age: 7.7 y), we assessed child's weight and height and derived age- and sex-specific BMI z scores based on CDC data (45). Mothers reported the amount of time their children had spent on light or moderate recreational activities in the past month, which we used to calculate children's physical activity level (h/d). Mothers also reported their child's SSB intake using a semiquantitative FFQ. We averaged 2 kinds of sweetened beverages (fruit drinks and soda) from the FFQ and calculated the number of servings of beverages per day for each child. We also evaluated pubertal development at the early-adolescence visit via a validated written pubertal development scale (PDS) filled out by parents. PDS questions for boys included 4 items: voice deepening, facial and body hair growth, acne, and growth spurt. PDS questions for girls included 5 items: breast development, body hair growth, acne, growth spurt, and menarche. The response options for each item (except for menarche) were “not yet started” (1 point), “barely started” (2 points), “definitely started” (3 points), “seems complete” (4 points), and “I don't know” (coded as missing). A “yes” answer on the menarche question received 4 points and a “no” answer received 1 point. We derived a pubertal score for each participant by summing the point values and averaging across all items (53, 54).
Statistical analysis
We computed risk factor scores by calculating the cumulative number of risk factors for each individual. We modeled each of the 6 risk factors in dichotomous form, which limited the estimated probabilities to 64 combinations of the 6 risk factors. We included all 64 risk factor combinations in the analysis and present results of the 31 combinations for which prevalence was ≥0.5% in our cohort. We used adiposity and metabolic risk markers in early adolescence as our primary outcomes, and OwOb and being in the highest quartile of MetS as our secondary outcomes. We fitted linear regression models with risk factor scores as a categorical predictor using children with 0–1 factors as the referent. To assess the effect of the trend in risk factor score, we fitted the same models with risk factor as a continuous variable. We used modified Poisson regression models (20, 55) with robust variance to estimate the relative risk of child OwOb or being in the highest quartile of MetS for each category of risk factors (2, 3, 4, or 5–6 compared with 0–1 risk factors). We used logistic regression models to estimate probabilities of child OwOb or being in the highest quartile of MetS for different risk factor combinations (20).
We adjusted all models for sociodemographic characteristics including maternal age, parity, education level, median neighborhood household income, and child race/ethnicity. We further adjusted for maternal prepregnancy and paternal BMI because they partially represent children's genetic and social obesity risks. We consider these factors nonmodifiable and thus include them as covariates rather than predictors because they are either demographic characteristics or fixed before pregnancy. To examine whether these associations could be explained by differences in gestational age, earlier child weight, lifestyle behaviors, or pubertal status, we further adjusted our analyses for gestational age, child BMI z score, physical activity level, and SSB intake in mid-childhood, and pubertal development score. We also investigated effect modification by child sex by adding multiplicative interaction terms with risk factor scores and performed sex-stratified analysis.
We used chained equation multiple imputation to impute values for children with missing data. We generated 20 imputed data sets for all 2128 Project Viva live births. The imputation model included all exposures, outcomes, and covariates under study. In final analytical models after imputation, we combined the imputed data sets using MI ESTIMATE in Stata, after excluding 1090 subjects who did not satisfy the inclusion criteria for this study, that is, children without any outcome measurements in early adolescence. We repeated all analyses in subjects without any missing exposure, covariate, or outcome data (n = 787) (Figure 1) to assess the robustness of our study findings. We performed all analyses using Stata 13 software (StataCorp LP). We set the statistical significance level at α = 0.05.
Results
Among 1038 children included in this study, half were female (49%) and the majority were white (71%). Children included in the study (compared with the n = 1090 excluded) had mothers who were older, who had higher education, higher household income, and lower prepregnancy BMI, and were more likely to be of white ethnicity and higher birth weight (Supplemental Table 1). Children exposed to 5–6 risk factors (compared with 0–1 risk factors) had mothers who were younger, who had lower education, higher prepregnancy BMI, and lower household income, had fathers with higher BMI, and had higher BMI z scores and higher SSB intake at mid-childhood (Table 1).
TABLE 1.
Characteristics of participants in Project Viva according to number of risk factors across the first 1000 d (n = 787)1
| Risk factors across the first 1000 d, n | ||||||
|---|---|---|---|---|---|---|
| Characteristic | 0 or 1 (n = 227, 28.8%) | 2 (n = 249, 31.6%) | 3 (n = 198, 25.2%) | 4 (n = 89, 11.3%) | 5 or 6 (n = 24, 3.1%) | P value |
| Mothers | ||||||
| Age, y | 34.1 ± 4.2 | 33.0 ± 4.3 | 32.3 ± 4.5 | 31.0 ± 5.1 | 29.4 ± 5.4 | <0.001 |
| Prepregnancy BMI, kg/m2 | 23.0 ± 4.4 | 24.7 ± 4.6 | 25.4 ± 5.3 | 25.2 ± 5.4 | 27.5 ± 5.8 | <0.001 |
| College graduate or higher | 201 (88.6) | 194 (77.9) | 150 (75.8) | 51 (57.3) | 10 (41.7) | <0.001 |
| Median neighborhood household income, $ | 61,023 ± 21,511 | 60,943 ± 21,516 | 59,027 ± 19,882 | 52,015 ± 18,698 | 48,667 ± 17,018 | <0.001 |
| Nulliparous | 109 (48.0) | 111 (44.6) | 97 (49.0) | 51 (57.3) | 15 (62.5) | 0.18 |
| Father's BMI at enrollment, kg/m2 | 25.6 ± 3.8 | 26.5 ± 3.7 | 26.8 ± 4.1 | 27.2 ± 4.1 | 27.4 ± 4.6 | 0.002 |
| Children | ||||||
| Female sex | 116 (51.1) | 127 (51.0) | 94 (47.5) | 38 (42.7) | 11 (45.8) | 0.65 |
| Race/ethnicity | <0.001 | |||||
| White | 173 (76.2) | 187 (75.1) | 138 (69.7) | 46 (51.7) | 14 (58.3) | |
| Black | 13 (5.7) | 18 (7.2) | 26 (13.1) | 23 (25.8) | 5 (20.8) | |
| Hispanic | 4 (1.8) | 8 (3.2) | 8 (4.0) | 7 (7.9) | 1 (4.2) | |
| Asian/other/>1 race | 37 (16.3) | 36 (14.5) | 26 (13.1) | 13 (14.6) | 4 (16.7) | |
| Gestational age, wk | 39.5 ± 1.9 | 39.7 ± 1.6 | 39.6 ± 1.5 | 39.6 ± 1.9 | 39.5 ± 1.8 | 0.92 |
| Birth weight, g | 3437 ± 598 | 3559 ± 489 | 3547 ± 547 | 3421 ± 594 | 3519 ± 507 | 0.06 |
| BMI z score in mid-childhood | 0.03 ± 0.83 | 0.31 ± 0.98 | 0.51 ± 0.93 | 0.69 ± 1.05 | 1.24 ± 0.95 | <0.001 |
| Physical activity in mid-childhood, h/d | 1.69 ± 1.04 | 1.72 ± 1.08 | 1.90 ± 1.54 | 1.76 ± 1.18 | 2.14 ± 1.52 | 0.27 |
| SSB intake in mid-childhood, servings/d | 0.18 ± 0.28 | 0.29 ± 0.59 | 0.47 ± 0.81 | 0.41 ± 0.57 | 0.66 ± 0.86 | <0.001 |
| Age at early-adolescence visit, y | 13.2 ± 0.9 | 13.1 ± 0.9 | 13.2 ± 0.9 | 13.2 ± 0.9 | 13.1 ± 1.0 | 0.91 |
| Pubertal development score at early-adolescence visit | 2.42 ± 0.76 | 2.48 ± 0.79 | 2.55 ± 0.82 | 2.49 ± 0.87 | 2.78 ± 0.73 | 0.21 |
Values are n (%) or means ± SDs unless otherwise indicated. Sample size was restricted to subjects with ≥1 outcome measure in early adolescence, and without missing exposure and covariate data. SSB, sugar-sweetened beverage.
After adjusting for sociodemographic characteristics and parental BMI, we observed positive monotonic increases in z scores for adiposity (Figure 2A) and MetS risk markers (Figure 2B) with increasing number of risk factors (Ptrend < 0.05 for all, except SBP z score). Children with 5–6 risk factors (compared with those with 0–1 risk factors) had the highest z scores of 0.64 SD units (95% CI: 0.31, 0.98 SD units) for BMI, 0.56 SD units (95% CI: 0.21, 0.91 SD units) for FMI, 0.64 SD units (95% CI: 0.28, 1.00 SD units) for TFMI, and 0.32 SD units (95% CI: 0.15, 0.50 SD units) for MetS. Among the MetS components, 5–6 compared with 0–1 risk factors predicted higher waist circumference (0.37 SD units; 95% CI: 0.16, 0.57 SD units) and HOMA-IR (0.63 SD units; 95% CI: 0.23, 1.03 SD units). Although no significant associations with HDL, SBP, or triglycerides were evident for those with 5–6 risk factors, effect estimates were in the hypothesized directions. We also observed positive monotonic increases in risk of OwOb with increasing risk factor score in adjusted models (Figure 3). Children with 5–6 risk factors (compared with those with 0–1 risk factors) had the highest relative risk of having OwOb [risk ratio (RR): 2.53; 95% CI: 1.63, 3.91] and being in the highest MetS quartile (RR: 2.46; 95% CI: 1.43, 4.21).
FIGURE 2.

Associations of number of risk factors across the first 1000 d with adiposity indexes (A) and metabolic risk markers (B) in early adolescence (n = 1038). All models were adjusted for mother's age at enrollment, education level, parity, prepregnancy BMI, father's BMI, median neighborhood household income, and child's race/ethnicity. FMI, fat mass index; SBP, systolic blood pressure; TFMI, trunk fat mass index; WC, waist circumference.
FIGURE 3.

Associations of number of risk factors across the first 1000 d with (A) OwOb status and (B) highest metabolic risk score quartile in early adolescence (n = 1038). All models were adjusted for mother's age at enrollment, education level, parity, prepregnancy BMI, father's BMI, median neighborhood household income, and child's race/ethnicity. OwOb, overweight/obesity.
Additional adjustment for gestational age, pubertal score, and child lifestyle behaviors (i.e., physical activity and SSB intake) in mid-childhood showed no appreciable changes in the associations of risk factor score with adiposity and cardiometabolic risk markers in early adolescence (Supplemental Table 2). These associations, however, were largely attenuated after adjusting for BMI z score in mid-childhood (Supplemental Table 3).
Our complete-case analyses (n = 787) showed similar patterns of associations of number of risk factors with adiposity and cardiometabolic risk in early adolescence to those observed using multiple imputation (Supplemental Figures 1, 2). In sex-stratified analysis, both male and female children with 5–6 risk factors (compared with 0–1 risk factors) had significantly higher risk of OwOb. However, only female children with 5–6 risk factors (compared with 0–1 risk factors) had significantly higher risk of being in the highest MetS quartile (Supplemental Figure 3).
For each risk factor, the probability of having OwOb ranged from 10% to 18% (Figure 4A). For the 31 risk factor combinations, these probabilities ranged from 9.4% (favorable levels for all factors) to 63.6% (adverse levels for all factors). Similar trends were observed for the probability of being in the highest MetS quartile (Figure 4B). Mixtures of favorable and adverse risk factor levels resulted in probabilities between these extremes. Children exposed to adverse levels of all 3 maternal risk factors during pregnancy had a 30% probability of having OwOb and a 17% probability of being in the highest MetS quartile. Similarly, children exposed to adverse levels of all 3 risk factors during infancy had a 30% probability of having OwOb and a 40% probability of being in the highest MetS quartile (Figure 4).
FIGURE 4.

Predicted probability of OwOb (subset n = 783) (A) and being in the highest MetS quartile (subset n = 436) (B) according to different risk factor combinations during the first 1000 d. All models were adjusted for mother's age at enrollment, education level, parity, prepregnancy BMI, father's BMI, median neighborhood household income, and child's race/ethnicity. MetS, metabolic risk score; OwOb, overweight/obesity.
Discussion
In this study, we observed positive and graded (i.e., dose–response) associations between an increasing risk factor score and adiposity and metabolic risk in early adolescence. Each risk factor contributed to a probability between 10% and 18% of having OwOb or being in the highest MetS quartile in early adolescence. More importantly, these associations were strongest for children exposed to the highest number of risk factors (5–6 risk factors) in the first 1000 d. Our study makes a unique contribution to the literature; to our knowledge, this is the first study to evaluate the associations of combinations of early-life risk factors with direct measures of adiposity and metabolic risk in early adolescence.
Our findings are in line with previous studies (4, 19–21) that reported combined influences of early-life risk factors on childhood adiposity. We have previously reported that a combination of 4 early-life risk factors predicted high probability of OwOb at ages 3–4 (19) and 7–10 y (4). In a UK birth cohort, Robinson et al. (21) also found positive associations between an increasing risk factor score and risk of childhood obesity at both 4 and 6 y of age. Similar results were found in an Asian birth cohort (20), in which early-life risk factors added cumulatively to increase childhood adiposity and risk of overweight at 4 y of age.
Our findings align with the “accumulation of risk” model in life course epidemiology, which suggests that damage to biological systems increases with accumulation of different types of exposures over the life course (56). We noted that exposure to adverse levels for all 6 early-life risk factors contributed to a probability of 64% of having OwOb. This was larger than our previous finding of 23% probability of having OwOb at age 3 y with 4 of the studied risk factors (19). However, we did not consider 2 important modifiable risk factors in our previous analysis—maternal SSB consumption and early introduction of complementary foods—which we and others have since shown to be associated with later child adiposity (12, 28, 30). Findings from other cohorts have suggested that the associations of early-life risk factors with later obesity may strengthen as the child grows older (21). One potential mechanism could be that early childhood obesity itself is a strong predictor for later adiposity (57), and thus may lead to a second hit at adolescence. This hypothesis is supported by our results, which showed that the associations of higher risk factor scores with higher risk of OwOb and being in the highest MetS quartile were largely attenuated after adjusting for mid-childhood BMI. Another mechanism could be that these early-life risk factors may be markers of an unhealthy and obesogenic environment and lifestyle behaviors after 2 y of age, which might further influence the adiposity development of children. However, in our study, further adjustment for lifestyle behaviors, such as physical activity and SSB consumption in mid-childhood, did not weaken the associations. Further studies are warranted to explore other potential mechanisms.
The results of our analysis are important given that the cluster of MetS components is a strong predictor of future chronic disease risk (58). A previous study found that MetS z score in childhood was associated with a ∼3- to 10-fold increase in risk of incident type 2 diabetes and cardiovascular disease 24–31 y later (59). To our knowledge, no previous studies have examined associations of combinations of early-life risk factors with MetS risk in childhood or adolescence. In our study, we observed monotonic increases in adolescent MetS z score with increasing number of early-life risk factors. The range of probabilities of being in the highest MetS quartile was 10%–58% according to the different combinations of risk factors. Certain prenatal risk factors such as excessive GWG and SSB consumption may increase the mother's glucose concentration, which may further program the child's metabolic risk (7). Greater plasma glucose as well as higher concentrations of glucose, lipids, and amino acids (fuels) cross the placenta and may hyper-stimulate the fetal pancreas, causing hyperinsulinemia and fetal overgrowth (60).
Taken together, our findings support the role of the first 1000 d as an important opportunity to improve offspring health early in the life course. Previous studies indicated that maternal behaviors during pregnancy and during infancy can be modified through behavior change interventions (61, 62). However, most intervention studies have only targeted these behaviors individually rather than in combination, and few have reported beneficial effects on child adiposity outcomes (10, 63). In a large randomized trial of breastfeeding promotion (64), the intervention improved breastfeeding duration and exclusivity (e.g., exclusive breastfeeding at 3 mo = 43.3% compared with 6.4% in the control arm) but did not reduce the child's BMI at 6.5, 11.5, or 16 y. A recent meta-analysis (65) of GWG intervention studies showed that excessive GWG could be prevented by improving maternal diet and physical activity, but that this did not reduce the large-for-gestational-age rate of newborns. A recent intervention study on smoking cessation during pregnancy also reported beneficial effects on infant weight gain; the sample size, however, was relatively small (n = 25) (66). Results of a randomized clinical trial in New Zealand showed that an intervention aimed at promoting exclusive breastfeeding and delaying introduction of complementary foods failed to reduce the BMI of children at 2 y of age (67, 68). Further, few intervention studies in the first 1000 d have targeted other potentially modifiable risk factors, such as SSB consumption (9). Our findings suggest that intervention strategies to prevent childhood obesity and MetS should be implemented early in the life course and target multiple risk factors and behaviors.
Strengths of our study include the prospective design, long-term follow-up, and wide range of cardiometabolic outcomes measured in early adolescence by highly trained staff using standardized protocols. Our study, however, is not without limitations. First, our findings might not be generalizable to other populations because our participants were predominantly white and well educated and all had health care. Second, our loss to follow-up between pregnancy and the early-adolescence visit was relatively substantial, which might conceivably have led to selection bias. However, our multiple imputation analyses showed similar findings compared with our complete-case analyses. Third, we did not include GDM as a risk factor, considering its low prevalence in our study and that it may not be as modifiable as other factors once pregnancy begins because it is strongly predicted by family history and prepregnancy BMI. We had also previously reported that, after accounting for prepregnancy BMI, GDM was not associated with adolescent adiposity in either boys or girls (69). Fourth, several of our exposures such as breastfeeding duration, prepregnancy BMI, smoking during pregnancy, and infant sleep duration were based on maternal self-reports and might be subject to reporting bias. However, it has been shown that self-reported information on breastfeeding duration is valid and reliable when recalled within 3 y (70). We had also conducted a validation study that showed a strong correlation (r = 0.99) between self-reported and objectively measured prepregnancy BMI (24). In addition, although social desirability concerns might have caused under-reporting of smoking behavior and infant sleep duration, the potential misclassification of maternal smoking history and sleep duration is likely nondifferential with respect to early-adolescent outcomes, and any resulting bias should be toward the null. Finally, we investigated multiple adiposity and cardiometabolic outcomes, therefore increasing the risk of false-positive results. We chose not to adjust for multiple comparisons, because we had based the “significance” of our findings on the strength and consistency of the associations observed across related cardiometabolic outcomes (71).
In summary, our results support the role of the first 1000 d as a crucial period for the development of excessive adiposity and cardiometabolic risk in early adolescence and, hence, this period represents an important opportunity to improve offspring health. These findings suggest targets for future early-life intervention trials and indicate that much can be done to prevent adiposity and adverse metabolic outcomes in adolescence. The WHO Commission on Ending Childhood Obesity recently underscored the need to develop multisectoral approaches and multibehavior interventions to reduce childhood obesity (2, 4). Interventions to prevent later obesity and cardiometabolic risk may be more effective if they are conducted early in the life course and concurrently target multiple modifiable factors.
Supplementary Material
ACKNOWLEDGEMENTS
The authors’ responsibilities were as follows—IMA, EO, and JH: designed the research; EO: conducted the research; IMA and JH: analyzed and wrote the paper; IMA: had primary responsibility for the final content; P-IDL, SLR-S, WP, JAWB, and DW critically reviewed the manuscript for important intellectual content; and all authors: read and approved the final manuscript. The authors report no conflicts of interest.
Notes
Supported by NIH grants R01 HD034568 (to EO) and UG3OD023286 (to EO), China Postdoctoral Science Foundation grant 2019M661179 (to JH), and National Institute of Diabetes and Digestive and Kidney Diseases grant K23DK115682 (to JAWB).
Supplemental Tables 1–3 and Supplemental Figures 1–3 are available from the “Supplementary data” link in the online posting of the article and from the same link in the online table of contents at https://academic.oup.com/ajcn/.
JH and IMA contributed equally to this work.
Data Availability: Data described in the article, code book, and analytic code will be made available upon request pending application.
Abbreviations used: FMI, fat mass index; GDM, gestational diabetes mellitus; GWG, gestational weight gain; MetS, metabolic syndrome; OwOb, overweight/obesity; PDS, pubertal development scale; RR, risk ratio; SBP, systolic blood pressure; SSB, sugar-sweetened beverage; TFMI, trunk fat mass index.
Contributor Information
Jiajin Hu, Institute of Health Sciences, China Medical University, Shenyang, Liaoning, China; Research Center of China Medical University Birth Cohort, China Medical University, Shenyang, Liaoning, China; Division of Chronic Disease Research across the Lifecourse, Department of Population Medicine, Harvard Medical School and Harvard Pilgrim Health Care Institute, Boston, MA, USA.
Izzuddin M Aris, Division of Chronic Disease Research across the Lifecourse, Department of Population Medicine, Harvard Medical School and Harvard Pilgrim Health Care Institute, Boston, MA, USA.
Pi-I D Lin, Division of Chronic Disease Research across the Lifecourse, Department of Population Medicine, Harvard Medical School and Harvard Pilgrim Health Care Institute, Boston, MA, USA.
Sheryl L Rifas-Shiman, Division of Chronic Disease Research across the Lifecourse, Department of Population Medicine, Harvard Medical School and Harvard Pilgrim Health Care Institute, Boston, MA, USA.
Wei Perng, Department of Epidemiology, Lifecourse Epidemiology of Adiposity and Diabetes (LEAD) Center, University of Colorado Anschutz Medical Campus, Aurora, CO, USA.
Jennifer A Woo Baidal, Division of Pediatric Gastroenterology, Hepatology, and Nutrition, Department of Pediatrics, Columbia University and New York-Presbyterian Morgan Stanley Children's Hospital, New York, NY, USA.
Deliang Wen, Institute of Health Sciences, China Medical University, Shenyang, Liaoning, China.
Emily Oken, Division of Chronic Disease Research across the Lifecourse, Department of Population Medicine, Harvard Medical School and Harvard Pilgrim Health Care Institute, Boston, MA, USA; Department of Nutrition, Harvard TH Chan School of Public Health, Boston, MA, USA.
References
- 1. Abarca-Gómez L, Abdeen ZA, Hamid Zargar A, Abu-Rmeileh NM, Acosta-Cazares B, Acuin C, Adams RJ, Aekplakorn W, Afsana K, Aguilar-Salinas CA et al. Worldwide trends in body-mass index, underweight, overweight, and obesity from 1975 to 2016: a pooled analysis of 2416 population-based measurement studies in 128.9 million children, adolescents, and adults. Lancet. 2017;390:2627–42. [DOI] [PMC free article] [PubMed] [Google Scholar]
- 2. WHO Commission on Ending Childhood Obesity. Report of the Commission on Ending Childhood Obesity. Implementation plan: executive summary. Geneva: World Health Organization; 2017. [Google Scholar]
- 3. Friend A, Craig L, Turner S. The prevalence of metabolic syndrome in children: a systematic review of the literature. Metab Syndr Relat Disord. 2013;11:71–80. [DOI] [PubMed] [Google Scholar]
- 4. Gillman MW, Ludwig DS. How early should obesity prevention start?. N Engl J Med. 2013;369:2173–5. [DOI] [PubMed] [Google Scholar]
- 5. Aris IM, Fleisch AF, Oken E. Developmental origins of disease: emerging prenatal risk factors and future disease risk. Curr Epidemiol Rep. 2018;5:293–302. [DOI] [PMC free article] [PubMed] [Google Scholar]
- 6. Hivert MF, Perng W, Watkins SM, Newgard CS, Kenny LC, Kristal BS, Patti ME, Isganaitis E, DeMeo DL, Oken E et al. Metabolomics in the developmental origins of obesity and its cardiometabolic consequences. J Dev Orig Health Dis. 2015;6:65–78. [DOI] [PMC free article] [PubMed] [Google Scholar]
- 7. Fall CHD, Kumaran K. Metabolic programming in early life in humans. Phil Trans R Soc B. 2019;374:20180123. [DOI] [PMC free article] [PubMed] [Google Scholar]
- 8. Gillman MW. Early infancy – a critical period for development of obesity. J Devel Orig Health Dis. 2010;1:292–9. [DOI] [PMC free article] [PubMed] [Google Scholar]
- 9. Reilly JJ, Martin A, Hughes AR. Early-life obesity prevention: critique of intervention trials during the first one thousand days. Curr Obes Rep. 2017;6:127–33. [DOI] [PMC free article] [PubMed] [Google Scholar]
- 10. Blake-Lamb TL, Locks LM, Perkins ME, Woo Baidal JA, Cheng ER, Taveras EM. Interventions for childhood obesity in the first 1,000 days a systematic review. Am J Prev Med. 2016;50:780–9. [DOI] [PMC free article] [PubMed] [Google Scholar]
- 11. Hu J, Aris IM, Oken E, Ma Y, Ding N, Gao M, Wei X, Wen D. Association of total and trimester-specific gestational weight gain rate with early infancy weight status: a prospective birth cohort study in China. Nutrients. 2019;11:280. [DOI] [PMC free article] [PubMed] [Google Scholar]
- 12. Gillman MW, Rifas-Shiman SL, Fernandez-Barres S, Kleinman K, Taveras EM, Oken E. Beverage intake during pregnancy and childhood adiposity. Pediatrics. 2017;140:e20170031. [DOI] [PMC free article] [PubMed] [Google Scholar]
- 13. McDermott MM, Brubaker L. Prepregnancy body mass index, weight gain during pregnancy, and health outcomes. JAMA. 2019;321:1715. [DOI] [PubMed] [Google Scholar]
- 14. Rayfield S, Plugge E. Systematic review and meta-analysis of the association between maternal smoking in pregnancy and childhood overweight and obesity. J Epidemiol Community Health. 2017;71:162–73. [DOI] [PubMed] [Google Scholar]
- 15. Kc K, Shakya S, Zhang H. Gestational diabetes mellitus and macrosomia: a literature review. Ann Nutr Metab. 2015;66(Suppl 2):14–20. [DOI] [PubMed] [Google Scholar]
- 16. Miller AL, Lumeng JC, LeBourgeois MK. Sleep patterns and obesity in childhood. Curr Opin Endocrinol Diabetes Obes. 2015;22:41–7. [DOI] [PMC free article] [PubMed] [Google Scholar]
- 17. Zhu Y, Olsen SF, Mendola P, Halldorsson TI, Rawal S, Hinkle SN, Yeung EH, Chavarro JE, Grunnet LG, Granström C et al. Maternal consumption of artificially sweetened beverages during pregnancy, and offspring growth through 7 years of age: a prospective cohort study. Int J Epidemiol. 2017;46:1499–508. [DOI] [PMC free article] [PubMed] [Google Scholar]
- 18. Yan J, Liu L, Zhu Y, Huang G, Wang PP. The association between breastfeeding and childhood obesity: a meta-analysis. BMC Public Health. 2014;14:1267. [DOI] [PMC free article] [PubMed] [Google Scholar]
- 19. Gillman MW, Rifas-Shiman SL, Kleinman K, Oken E, Rich-Edwards JW, Taveras EM. Developmental origins of childhood overweight: potential public health impact. Obesity (Silver Spring). 2008;16:1651–6. [DOI] [PMC free article] [PubMed] [Google Scholar]
- 20. Aris IM, Bernard JY, Chen L-W, Tint MT, Pang WW, Soh SE, Saw S-M, Shek LP-C, Godfrey KM, Gluckman PD et al. Modifiable risk factors in the first 1000 days for subsequent risk of childhood overweight in an Asian cohort: significance of parental overweight status. Int J Obes. 2018;42:44–51. [DOI] [PMC free article] [PubMed] [Google Scholar]
- 21. Robinson SM, Crozier SR, Harvey NC, Barton BD, Law CM, Godfrey KM, Cooper C, Inskip HM. Modifiable early-life risk factors for childhood adiposity and overweight: an analysis of their combined impact and potential for prevention. Am J Clin Nutr. 2015;101:368–75. [DOI] [PMC free article] [PubMed] [Google Scholar]
- 22. Alberga AS, Sigal RJ, Goldfield G, Prud'homme D, Kenny GP. Overweight and obese teenagers: why is adolescence a critical period?. Pediatr Obes. 2012;7:261–73. [DOI] [PubMed] [Google Scholar]
- 23. Stoner L, Weatherall M, Skidmore P, Castro N, Lark S, Faulkner J, Williams MA. Cardiometabolic risk variables in preadolescent children: a factor analysis. J Am Heart Assoc. 2017;6:e007071. [DOI] [PMC free article] [PubMed] [Google Scholar]
- 24. Oken E, Taveras EM, Kleinman KP, Rich-Edwards JW, Gillman MW. Gestational weight gain and child adiposity at age 3 years. Am J Obstet Gynecol. 2007;196:322.e1–8. [DOI] [PMC free article] [PubMed] [Google Scholar]
- 25. Hivert MF, Rifas-Shiman SL, Gillman MW, Oken E. Greater early and mid-pregnancy gestational weight gains are associated with excess adiposity in mid-childhood. Obesity. 2016;24:1546–53. [DOI] [PMC free article] [PubMed] [Google Scholar]
- 26. Taveras EM, Rifas-Shiman SL, Oken E, Gunderson EP, Gillman MW. Short sleep duration in infancy and risk of childhood overweight. Arch Pediatr Adolesc Med. 2008;162:305–11. [DOI] [PMC free article] [PubMed] [Google Scholar]
- 27. Taveras EM, Rifas-Shiman SL, Scanlon KS, Grummer-Strawn LM, Sherry B, Gillman MW. To what extent is the protective effect of breastfeeding on future overweight explained by decreased maternal feeding restriction?. Pediatrics. 2006;118:2341–8. [DOI] [PMC free article] [PubMed] [Google Scholar]
- 28. Huh SY, Rifas-Shiman SL, Taveras EM, Oken E, Gillman MW. Timing of solid food introduction and risk of obesity in preschool-aged children. Pediatrics. 2011;127:e544–51. [DOI] [PMC free article] [PubMed] [Google Scholar]
- 29. Oken E, Huh SY, Taveras EM, Rich-Edwards JW, Gillman MW. Associations of maternal prenatal smoking with child adiposity and blood pressure. Obes Res. 2005;13:2021–8. [DOI] [PMC free article] [PubMed] [Google Scholar]
- 30. Gingras V, Aris IM, Rifas-Shiman SL, Switkowski KM, Oken E, Hivert MF. Timing of complementary feeding introduction and adiposity throughout childhood. Pediatrics. 2019;144:e20191320. [DOI] [PMC free article] [PubMed] [Google Scholar]
- 31. Oken E, Baccarelli AA, Gold DR, Kleinman KP, Litonjua AA, De Meo D, Rich-Edwards JW, Rifas-Shiman SL, Sagiv S, Taveras EM et al. Cohort profile: Project Viva. Int J Epidemiol. 2015;44:37–48. [DOI] [PMC free article] [PubMed] [Google Scholar]
- 32. Chen A, Pennell ML, Klebanoff MA, Rogan WJ, Longnecker PM. Maternal smoking during pregnancy in relation to child overweight: follow-up to age 8 years. Int J Epidemiol. 2006;35:121–30. [DOI] [PubMed] [Google Scholar]
- 33. Sharma AJ, Cogswell ME, Grummer-Strawn LM. The association between pregnancy weight gain and childhood overweight is modified by mother's pre-pregnancy BMI. Pediatr Res. 2005;58(5):1008–139. [Google Scholar]
- 34. Harder T, Bergmann R, Kallischnigg G, Plagemann A. Duration of breastfeeding and risk of overweight: a meta-analysis. Am J Epidemiol. 2005;162:397–403. [DOI] [PubMed] [Google Scholar]
- 35. Tuohino T, Morales-Muñoz I, Saarenpää-Heikkilä O, Kiviruusu O, Paunio T, Hovi P, Pietiläinen KH, Paavonen EJ. Short sleep duration and later overweight in infants. J Pediatr. 2019;212:13–19. [DOI] [PubMed] [Google Scholar]
- 36. Reilly JJ, Armstrong J, Dorosty AR, Emmett PM, Ness A, Rogers I, Steer C, Sherriff A, for the Avon Longitudinal Study of Parents and Children Study Team . Early life risk factors for obesity in childhood: cohort study. BMJ. 2005;330:1357. [DOI] [PMC free article] [PubMed] [Google Scholar]
- 37. Papoutsou S, Savva SC, Hunsberger M, Jilani H, Michels N, Ahrens W, Tornaritis M, Veidebaum T, Molnár D, Siani A et al. Timing of solid food introduction and association with later childhood overweight and obesity: the IDEFICS study. Matern Child Nutr. 2018;14(1):e12471. [DOI] [PMC free article] [PubMed] [Google Scholar]
- 38. Miller MA, Kruisbrink M, Wallace J, Ji C, Cappuccio FP. Sleep duration and incidence of obesity in infants, children, and adolescents: a systematic review and meta-analysis of prospective studies. Sleep. 2018;41(4):zsy018. [DOI] [PubMed] [Google Scholar]
- 39. Voerman E, Santos S, Patro Golab B, Amiano P, Ballester F, Barros H, Bergström A, Charles MA, Chatzi L, Chevrier C et al. Maternal body mass index, gestational weight gain, and the risk of overweight and obesity across childhood: an individual participant data meta-analysis. PLoS Med. 2019;16:e1002744. [DOI] [PMC free article] [PubMed] [Google Scholar]
- 40. Jen V, Erler NS, Tielemans MJ, Braun KV, Jaddoe VW, Franco OH, Voortman T. Mothers’ intake of sugar-containing beverages during pregnancy and body composition of their children during childhood: the Generation R Study. Am J Clin Nutr. 2017;105:834–41. [DOI] [PubMed] [Google Scholar]
- 41. Institute of Medicine (US) and National Research Council (US) Committee to Reexamine IOM Pregnancy Weight Guidelines Rasmussen KM, Yaktine ALeditors. Weight gain during pregnancy: reexamining the guidelines. Washington (DC): National Academies Press (US) National Academy of Sciences; 2009. [PubMed] [Google Scholar]
- 42. Fawzi WW, Rifas-Shiman SL, Rich-Edwards JW, Willett WC, Gillman MW. Calibration of a semi-quantitative food frequency questionnaire in early pregnancy. Ann Epidemiol. 2004;14:754–62. [DOI] [PubMed] [Google Scholar]
- 43. Corkins RM. Children with special health care needs: Nutrition Care Handbook. Nutr Clin Pract. 2006;21:638. [Google Scholar]
- 44. Blum RE, Wei EK, Rockett HR, Langeliers JD, Leppert J, Gardner JD, Colditz GA. Validation of a food frequency questionnaire in Native American and Caucasian children 1 to 5 years of age. Matern Child Health J. 1999;3:167–72. [DOI] [PubMed] [Google Scholar]
- 45. Kuczmarski RJ, Kuczmarski MF, Roche AF. CDC growth charts. Top Clin Nutr. 2002;17:15–26. [Google Scholar]
- 46. Boeke CE, Oken E, Kleinman KP, Rifas-Shiman SL, Gillman MW. Correlations among adiposity measures in school-aged children. BMC Pediatr. 2013;13:99. [DOI] [PMC free article] [PubMed] [Google Scholar]
- 47. Lee JM, Okumura MJ, Davis MM, Herman WH, Gurney JG. Prevalence and determinants of insulin resistance among U.S. adolescents: a population-based study. Diabetes Care. 2006;29:2427–32. [DOI] [PubMed] [Google Scholar]
- 48. McQuillan GM, McLean JE, Chiappa M, Lukacs SL. National Health and Nutrition Examination Survey Biospecimen Program: NHANES III (1988–1994) and NHANES 1999–2014. Vital Health Statistics Report Series 2. 2015(170):1–14. [PubMed] [Google Scholar]
- 49. Belfort MB, Rifas-Shiman SL, Rich-Edwards J, Kleinman KP, Gillman MW. Size at birth, infant growth, and blood pressure at three years of age. J Pediatr. 2007;151:670–4. [DOI] [PMC free article] [PubMed] [Google Scholar]
- 50. Flynn JT, Kaelber DC, Baker-Smith CM, Blowey D, Carroll AE, Daniels SR, Ferranti SD, Dionne JM, Falkner B, Flinn SK. Clinical practice guideline for screening and management of high blood pressure in children and adolescents. Pediatrics. 2017;140:e20171904. [DOI] [PubMed] [Google Scholar]
- 51. Perng W, Rifas-Shiman SL, Sordillo J, Hivert MF, Oken E. Metabolomic profiles of overweight/obesity phenotypes during adolescence: a cross-sectional study in Project Viva. Obesity. 2020;28:379–87. [DOI] [PMC free article] [PubMed] [Google Scholar]
- 52. Taveras EM, Gillman MW, Kleinman KP, Rich-Edwards JW, Rifas-Shiman SL. Reducing racial/ethnic disparities in childhood obesity: the role of early life risk factors. JAMA Pediatr. 2013;167(8):731–8. [DOI] [PMC free article] [PubMed] [Google Scholar]
- 53. Aris IM, Rifas-Shiman SL, Li L-J, Fleisch AF, Hivert MF, Kramer MS, Oken E. Parental obesity and offspring pubertal development: Project Viva. J Pediatr. 2019;215:123–31.e2. [DOI] [PMC free article] [PubMed] [Google Scholar]
- 54. Carskadon MA, Acebo C. A self-administered rating scale for pubertal development. J Adolesc Health. 1993;14:190–5. [DOI] [PubMed] [Google Scholar]
- 55. Barros AJ, Hirakata VN. Alternatives for logistic regression in cross-sectional studies: an empirical comparison of models that directly estimate the prevalence ratio. BMC Med Res Methodol. 2003;3:21. [DOI] [PMC free article] [PubMed] [Google Scholar]
- 56. Kuh D, Ben-Shlomo Y, Lynch J, Hallqvist J, Power C. Life course epidemiology. J Epidemiol Community Health. 2003;57:778–83. [DOI] [PMC free article] [PubMed] [Google Scholar]
- 57. Smego A, Woo JG, Klein J, Suh C, Bansal D, Bliss S, Daniels SR, Bolling C, Crimmins NA. High body mass index in infancy may predict severe obesity in early childhood. J Pediatr. 2017;183:87–93.e1. [DOI] [PMC free article] [PubMed] [Google Scholar]
- 58. DeBoer MD. Assessing and managing the metabolic syndrome in children and adolescents. Nutrients. 2019;11:1788. [DOI] [PMC free article] [PubMed] [Google Scholar]
- 59. Morrison JA, Friedman LA, Wang P, Glueck CJ. Metabolic syndrome in childhood predicts adult metabolic syndrome and type 2 diabetes mellitus 25 to 30 years later. J Pediatr. 2008;152:201–6. [DOI] [PubMed] [Google Scholar]
- 60. Pedersen J. Weight and length at birth of infants of diabetic mothers. Acta Endocrinol (Copenh). 1954;16:330–42. [DOI] [PubMed] [Google Scholar]
- 61. Alaniz K, Christiansen B, Stewart K, Sullivan TE, Khalil L, Fiore MC. Helping low income pregnant women quit smoking: improving the First Breath Program. WMJ. 2019;118:120–5. [PubMed] [Google Scholar]
- 62. Neifert M, Bunik M. Overcoming clinical barriers to exclusive breastfeeding. Pediatr Clin North Am. 2013;60:115–45. [DOI] [PubMed] [Google Scholar]
- 63. Phelan S, Clifton RG, Haire-Joshu D, Redman ML, Van Horn L, Evans M, Joshipura K, Couch KA, Arteaga SS, Cahill AG et al. One-year postpartum anthropometric outcomes in mothers and children in the LIFE-Moms lifestyle intervention clinical trials. Int J Obes. 2020;44:57–68. [DOI] [PMC free article] [PubMed] [Google Scholar]
- 64. Martin RM, Patel R, Kramer MS, Guthrie L, Vilchuck K, Bogdanovich N, Sergeichick N, Gusina N, Foo Y, Palmer T et al. Effects of promoting longer-term and exclusive breastfeeding on adiposity and insulin-like growth factor-I at age 11.5 years: a randomized trial. JAMA. 2013;309:1005–13. [DOI] [PMC free article] [PubMed] [Google Scholar]
- 65. Goldstein RF, Abell SK, Ranasinha S, Misso M, Boyle JA, Black MH, Li N, Hu G, Corrado F, Rode L et al. Association of gestational weight gain with maternal and infant outcomes: a systematic review and meta-analysis. JAMA. 2017;317:2207–25. [DOI] [PMC free article] [PubMed] [Google Scholar]
- 66. Wen X, Eiden RD, Justicia-Linde FE, Wang Y, Higgins ST, Kong KL, Shittu AT, Perkins JM, Esadah P, Mautner TE et al. Reducing fetal origins of childhood obesity through maternal smoking cessation during pregnancy: an intervention study. Int J Obes. 2019;43:1435–9. [DOI] [PMC free article] [PubMed] [Google Scholar]
- 67. Taylor RW, Williams SM, Fangupo LJ, Wheeler BJ, Taylor BJ, Daniels L, Elizabeth AF, McArthur J, Morison B, Erickson LM et al. Effect of a baby-led approach to complementary feeding on infant growth and overweight: a randomized clinical trial. JAMA Pediatr. 2017;171:838–46. [DOI] [PMC free article] [PubMed] [Google Scholar]
- 68. Wake M, Price A, Clifford S, Ukoumunne OC, Hiscock H. Does an intervention that improves infant sleep also improve overweight at age 6? Follow-up of a randomised trial. Arch Dis Child. 2011;96:526–32. [DOI] [PubMed] [Google Scholar]
- 69. Gingras V, Rifas-Shiman SL, Derks IPM, Aris IM, Oken E, Hivert MF. Associations of gestational glucose tolerance with offspring body composition and estimated insulin resistance in early adolescence. Diabetes Care. 2018;41:e164–6. [DOI] [PMC free article] [PubMed] [Google Scholar]
- 70. Li R, Scanlon KS, Serdula MK. The validity and reliability of maternal recall of breastfeeding practice. Nutr Rev. 2005;63:103–10. [DOI] [PubMed] [Google Scholar]
- 71. Streiner DL. Best (but oft-forgotten) practices: the multiple problems of multiplicity—whether and how to correct for many statistical tests. Am J Clin Nutr. 2015;102:721–8. [DOI] [PubMed] [Google Scholar]
Associated Data
This section collects any data citations, data availability statements, or supplementary materials included in this article.