

ABSTRACT
Background
Increasing interest in diets excluding meat and other products of animal origin emphasizes the importance of objective and reliable methods to measure dietary exposure, to evaluate associations and causation between diet and health, and to quantify nutrient intakes in different diets.
Objectives
This study aimed to investigate if NMR analysis of urine samples can serve as an objective method to discriminate vegan, vegetarian with or without fish, and omnivore diets. A secondary aim was to assess the influence of dietary nutrient intake on the metabolomics results.
Methods
Healthy individuals (43 men and 75 women, age 19–57 y) complying with habitual vegan (n = 42), vegetarian (n = 25), vegetarian + fish (n = 13), or omnivore (n = 38) diets were enrolled. Data were collected on clinical phenotype and lifestyle including a 4-d weighed food diary. Urine was analyzed for metabolites by NMR spectroscopy and data normalized using probabilistic quotient normalization and Pareto-scaled before multivariate analysis. Before orthogonal projections to latent structures with discriminant analysis, participants were assigned as meat consumers or nonmeat consumers (vegans and vegetarians), vegans or nonvegans (omnivores, vegetarian, and vegetarian + fish).
Results
The main results showed that it was possible to discriminate meat and nonmeat consumers (91% correctly classified), but discrimination between vegans and nonvegans was less rigorous (75% correctly classified). Secondary outcomes showed that reported intake of protein was higher in omnivores, and saturated fat lower and fiber higher in vegans, compared with the other groups. Discriminating metabolites were mainly related to differences in protein intake.
Conclusions
NMR urine metabolomics appears suitable to objectively identify and predict habitual intake of meat in healthy individuals, but results should be interpreted with caution because not only food groups but also specific foods contribute to the patterns.
This trial was registered at clinicaltrials.gov as NCT02039609.
Keywords: habitual diet, vegan, vegetarian, omnivore, meat, metabolomics, NMR, urine, nutrients
Introduction
Vegetarians tend to be healthier than omnivores, with a lower incidence and/or mortality from ischemic heart disease and from total cancer (1). However, this might reflect not only dietary intake, but also other lifestyle factors. In fact, studies have yielded inconsistent results as to whether vegetarian diets compared with omnivorous diets are associated with reduced incidence of metabolic syndrome and its components (2, 3). Such an association could be due to the composition of the vegetarian diets, but this is often unknown and thus could be diverse. In general though, vegetarian diets have a lower content of SFAs and higher content of fiber than omnivore diets (4–6).
Worldwide, meat consumption is increasing and especially in countries with increasing levels of income (7). However, environmental and health sustainability concerns have awakened interest in diets with less or no meat (8). The food industry has responded by introducing new products to substitute meat and dairy, and these are increasingly available. Hence, the nutrient intake in the vegetarian diet could be changing over time. Animal products such as meat, fish, dairy, and eggs contain all essential amino acids, but also are the main dietary source for many vitamins and minerals (9). Thus, when excluding foods from animal sources, the risk of consuming a nutritionally inadequate diet increases.
To understand how consumption or nonconsumption of meat and other animal products influences health, researchers need objective methods for capturing true intake. Metabolomics holds the potential to capture habitual diet (10), but few metabolomics studies have investigated the metabolome in relation to meat or intake of foods from animal sources in human biofluids (11–15). MS-based methods are more sensitive than 1H-NMR (i.e., can detect low-concentration metabolites such as hormones and vitamins) and in this respect represent a preferred choice for biomarker discovery. However, NMR spectroscopy has several advantages: low cost, minimum sample preparation, rapid analysis with high reproducibility, and confident metabolite identification. In this light NMR spectroscopy is an adequate choice when studying the patterns of metabolites in relation to habitual diets.
We have previously reported the possibility to separate different habitual diets using an NMR metabolomics approach on serum samples from the same set of individuals as in the present study (16). Nevertheless, urine has some advantages over serum in metabolomics analysis because urine contains a wider range of metabolites, and homeostasis does not influence metabolite content to the same extent as in serum. Only 1 published NMR-based metabolomics study has been conducted to study the metabolic difference in urine with regard to meat intake between habitual vegetarians and omnivores (15). This study reported significantly different patterns of metabolites between the vegetarians and omnivores, indicating also that the urinary metabolite pattern could be used for distinguishing individuals eating products of animal origin or not. However, the study participants were either military officers and military spouses (omnivores) or individuals living in self-contained Buddhist communities (vegetarians) all living in Xiamen, China. Thus, the differences in metabolic patterns could be due to lifestyle factors other than diet.
Hence, the primary aim of this work was to investigate if urine metabolites analyzed by 1H-NMR also can be used as an objective method to discriminate between individuals habitually consuming meat, vegetarian, or vegan diets. The secondary aim was to evaluate the nutrient intake in a habitual omnivore diet, vegetarian diet adding fish, vegetarian diet, and vegan diet, and to assess the influence of dietary nutrient intake on the metabolomics results.
Methods
Subjects
The participant characteristics, recruitment, and study design were described in detail in our previous publication (16). Briefly, volunteers were recruited by advertisement for healthy individuals complying with habitual vegan, vegetarian (lacto-ovo), vegetarian plus fish, or omnivore diets living in the Gothenburg area, Sweden. Before entering the study, volunteers provided written informed consent. Volunteers were considered suitable if aged 18–65 y, healthy, with no regular use of medications (contraceptives were permitted), and BMI 18.0–30.0 kg/m2. Standard clinical measures (hemoglobin, vitamin B-12, folate, serum electrolytes, creatinine, liver transaminases, bilirubin, alkaline phosphatase, C-reactive protein, plasma glucose, and thyroid status) were examined by a physician to exclude participants with indication of disease, that is, not fulfilling the criterion “healthy.” Exclusion criteria were pregnancy, lactation, or regular use of nicotine products. Screening included a short lifestyle questionnaire including an FFQ and 2 questions on physical activity, and a 4-d weighed food diary for the days preceding sampling. Study staff instructed participants how to record their daily intake using a food scale (SECA Culina 852) and to avoid food supplements the week before sampling and alcohol the night before sampling. Bioimpedance (Bioimp version 5.3.1.1; ImpediMed) was used to measure body composition. There is currently no established method to estimate sample size in metabolomics studies (17), but a sample size of >90 individuals was estimated to be sufficient to generate robust multivariate models.
The project was approved by the Regional Ethical Review Board in Gothenburg (reference number 561–12), adhered to the Helsinki Declaration, and was registered with clinicaltrials.gov (identifier: NCT02039609).
Sampling and sample preprocessing
Morning urine was collected at home after overnight fasting, kept cold, and transported to the study site. Handling followed a strict protocol; the samples were kept at 4°C before processing, and subsequently centrifuged (2600 × g; 4°C; 10 min). Aliquoted samples were directly placed at −20°C and moved to −80°C within 2 h, where the samples were kept until analysis. Before 1H-NMR analysis, urine samples were thawed for 60 min at 4°C, and mixed with phosphate buffer (9:1) [1.5 M potassium phosphate monobasic buffer in D2O at pD 6.95 with 0.1% trimethylsilyl propionate-d4 (TSP-d4) and 0.5% NaN3] in a deep well plate and transferred to 3-mm NMR tubes (Bruker BioSpin, 96 sample racks for SampleJet) using SamplePro (Bruker BioSpin).
NMR spectroscopy and data processing
1H-NMR spectra were measured at 800 MHz using Bruker Avance III HD. One-dimensional 1H measurements were done with a perfect echo pulse sequence with excitation sculpting for water suppression. Samples were kept at 6°C in the SampleJet sample changer before acquisition. Thereafter, 64 scans were acquired into 64k data points with a sweep width of 20 ppm, an acquisition time of 2.04 s, and a relaxation delay of 3 s. The temperature was kept at 25°C during acquisition. Data were processed by including 0.3 Hz exponential line broadening, a double zero filling, and were referenced to the TSP-d4 standard signal in TopSpin 3.5pl7 (Bruker BioSpin). The data were further processed in MATLAB (MathWorks Inc). The 1H-NMR spectra were aligned by setting the TSP-d4 to 0 ppm using icoshift (11) and the spectra were bucketed using the function “opt_bucket.m” (18). This function used initial size of bucket = 0.04 and slackness = 0.5. The bucketed spectra were normalized using probabilistic quotient normalization (18), based on in-house MATLAB code, and buckets including the water signal were removed. This resulted in 493 buckets, from hereon called variables, representing ∼100 metabolites.
Chenomx NMR suite 8.4 (Chenomx Inc) was used for annotation of discriminating metabolites with the aid of the Human Metabolome Database (19) and an in-house implementation of the STOCSY routine (20).
Dietary data processing
Dietary habits—that is, vegan (consuming no food of animal origin), vegetarian (including dairy and egg), vegetarian plus fish, or omnivore (consuming a mixed diet)—were evaluated by general questions about diet and the FFQ. Two dietitians registered the 4-d weighed food diaries in DietistNet version 18.12.16 (Kost och näringsdata AB). The participants were asked to register 3 weekdays and 1 weekend day. Supplements were not included in the registration of the food diaries with the exception of protein powder, which was regarded as food. Calculations were done in 2 databases: the Swedish database (National Food Agency, Sweden, version 17.12.15) and the Finnish database Fineli (National Institute for Health and Welfare, version 18.02.28). Individual basal metabolic rate (BMR) was calculated based on a sex- and age-specific equation, including individual weight and height (21). Food intake level (FIL) was calculated by dividing total daily intake (kcal/d) with BMR (kcal/d). Individuals with a FIL value <1.0 were regarded as underreporters and excluded from the data analyses. Percentages of individuals reaching recommended daily intake, average requirement, and lowest recommended intake were calculated based on Nordic Nutrition Recommendations 2012 (21).
We formed 2 new dietary groups for multivariate data analysis: nonvegan including omnivores, vegetarians, and vegetarians adding fish; and nonmeat including vegans and vegetarians. Due to well-known sex differences in urine metabolite concentrations and a skewed distribution between men and women in the dietary groups, the larger group of women was also analyzed separately, to confirm that the discriminating metabolites were due to the diet and not to sex. The number of men was regarded as too few for a separate multivariate modeling, and instead men were predicted onto the women's model.
Multivariate methods
All multivariate analyses were performed using SIMCA software v.15.0 (Sartorius Stedim Biotech) and all data were Pareto-scaled and cross-validation groups set to 7 (default in SIMCA).
Principal component analysis (PCA) and orthogonal projections to latent structures (OPLS) were used to explore clustering patterns of observations, trends in the data in relation to known factors, and outliers. OPLS models include not only x-values (metabolite variables) but also y-values, that is, additional known factors that could influence the data such as BMI, triacylglycerols, nutrient intake, age, and sex. The presented OPLS models include y-values that had a cross-validation analysis of variance (CV-ANOVA) P < 0.05 for the model. Separation of classes and variables related to separation in the data according to classification of diet (vegan compared with nonvegan and meat compared with nonmeat) were evaluated using OPLS with discriminant analysis (OPLS-DA). The validity of OPLS-DA models was assessed using permutation tests (n = 999). Validated prediction models for performance are presented using the receiver operating characteristic (ROC) curve for OPLS-DA models. Also, to further test the model quality, 3 test sets (∼20% of participants) were selected by computerized randomization. The remaining participants’ samples for each set were used as a training set and the test set was projected onto the training set model. Median values for ROC curve and correct classification are presented. Also, cross-validated predictive residuals (CV-ANOVA) visual comparison between scores and cross-validated scores, the cumulative amount of explained variation in the data summarized by the model (R2X[cum] and R2Y[cum]), and the predictive ability of the model (Q2[cum]) are presented. Class discriminating variables of interest from the OPLS-DA models were selected if variables had −0.1 ≥ w ≥ 0.1 and if they were among the 20 highest variable importance scores, and these were further assessed by univariate analysis.
Univariate methods
Statistical analyses were performed using IBM SPSS statistics version 25 (IBM Corporation). Comparisons of characteristics and macro- and micronutrients between the 4 dietary groups were performed with Kruskal–Wallis ANOVA, or chi-square test for categorical variables, with Dunn post hoc test (with Bonferroni correction). Data are presented as median (first quartile, third quartile) with significance set at α = 0.05. Mann–Whitney U-test and logistic multivariable regression analysis were used to evaluate metabolites driving the separation in OPLS-DA models. Nonnormally distributed metabolites were log-transformed before logistic regressions were performed. The logistic regression models were adjusted for age, sex, BMI, and body fat mass (percentage). To adjust for multitesting a Bonferroni correction was applied; the 493 variables represent ∼100 metabolites and we therefore adjusted for 100 tests, that is, P values <0.0005 were regarded as significant.
Results
Participant characteristics
Data, blood, and urine samples were collected from 124 individuals. Two individuals with BMI <18.0 and 3 with FIL values <1.0 were excluded, and in 1 case the NMR analysis failed. Thus, 118 healthy individuals, 43 men and 75 women, were included in the present analyses (Figure 1). These participants have been described previously (16); the majority were young [median age (Q1, Q3) 28 (23, 33) y], of normal weight, and had a high level of physical activity. The groups did not differ in age, sex, BMI, BMR, FIL, or physical activity (Table 1). However, the percentage of men was slightly lower in the vegetarian group (P = 0.273), and the level of intense physical exercise was slightly higher in the omnivore group than in the other groups (P = 0.056), although nonsignificantly. Median time (Q1,Q3) from collection of urine at home to the study site refrigerator (4°C) was 1 h 15 min (1 h 00 min, 1 h 50 min), and samples were centrifuged, aliquoted, and in the freezer (−20°C) within 1 h 30 min (1 h 15 min, 1 h 45 min).
FIGURE 1.
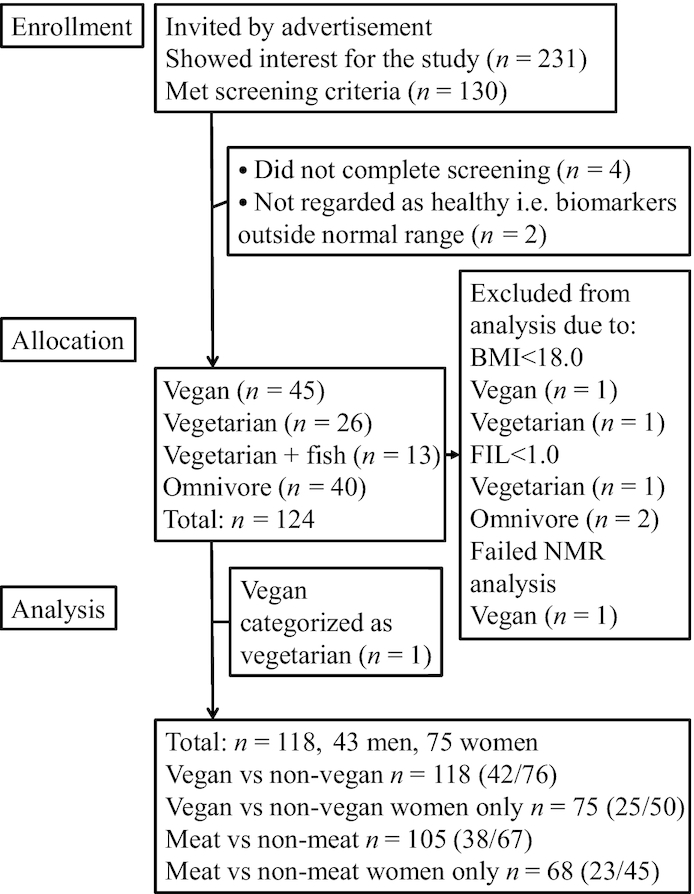
Consolidated standard reporting trials diagram. FIL, food intake level.
TABLE 1.
Participants’ characteristics
| Omnivore | Vegetarians adding fish | Vegetarian | Vegan | P value3 | |
|---|---|---|---|---|---|
| Number1 | n = 38 | n = 13 | n = 25 | n = 42 | |
| Sex (n male/female)1 | 15/23 | 6/7 | 5/20 | 17/25 | 0.273 |
| Age,2 y | 27.5 (22.0; 32.0) | 28.0 (26.0; 35.0) | 30.0 (23.5; 35.0) | 28.0 (24.8; 33.3) | 0.556 |
| BMI,2 kg/m2 | 22.1 (20.8; 23.1) | 20.0 (18.8; 22.3) | 21.3 (20.0; 23.7) | 21.3 (19.9; 23.2) | 0.113 |
| BMR,2 kcal/d | 1380 (1310; 1730) | 1450 (1320; 1740) | 1360 (1280; 1490) | 1480 (1310; 1610) | 0.556 |
| Food intake level2 | 1.50 (1.36; 1.77) | 1.30 (1.10; 1.55) | 1.39 (1.20; 1.60) | 1.45 (1.26; 1.64) | 0.055 |
| Moderate physical activity >150 min/wk | 68% | 69% | 56% | 60% | 0.698 |
| Intense physical exercise >90 min/wk | 71% | 31% | 64% | 52% | 0.056 |
Results are presented as number.
Median (first quartile; third quartile).
Calculated with Kruskal–Wallis ANOVA or chi-square test for categorical variables. P < 0.05 is regarded as significant.
Compliance with habitual diets and study instructions
Four participants registered dietary intake only on weekdays, that is, they refrained to register a weekend day. All omnivores reported consuming meat, poultry, fish, and eggs in the FFQ, but the frequency varied from a few times a month to >3 times a week. Not all vegetarians and vegetarians adding fish consumed both dairy and eggs. Three vegans reported eating honey, which is produced by animals. Eight vegans reported eating spirulina, nettle powder, or nutritional yeast, and 5 participants took protein powder supplementation, despite being asked to avoid supplementation during the week before sampling. Although the regular use of supplements was more common in vegans (93%) than in vegetarians (48%), the former had significantly lower serum vitamin B-12 concentrations than omnivores. Also, vegans and vegetarians had lower serum creatinine concentrations but higher folate concentrations than omnivores (16).
Macro- and micronutrient intake from 4-d weighed food diaries
The dietary groups differed in reported macronutrient intake but not in reported energy intake (Table 2). Omnivores reported a higher protein intake than the other groups but ∼60% reported fiber intake <25 g/d. Vegans reported both a higher fiber intake and better fat quality, resulting in a better macronutrient composition according to present Nordic recommendations of 2012 (21), within this dietary group. However, >30% of vegans and vegetarians reported a protein intake below lowest recommended intake (LI) (21).
TABLE 2.
Macronutrient intake calculated from 4-d dietary records from all participants1
| Omnivore (n = 38) | Vegetarian adding fish (n = 13) | Vegetarian (n = 25) | Vegan (n = 42) | ||||||
|---|---|---|---|---|---|---|---|---|---|
| Median (Q1, Q3) | Range | Median (Q1, Q3) | Range | Median (Q1, Q3) | Range | Median (Q1, Q3) | Range | P value2 | |
| Energy, kcal/d | 2180 (1890, 2720) | 1570–4320 | 2080 (1720, 2240) | 1450–2670 | 1910 (1590, 2400) | 1440–3000 | 2150 (1770, 2500) | 1260–3650 | 0.082 |
| Protein, E% | 15.6a (14.1, 18.6) | 11.9–32.4 | 13.0b (12.2, 14.7) | 11.7–20.2 | 12.0b (10.9, 13.2) | 8.6–19.2 | 11.2b (9.5, 12.2) | 8.2–16.0 | <0.001 |
| Fat, E% | 36.7 (32.0, 41.6) | 26.1–61.4 | 35.8 (29.1, 38.9) | 19.3–41.6 | 34.3 (31.5, 44.1) | 28.1–59.2 | 34.0 (24.3, 37.9) | 9.0–49.0 | 0.031 |
| Saturated fat, E% | 13.6a (10.8, 16.8) | 7.8–26.3 | 12.8a (9.0, 17.2) | 4.3–20.6 | 12.7a (9.9, 12.7) | 7.7–20.2 | 7.0b (4.9, 10.5) | 1.3–18.5 | <0.001 |
| MUFA, E% | 13.8a (12.4, 16.9) | 9.1–22.4 | 10.8b (9.6, 12.2) | 7.4–19.6 | 14.2ab (11.9, 17.7) | 9.0–22.1 | 12.1ab (8.9, 16.9) | 3.5–23.4 | 0.014 |
| PUFA, E% | 5.7b (4.8, 6.6) | 3.3–10.0 | 5.6ab (4.1, 7.8) | 3.7–12.2 | 6.4b (5.3, 10.3) | 4.0–16.8 | 8.6a (7.2, 10.2) | 2.8–17.5 | <0.001 |
| Carbohydrates, E% | 42.7ab (37.3, 46.8) | 15.3–55.4 | 47.0ab (44.5, 52.5) | 40–58.5 | 46.1b (38.6, 49.7) | 19.6–55.2 | 51.2a (45.0, 58.9) | 29.7–76.3 | <0.001 |
| Fiber, g/d | 23.4b (20.1, 31.2) | 10.8–60.9 | 30.2b (25.3, 40.4) | 15.9–60.7 | 29.2b (23.3, 38.4) | 17.4–50.0 | 45.5a (36.4, 54.7) | 25.1–79.6 | <0.001 |
| Alcohol, E% | 0.5a (0.0, 3.1) | 0.0–13.9 | 0.0ab (0.0, 1.9) | 0.0–8.0 | 0.0ab (0.0, 3.1) | 0.0–15.8 | 0.0b (0.0, 0.2) | 0.0–9.6 | 0.012 |
E%, energy percentage; Q1, first quartile of IQR; Q3, third quartile of IQR.
Kruskal–Wallis ANOVA. Dunn post hoc test (with Bonferroni correction) was performed for all pairs of groups. Labeled medians in a row without a common letter differ, P < 0.05.
In addition, the groups differed significantly in intake of all micronutrients except vitamin A (Table 3). The omnivore diet had the highest content of many nutrients (niacin, zinc, vitamin D, riboflavin, phosphorus, selenium, calcium), whereas vegans had a higher intake of iron, magnesium, thiamin, vitamin C, and folate than the other groups. For some nutrients, such as calcium, an increasing intake of products of animal origin (i.e., vegan to vegetarian to vegetarian + fish to omnivore) increased the reported intake. However, vegetarians adding fish had a reported intake of vitamin D, riboflavin, phosphorus, and selenium that did not differ from omnivores, unlike vegetarians and vegans who had a lower intake.
TABLE 3.
Micronutrient intake calculated from 4-d dietary records1
| Omnivore (n = 38) | Vegetarians adding fish (n = 13) | Vegetarian (n = 25) | Vegan (n = 42) | Statistics | |||||||||
|---|---|---|---|---|---|---|---|---|---|---|---|---|---|
| Micronutrients | Median (Q1, Q3) | Range | Median (Q1, Q3) | Range | Median (Q1, Q3) | Range | Median (Q1, Q3) | Range | p2 | ||||
| Niacin, NE/d | 38.7a | (31.1, 47.8) | 18.8–85.7 | 26.7b | (21.4, 28.9) | 17.2–36.5 | 22.1b | (19.0, 29.4) | 13.9–40.8 | 25.4b | (19.8, 29.8) | 15.4–49.4 | <0.001 |
| Zinc, mg/d | 12.4a | (10.1, 14.8) | 8.3–18.7 | 8.7b | (8.0, 11.0) | 7.2–12.5 | 9.0b | (7.3, 11.6) | 5.4–18.0 | 8.8b | (7.6, 11.4) | 5.6–20.1 | <0.001 |
| Vitamin D, μg/d | 5.5a | (3.6, 7.4) | 2.0–14.5 | 4.0ab | (2.5, 6.2) | 1.7–12.8 | 2.7b | (1.4, 4.2) | 0.2–10.6 | 2.2b | (0.4, 3.8) | 0.0–12.3 | <0.001 |
| Riboflavin, mg/d | 1.7a | (1.4, 2.2) | 1.0–2.8 | 1.4ab | (1.0, 1.6) | 0.9–2.0 | 1.2b | (0.8, 1.7) | 0.7–3.1 | 1.2b | (0.9, 1.6) | 0.5–4.1 | <0.001 |
| Phosphorus, g/d | 1.71a | (1.37, 1.92) | 0.10–2.43 | 1.39ab | (1.11, 1.50) | 0.95–1.83 | 1.25b | (0.97, 1.50) | 0.80–1.98 | 1.28b | (1.05, 1.56) | 0.77–2.37 | <0.001 |
| Selenium, μg/d | 49a | (40, 65) | 25–308 | 41ab | (23, 54) | 17–72 | 32b | (21, 51) | 12–93 | 28b | (18, 42) | 11–237 | <0.001 |
| Thiamin, mg/d | 1.3b | (1.0, 1.7) | 0.6–3.0 | 1.2ab | (1.0, 1.6) | 0.8–1.7 | 1.1b | (0.9, 1.5) | 0.5–2.7 | 1.5a | (1.3, 2.0) | 0.8–3.1 | 0.001 |
| Calcium, g/d | 0.97a | (0.83, 1.17) | 0.59–1.87 | 0.86ab | (0.73, 1.15) | 0.55–1.20 | 0.83b | (0.72, 1.05) | 0.56–1.40 | 0.65a | (0.54, 0.81) | 0.32–1.62 | <0.001 |
| Potassium, g/d | 3.36ab | (2.88, 4.35) | 2.04–5.49 | 3.20ab | (2.75, 3.54) | 1.87–5.30 | 2.99a | (2.45, 3.55) | 1.88–4.81 | 3.94b | (3.17, 4.43) | 1.62–6.36 | 0.005 |
| Vitamin E, mg/d | 15.5ab | (10.9, 19.7) | 7.7–28.7 | 12.4b | (9.1, 15.1) | 7.8–22.5 | 15.2ab | (12.4, 20.1) | 7.4–31.2 | 17.4a | (12.8, 22.5) | 8.3–39.9 | 0.011 |
| Vitamin B-6, mg/d | 2.2ab | (1.7, 2.7) | 1.1–6.0 | 1.6b | (1.4, 2.0) | 1.0–3.7 | 1.7b | (1.5, 2.3) | 1.3–4.2 | 2.7a | (2.0, 3.1) | 0.8–7.8 | 0.001 |
| Folate, μg/d | 352b | (289, 421) | 176–663 | 361b | (277, 480) | 218–800 | 429b | (289, 497) | 206–742 | 488a | (392, 616) | 274–1030 | <0.001 |
| Iron, mg/d | 12.0b | (9.8, 14.7) | 6.2–23.6 | 12.1b | (9.0, 15.0) | 7.9–17.9 | 11.5b | (8.8, 14.5) | 5.2–18.5 | 16.0a | (13.2, 20.3) | 8.5–34.3 | <0.001 |
| Magnesium, mg/d | 383a | (316, 473) | 226–701 | 373a | (332, 503) | 273–620 | 415a | (313, 570) | 211–761 | 556b | (490, 701) | 297–1080 | <0.001 |
| Vitamin B-12, μg/d | 5.2a,b | (3.9, 6.7) | 2.0–11.4 | 2.9a,b | (1.7, 3.4) | 1.4–4.6 | 1.4b | (0.9, 2.4) | 0.7–5.2 | 0.7c | (0.2, 1.0) | 0.0–5.8 | <0.001 |
| Vitamin A, RE/d | 825 | (657, 1170) | 257–1970 | 799 | (512, 1160) | 310–2300 | 721 | (468, 1010) | 202–2540 | 618 | (370, 1040) | 58–1790 | 0.061 |
| Vitamin C, mg/d | 121b | (88, 160) | 16–299 | 103b | (66, 146) | 41–221 | 127b | (81, 139) | 36–223 | 148a | (101, 211) | 59–368 | 0.031 |
All data are presented as median (Q1 = first quartile of IQR; Q3 = third quartile of IQR). NE, niacin equivalent; RE, retinol equivalent.
Kruskal–Wallis ANOVA. Dunn post hoc test (with Bonferroni correction) was performed for all pairs of groups. Labeled medians in a row without a common letter differ, P < 0.05.
All participants had a reported intake that met the average requirement for vitamin E, niacin, phosphorus, potassium, and zinc (21). In contrast, none of the groups exhibited an adequate intake of iron. Among the vegans and vegetarians only 4–5% had an adequate intake of vitamin D. Even so, diets including meat and fish (omnivores and vegetarians adding fish) only provided 15–24% of average requirement for vitamin D. Most vegans had an inadequate dietary intake of vitamin B-12. In addition, <65% of the participants not consuming meat had an adequate intake of riboflavin and selenium compared with 90% among the meat consumers. Figure 2 shows the percentage of participants meeting the average requirements and those with reported intakes below the lowest recommended intake for selected micronutrients.
FIGURE 2.
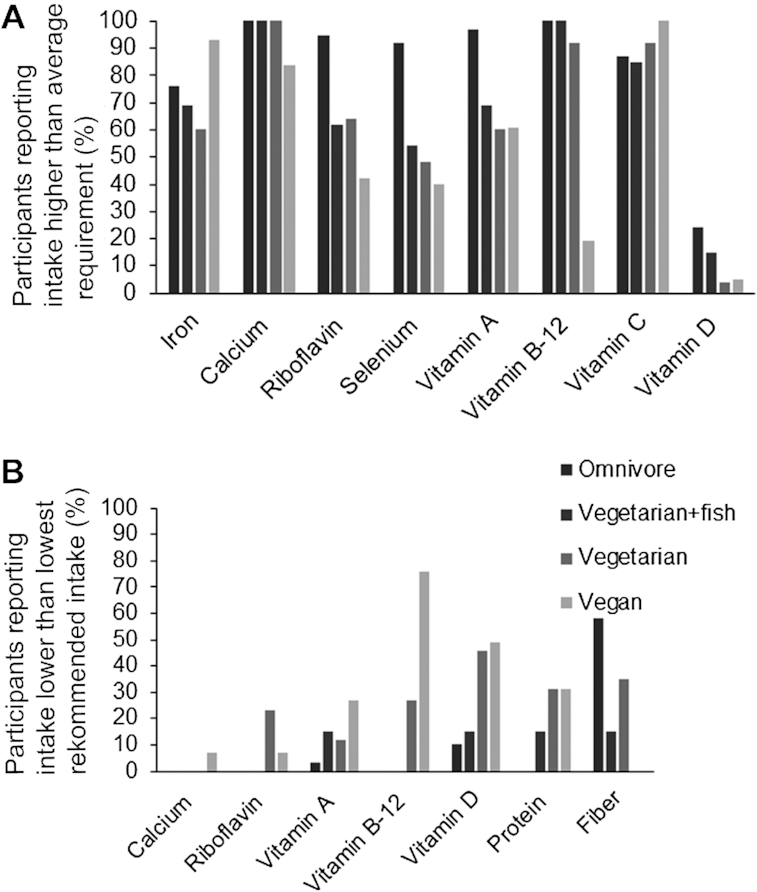
(A) Percentage of participants reporting intake higher than average requirement. (B) Percentage of participants reporting intake lower than lowest recommended intake. Fiber intake limit was set to 25 g/d and protein intake to 0.83 g protein/kg body weight/d according to Nordic Nutritional Requirements 2012 (21).
Urine metabolite patterns
In a PCA model including all dietary groups (n = 118), the largest variation in the data [23.9% of the explained variation (R2X)] was related to habitual diet (Figure 3, Table 4), but also to the overall concentration of metabolites, likely mirroring the effect of protein intake on urea concentration. The fourth largest variation [8.6% of the explained variation (R2X)] was related to sex. In an OPLS model (data not shown), with known nondietary factors included, sex and the sex-related factors percentage fat-free mass and creatinine were the only factors influencing the data. In the OPLS diet model (Table 4) total intake of energy, protein, fiber, niacin, vitamin B-12, phosphorus, zinc, and the PUFAs EPA (20:5n–3), DHA (22:6n–3), and arachidonic acid (20:4n–6) were included as y-values, all with a CV-ANOVA P < 0.05. Most of these dietary intakes can be related to food sources with a high protein content, that is, fish or meat.
FIGURE 3.
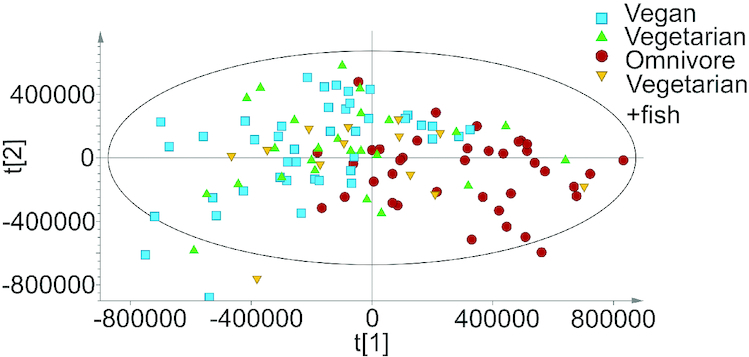
Principal component analysis model (n = 118) for component 1 t[1] and component 2 t[2], showing the impact of habitual diet in the model.
TABLE 4.
Multivariate model statistics for PCA-X, OPLS including dietary variables, and OPLS-DA models discriminating between different dietary groups1
| Model2 | No. of Lv3 | n | R2X [cum]4 | R2Y [cum]5 | Q2 [cum]6 | CV-ANOVA7 (p-value) | AUC | Permutation test (Q2)8 |
|---|---|---|---|---|---|---|---|---|
| PCA-X | 4 | 118 | 0.572 | 0.337 | ||||
| OPLS diet | 3 + 0 + 0 | 118 | 0.434 | 0.307 | 0.223 | <0.05 | −0.123 | |
| Men vs. women | 1 + 1 + 0 | 118 | 0.329 | 0.384 | 0.252 | 1.1e-6 | 0.87/0.87 | −0.203 |
| Meat vs. nonmeat all | 1 + 2 + 0 | 105 | 0.452 | 0.691 | 0.591 | 4.5e-17 | 0.98/0.98 | −0.358 |
| Meat vs. nonmeat women | 1 + 1 + 0 | 68 | 0.336 | 0.714 | 0.580 | 2.6e-11 | 0.97/0.97 | −0.329 |
| Vegan vs. nonvegan all | 1 + 0 + 0 | 118 | 0.235 | 0.258 | 0.205 | 1.9e-6 | 0.81/0.81 | −0.108 |
| Vegan vs. nonvegan women | 1 + 1 + 0 | 75 | 0.246 | 0.291 | 0.232 | 7.6e-5 | 0.80/0.80 | −0.151 |
AUC, area under curve; OPLS, orthogonal projections to latent structures; OPLS-DA, orthogonal projections to latent structures with discriminant analysis; PCA, principal component analysis.
“Meat” = omnivores; “Nonvegan” includes omnivores, vegetarians, and vegetarians adding fish; “Nonmeat” includes vegans and vegetarians.
Number of latent variables.
Cumulative fraction of the sum of squares of X explained by the selected latent variables.
Cumulative fraction of the sum of squares of Y explained by the selected latent variables.
Cumulative fraction of the sum of squares of Y predicted by the selected latent variables, estimated by cross-validation.
ANOVA testing of cross-validated predictive residuals.
The intercept between real and random models, degree of overfit.
The OPLS-DA model discriminating between meat and nonmeat consumers had a high quality based on R2Y and Q2 values >0.5 (Table 4), which was confirmed both by permutation tests (Supplemental Figure 1C) and ROC curve (Supplemental Figure 2A). In addition, 91% of the participants were correctly classified according to intervention diet (Table 5). However, only 76% were correctly classified when using test and training sets (Supplemental Table 1, Supplemental Figure 3A) indicating some overfitting of the model.
TABLE 5.
Classification of samples in OPLS-DA models1
| Classification | ||||
|---|---|---|---|---|
| True intake | Meat (n = 38) | Nonmeat (n = 67) | Vegan (n = 42) | Nonvegan (n = 76) |
| Meat | 32 (84%) | 6 (16%) | ||
| Nonmeat | 3 (5%) | 64 (95%) | ||
| Vegan | 25 (58%) | 18 (42%) | ||
| Nonvegan | 12 (16%) | 63 (84%) | ||
OPLS-DA, orthogonal projections to latent structures with discriminant analysis.
In contrast, the OPLS-DA model discriminating between vegans and nonvegans displayed R2Y and Q2 values <0.3 that together with the permutation tests (Supplemental Figure 1D), ROC curve (Supplemental Figure 2B), and the fraction of correctly classified samples (Table 5) indicated a less robust model. The correct classification of samples was only 75% in the vegan compared with nonvegan model (Figure 4A, B, Table 5), and only 41% in the test and training sets. The vegan model improved slightly when built on women's data only (Table 4, Figure 4D). The prediction for female vegans to be correctly classified was 92% (2 misclassifications) and for nonvegans 96% (2 misclassifications) (data not shown), but the model quality (permutation test and ROC curve) was not improved (Supplemental Figure 1F, Supplemental Figure 2D).
FIGURE 4.
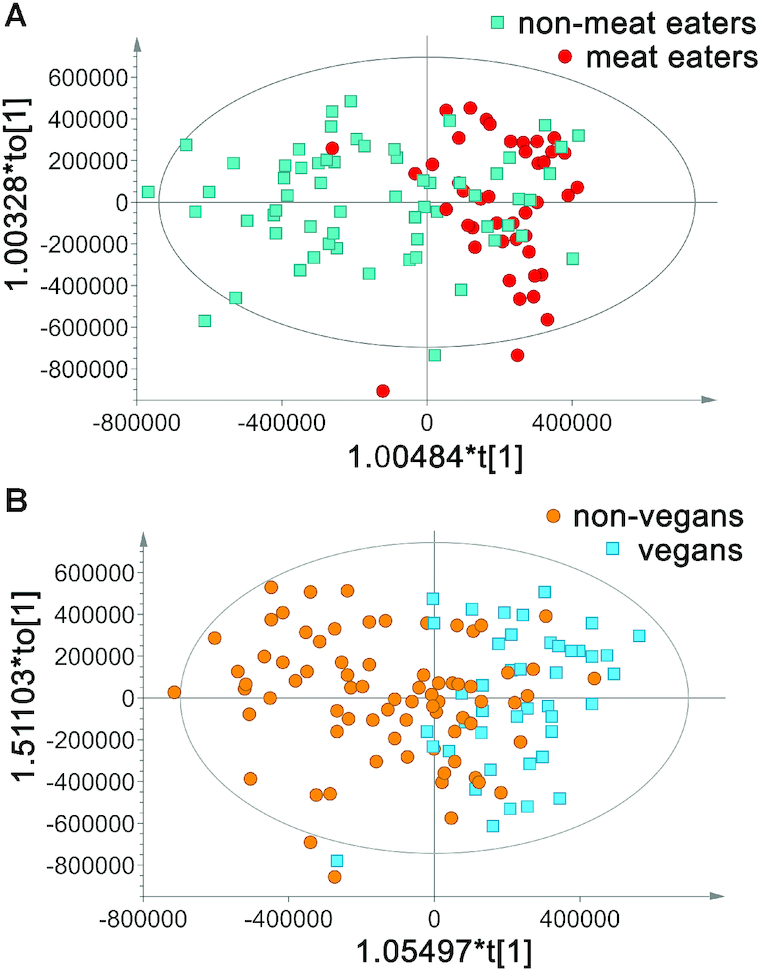
(A) Meat compared with nonmeat consumers in orthogonal projections to latent structures with discriminant analysis (OPLS-DA) models, n = 105 (38/67). (B) Vegan compared with nonvegan (omnivores, vegetarians, vegetarians adding fish) consumers in OPLS-DA models, n = 118 (42/76). The horizontal component of the OPLS-DA score scatter plot captures variation between the groups and the vertical dimension captures variation within the groups.
Most of the selected discriminant metabolites in the 2 main models (meat compared with nonmeat and vegan compared with nonvegan) were identical (Table 6). In addition, variables including dimethylamine, citrate, and creatinine discriminated also in the OPLS-DA model separating sex. Meat consumers had higher urine concentrations of creatinine, glycine, mannitol, urea, and o-phosphocholine/sn-glycero-3-phosphocholine (from hereon called phosphocholine) than nonmeat consumers, and these differences remained significant also after adjustment for age, sex, and BMI. However, the significance remained only for creatinine, urea, and phosphocholine after adjustment for protein intake (modeled as energy percentage, E%), indicating that the protein intake had an important influence on citrate, dimethylamine, glycine, and mannitol. In contrast, all metabolites except mannitol remained significant after adjustment for fiber intake. Figure 5 shows individual relative concentrations of variables including urea, phosphocholine, and mannitol. The purpose of the figure is to illustrate the distribution of these metabolite concentrations within the dietary groups. All participants with a mannitol concentration larger than the second SD (Figure 5C) had reported consumption of mushrooms or celeriac during the last 4 d. Figure 5C shows that some omnivores had high mannitol concentrations, indicating that this is not a general marker for vegetarian diets.
TABLE 6.
Differences in urine metabolites between meat compared with nonmeat eaters, and vegans compared with nonvegans1
| 1H chemical shift region3 | Meat vs. nonmeat | Vegan vs. nonvegan | Women vs. men | Kruskal–Wallis ANOVA5 | Significance Dunn post hoc test | |||||||||||||
|---|---|---|---|---|---|---|---|---|---|---|---|---|---|---|---|---|---|---|
| All n = 105 (38/67) | ♀ n = 68 (23/45) | All n = 118 (42/76) | ♀ n = 75 (25/50) | n = 118 (75/43) | ||||||||||||||
| Metabolite2 | M | NM | P 4 | M | NM | P 4 | NV | V | P 4 | NV | V | P 4 | Women | Men | P 4 | |||
| Citrate | 2.5378 | ↓ | ↑ | 0.01810 | ↓ | ↑ | 0.00210 | ↓ | ↑ | 0.013 | ↓ | ↑ | 0.005 | ↑ | ↓ | 0.00110 | 0.083 | |
| Creatinine | 3.0423 | ↑ | ↓ | <0.0017, 9, 10 | ↑ | ↓ | 0.0409 | ↑ | ↓ | 0.038 | 0.406 | ↓ | ↑ | <0.0017, 9, 10 | 0.002 | Omni vs. vegan and veg | ||
| Dimethylamine + citrate | 2.6895 | ↓ | ↑ | 0.00210 | ↓ | ↑ | <0.0017, 10 | ↓ | ↑ | 0.025 | ↓ | ↑ | 0.004 | ↑ | ↓ | 0.00510 | 0.016 | Omni vs. vegan |
| Glycine | 3.5607 | ↓ | ↑ | <0.0017, 10 | ↓ | ↑ | 0.00210 | ↓ | ↑ | 0.00610 | 0.086 | 0.756 | 0.001 | Omni vs. vegan and veg | ||||
| Hippurate | 7.8141 | 0.670 | 0.368 | 0.617 | ↓ | ↑ | 0.181 | ↑ | ↓ | 0.027 | 0.961 | |||||||
| Mannitol | 3.8633 | ↓ | ↑ | <0.0017 | ↓ | ↑ | 0.002 | ↓ | ↑ | 0.0378 | ↓ | ↑ | 0.096 | 0.786 | 0.006 | Omni vs. vegan and veg | ||
| Urea | 5.7733 | ↑ | ↓ | <0.0017, 9, 10 | ↑ | ↓ | <0.0017, 9, 10 | ↑ | ↓ | <0.0017, 9, 10 | ↑ | ↓ | <0.0017, 9, 10 | 0.422 | <0.001 | Omni vs. all | ||
| o-Phosphocholine or sn-glycero-3-phosphocholine6 | 3.2301 | ↑ | ↓ | 0.0007, 9, 10 | ↑ | ↓ | 0.0039 | ↑ | ↓ | 0.008 | ↑ | ↓ | 0.1708 | ↓ | ↑ | 0.011 | <0.001 | Omni vs. vegan and veg |
M, “meat” = omnivores; NM, “nonmeat” = vegans and vegetarians; NV, “nonvegans” = omnivores, vegetarians, and vegetarians + fish.
Discriminating metabolites that have a loading score w > ±0.1 and are among top 20 variable importance scores.
Chemical shift region for the peak used for t tests.
P for Mann–Whitney U-test is presented for all discriminating metabolites.
Kruskal–Wallis ANOVA between omnivores, vegetarians + fish, vegetarians, and vegans, with Dunn post hoc test.
Uncertain identification.
Significant Mann–Whitney U-test after Bonferroni correction (P < 0.0005).
Nonsignificant (P > 0.05) in a logistic regression model (nonnormal distributed variables were log-transformed prior to analysis) after adjustment for age, gender, and BMI.
Significant (P < 0.05) in a logistic regression model (nonnormal distributed variables were log-transformed prior to analysis) after adjustment for registered energy percentage of protein intake.
Significant (P < 0.05) in a logistic regression model (nonnormal distributed variables were log-transformed prior to analysis ) after adjustment for registered energy percentage of fiber intake.
FIGURE 5.
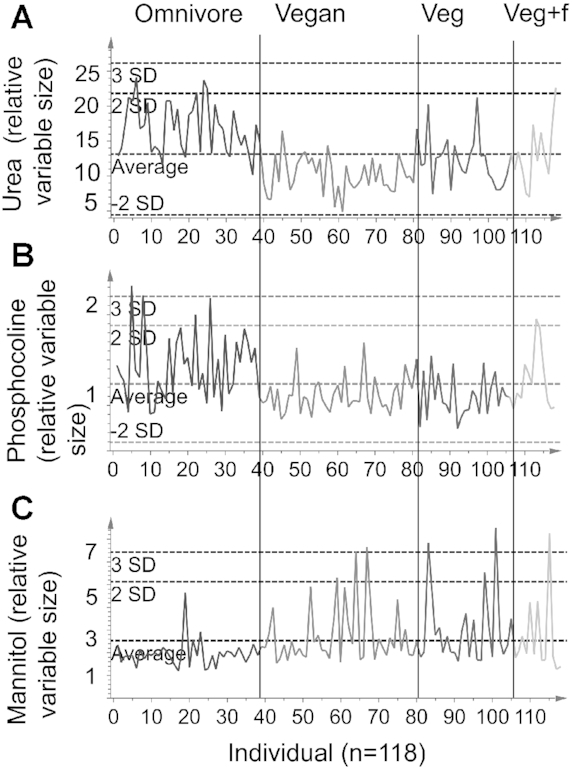
Individual variables for (A) urea, (B) phosphocholine (variable including both o-phosphocholine and sn-glycero-3-phosphocholine), and (C) mannitol. The x-axis shows all individuals (1–118) organized from left to right in the order omnivore, vegan, vegetarian (veg), and vegetarian + fish (veg + f). The y-axis shows the relative variable size that reflects the concentration of the metabolite.
Discussion
Our results demonstrate that 1H-NMR metabolomics of urine could differentiate patterns of metabolites in meat and nonmeat consumers, but not necessarily between vegans and nonvegans. Large differences existed between the habitual dietary groups in reported intake of both macro- and micronutrients. Our findings suggest that protein intake influences several of the metabolites in urine samples that discriminate between meat and nonmeat consumers.
Using OPLS-DA models to discriminate between diets, meat or nonmeat consumers were correctly classified by 91% and the cumulative explained variation (R2X) was 45.2%, using patterns of metabolites in urine, and this is similar to our previous results in serum (97%) and where the cumulative explained variation (R2X) was 41.1% in this study population (16). However, the model discriminating between vegans and nonvegans showed low predictive ability and classified merely 75% correctly and the explained variation (R2X) was 23.5%, in contrast to 92% for the corresponding model on serum metabolites and where the cumulative explained variation (R2X) was 36.5%. Our results thus demonstrate that the ability to correctly classify habitual consumption of meat and other foods of animal origin is weaker for urine than for serum (16). We suggest that the separation in serum, more than urine, reflects the overall metabolic effect from the diet rather than specific dietary markers. Furthermore, sex had less influence on urine metabolites compared with serum, indicating that urine and serum metabolomics can complement each other.
The joint combination of urine metabolites from the different diets (i.e., the metabolic fingerprint in OPLS-DA models) constitutes the main results. However, to verify the models’ biological plausibility the metabolites with the strongest influence on the models will be discussed in the following section. Meat consumers had a higher creatinine concentration in urine than nonmeat consumers. The same divergence in concentration of creatinine was also found in serum in the same study population (16). In urine, creatinine reflects both muscle mass and dietary sources, which primarily include meat and fish (22, 23).
In addition, meat consumers had the highest urea concentration and vegans the lowest, which was expected because urea is the degradation product of amino acids, thus reflecting protein intake. For both meat compared with nonmeat and vegan compared with nonvegan models, urea constituted the highest contribution and this was true also after adjustment for protein intake. However, it is unknown whether different protein sources influence urea concentrations. It should be noted that because urea is present in high concentrations in urine, differences in concentrations of urea between groups will have a large impact on the models, when using Pareto scaling.
Further, meat consumers had a higher phosphocholine concentration than nonmeat consumers, and this is consistent with foods from animal sources having higher content than foods from vegetable origin, with the highest content being in liver, eggs, beef, fish, pork, and chicken (24).
Nonmeat consumers had a higher concentration of citrate and a variable including both citrate and dimethylamine. Citrate concentration in urine is interesting, because reduced concentrations are related to the formation of uric acid stones (25). A high animal protein intake is related to reduced concentrations, which is consistent with our results (25).
Nonmeat consumers also had a higher mannitol concentration in urine. Mannitol is not an endogenous molecule and dietary sources for mannitol are few; only celery, cauliflower, and mushrooms have a mannitol content ≥1.5 g/100 g (26). Pumpkin, snow peas, sweet potato, horseradish (wasabi), asparagus, lima beans, and peach have also been found to contain mannitol, but in the lower range of 0.1–1.2 g/100 g (26). In addition, the absorption of dietary mannitol is only 17–25%, and it is excreted in urine because it is hardly metabolized in tissues (27, 28). Although vegetarians and vegans generally consume more plant-based foods, some of which are rich in mannitol, mannitol alone is not a good marker for vegetable intake in general, which is shown in Figure 5C. However, several metabolites corresponding to our results, such as mannitol, glycine, dimethylamine, and citrate (a derivate of citric acid), have been shown to reflect low protein intake regardless of source (29).
Hippurate and citrate were found to be higher in women than men, although not significantly so after adjustment for protein (E%) intake, whereas creatinine showed the opposite pattern. These findings are consistent with previous research (30–32).
The differences in reported macro- and micronutrient intake between the dietary groups were remarkable, although in line with previous findings where vegans reported a better macronutrient composition, but low micronutrient intake (4, 33, 34). Although the overall macronutrient composition according to the Nordic recommendations of 2012 (21) was better among vegans as a group, it should be pointed out that ∼30% of vegans and vegetarians reported an intake of protein less than LI, that is, an inadequate intake. Unfortunately this might not receive attention when reporting data on a group level. Also, the intake of some nutrients was far from the average requirement in all or several groups. However, 95% of the vegans and many of the other participants took supplements regularly; this was confirmed for vitamin B-12 status, which was deemed adequate for most participants (16). In addition, hemoglobin status did not differ between the groups. Folate intake was higher among vegans (16), which confirms a higher intake of vegetarian foods, thus resulting in a higher fiber intake. In addition, 4-d dietary records do not always capture nutrients like vitamin D because its food sources, such as fish, are not consumed daily. It is possible to consume a vegetarian diet with sufficient intake of all nutrients, but our results show that many vegetarians and vegans do not eat such a diet. The addition of fish to a vegetarian diet seems to improve the intake of vitamin D, riboflavin, phosphorus, and selenium.
Several weaknesses of our study should be noted. First, men and women were not evenly distributed between the groups, which is of concern because concentrations of many metabolites differ by sex. To test for this, we analyzed data from women (the larger group) separately. In addition, P values for metabolites driving the separation in the OPLS-DA models were adjusted for age, sex, and BMI in a logistic regression analysis (Table 6). Second, omnivores reported a higher level of physical activity (although not significantly) than the other groups and physical activity also influences the metabolome (35, 36). Third, the study population consisted mainly of young and healthy individuals with a high level of physical activity, which might limit the generalizability.
Even so, our study has several important strengths. Study staff handled fasting urine samples strictly according to the protocol, resulting in high-quality 1H-NMR measurements. It has been shown that spot and cumulative urine samples can replace 24-h urine collections for measuring metabolites that reflect dietary exposure (37). Our subjective dietary data included both an FFQ and a 4-d weighed food diary, that is, the gold standard in nutritional assessment. This aided us in interpreting the urine data.
To conclude, 1H-NMR urine metabolomics can be an objective tool to identify and predict habitual intake among meat consumers or nonmeat consumers, in healthy individuals. Metabolite patterns that reflected intake of meat and other products of animal origin were identified. Most of the discriminating metabolites were associated with differences in protein intake, indicating that 1H-NMR metabolomics might be better at capturing intake of foods rich in animal proteins than in different plant foods. However, a difference in protein intake between meat and nonmeat consumers might be unavoidable and could be regarded as a concomitant outcome rather than a confounder. Metabolic patterns described here should be confirmed in dose–response studies and intervention studies, controlling for individual factors, macronutrient intake, especially proteins, and protein source that potentially influence metabolite concentrations.
Supplementary Material
Acknowledgments
We thank Sofia Isaksson for recruiting volunteers and collecting samples and data, Anders Pedersen for the NMR analysis and for annotations, and Daniel Malmodin for preprocessing of measurements.
The authors’ responsibilities were as follows—HML, AW, LE, MR: designed the research; MR: conducted the research; TT, LJ: processed the dietary data; HML: analyzed the data, performed statistical analysis, and wrote the paper in collaboration with AW, LE, and MR; and all authors: read and approved the final manuscript.
Notes
This work was supported by the Swedish Research Council grants nos. 521-2011-2664 and 2016-01216.
Author disclosures: The authors report no conflicts of interest.
The data cannot be shared publicly because of Swedish law. Data described in the manuscript, code book, and analytic code will be made available from the corresponding author on reasonable request.
Supplemental Figures 1–3 and Supplemental Table 1 are available from the “Supplementary data” link in the online posting of the article and from the same link in the online table of contents at https://academic.oup.com/jn/.
Abbreviations used: BMR, basal metabolic rate; CV-ANOVA, cross-validation analysis of variance; E%, energy percentage; FIL, food intake level; LI, lowest recommended intake; OPLS, orthogonal projections to latent structures; OPLS-DA, orthogonal projections to latent structures with discriminant analysis; PCA, principal component analysis; ROC, receiver operating characteristic; TSP, trimethylsilyl propionate.
Contributor Information
Helen M Lindqvist, Department of Internal Medicine and Clinical Nutrition, Institute of Medicine, Sahlgrenska Academy, University of Gothenburg, Gothenburg, Sweden.
Millie Rådjursöga, Swedish NMR Centre, University of Gothenburg, Gothenburg, Sweden.
Terese Torstensson, Department of Internal Medicine and Clinical Nutrition, Institute of Medicine, Sahlgrenska Academy, University of Gothenburg, Gothenburg, Sweden.
Linda Jansson, Department of Internal Medicine and Clinical Nutrition, Institute of Medicine, Sahlgrenska Academy, University of Gothenburg, Gothenburg, Sweden.
Lars Ellegård, Clinical Nutrition Unit, Department of Gastroenterology, Sahlgrenska University Hospital, Gothenburg, Sweden.
Anna Winkvist, Department of Internal Medicine and Clinical Nutrition, Institute of Medicine, Sahlgrenska Academy, University of Gothenburg, Gothenburg, Sweden.
References
- 1. Dinu M, Abbate R, Gensini GF, Casini A, Sofi F. Vegetarian, vegan diets and multiple health outcomes: a systematic review with meta-analysis of observational studies. Crit Rev Food Sci Nutr. 2017;57(17):3640–9. [DOI] [PubMed] [Google Scholar]
- 2. Picasso MC, Lo-Tayraco JA, Ramos-Villanueva JM, Pasupuleti V, Hernandez AV. Effect of vegetarian diets on the presentation of metabolic syndrome or its components: a systematic review and meta-analysis. Clin Nutr. 2019;38(3):1117–32. [DOI] [PubMed] [Google Scholar]
- 3. Viguiliouk E, Kendall CW, Kahleova H, Rahelic D, Salas-Salvado J, Choo VL, Mejia SB, Stewart SE, Leiter LA, Jenkins DJ et al.. Effect of vegetarian dietary patterns on cardiometabolic risk factors in diabetes: a systematic review and meta-analysis of randomized controlled trials. Clin Nutr. 2019;38(3):1133–45. [DOI] [PubMed] [Google Scholar]
- 4. Kristensen NB, Madsen ML, Hansen TH, Allin KH, Hoppe C, Fagt S, Lausten MS, Gobel RJ, Vestergaard H, Hansen T et al.. Intake of macro- and micronutrients in Danish vegans. Nutr J. 2015;14:115. [DOI] [PMC free article] [PubMed] [Google Scholar]
- 5. Davey GK, Spencer EA, Appleby PN, Allen NE, Knox KH, Key TJ. EPIC-Oxford: lifestyle characteristics and nutrient intakes in a cohort of 33 883 meat-eaters and 31 546 non meat-eaters in the UK. Public Health Nutr. 2003;6(3):259–69. [DOI] [PubMed] [Google Scholar]
- 6. Clarys P, Deliens T, Huybrechts I, Deriemaeker P, Vanaelst B, De Keyzer W, Hebbelinck M, Mullie P. Comparison of nutritional quality of the vegan, vegetarian, semi-vegetarian, pesco-vegetarian and omnivorous diet. Nutrients. 2014;6(3):1318–32. [DOI] [PMC free article] [PubMed] [Google Scholar]
- 7. Bruinsma J, editor. World Agriculture: Towards 2015/2030. An FAO Perspective. London: Earthscan Publications Ltd; 2003. [Google Scholar]
- 8. Willett W, Rockstrom J, Loken B, Springmann M, Lang T, Vermeulen S, Garnett T, Tilman D, DeClerck F, Wood A et al.. Food in the Anthropocene: the EAT-Lancet Commission on healthy diets from sustainable food systems. Lancet. 2019;393(10170):447–92. [DOI] [PubMed] [Google Scholar]
- 9. Craig WJ. Health effects of vegan diets. Am J Clin Nutr. 2009;89(5):1627S–33S. [DOI] [PubMed] [Google Scholar]
- 10. Guasch-Ferre M, Bhupathiraju SN, Hu FB. Use of metabolomics in improving assessment of dietary intake. Clin Chem. 2018;64(1):82–98. [DOI] [PMC free article] [PubMed] [Google Scholar]
- 11. Schmidt JA, Rinaldi S, Ferrari P, Carayol M, Achaintre D, Scalbert A, Cross AJ, Gunter MJ, Fensom GK, Appleby PN et al.. Metabolic profiles of male meat eaters, fish eaters, vegetarians, and vegans from the EPIC-Oxford cohort. Am J Clin Nutr. 2015;102(6):1518–26. [DOI] [PMC free article] [PubMed] [Google Scholar]
- 12. Stella C, Beckwith-Hall B, Cloarec O, Holmes E, Lindon JC, Powell J, van der Ouderaa F, Bingham S, Cross AJ, Nicholson JK. Susceptibility of human metabolic phenotypes to dietary modulation. J Proteome Res. 2006;5(10):2780–8. [DOI] [PubMed] [Google Scholar]
- 13. O'Sullivan A, Gibney MJ, Brennan L. Dietary intake patterns are reflected in metabolomic profiles: potential role in dietary assessment studies. Am J Clin Nutr. 2011;93(2):314–21. [DOI] [PubMed] [Google Scholar]
- 14. Garcia-Perez I, Posma JM, Gibson R, Chambers ES, Hansen TH, Vestergaard H, Hansen T, Beckmann M, Pedersen O, Elliott P et al.. Objective assessment of dietary patterns by use of metabolic phenotyping: a randomised, controlled, crossover trial. Lancet Diabetes Endocrinol. 2017;5(3):184–95. [DOI] [PMC free article] [PubMed] [Google Scholar]
- 15. Xu J, Yang S, Cai S, Dong J, Li X, Chen Z. Identification of biochemical changes in lactovegetarian urine using 1H NMR spectroscopy and pattern recognition. Anal Bioanal Chem. 2010;396(4):1451–63. [DOI] [PubMed] [Google Scholar]
- 16. Lindqvist HM, Radjursoga M, Malmodin D, Winkvist A, Ellegard L. Serum metabolite profiles of habitual diet: evaluation by 1H-nuclear magnetic resonance analysis. Am J Clin Nutr. 2019;110(1):53–62. [DOI] [PMC free article] [PubMed] [Google Scholar]
- 17. Blaise BJ, Correia G, Tin A, Young JH, Vergnaud AC, Lewis M, Pearce JT, Elliott P, Nicholson JK, Holmes E et al.. Power analysis and sample size determination in metabolic phenotyping. Anal Chem. 2016;88(10):5179–88. [DOI] [PubMed] [Google Scholar]
- 18. Dieterle F, Ross A, Schlotterbeck G, Senn H. Probabilistic quotient normalization as robust method to account for dilution of complex biological mixtures. Application in 1H NMR metabonomics. Anal Chem. 2006;78(13):4281–90. [DOI] [PubMed] [Google Scholar]
- 19. Wishart DS, Jewison T, Guo AC, Wilson M, Knox C, Liu Y, Djoumbou Y, Mandal R, Aziat F, Dong E et al.. HMDB 3.0–the Human Metabolome Database in 2013. Nucleic Acids Res. 2013;41(Database issue):D801–7. [DOI] [PMC free article] [PubMed] [Google Scholar]
- 20. Cloarec O, Dumas ME, Craig A, Barton RH, Trygg J, Hudson J, Blancher C, Gauguier D, Lindon JC, Holmes E et al.. Statistical total correlation spectroscopy: an exploratory approach for latent biomarker identification from metabolic 1H NMR data sets. Anal Chem. 2005;77(5):1282–9. [DOI] [PubMed] [Google Scholar]
- 21. NNR Working Group. Nordic Nutrition Recommendations 2012. Integrating Nutrition and Physical Activity. 5th ed Copenhagen: Nordic Council of Ministers; 2014. [Google Scholar]
- 22. Heymsfield S. Human Body Composition. 2nd ed Champaign (IL): Human Kinetics; 2005. [Google Scholar]
- 23. Brosnan JT, da Silva RP, Brosnan ME. The metabolic burden of creatine synthesis. Amino Acids. 2011;40(5):1325–31. [DOI] [PubMed] [Google Scholar]
- 24. Wiedeman AM, Barr SI, Green TJ, Xu Z, Innis SM, Kitts DD. Dietary choline intake: current state of knowledge across the life cycle. Nutrients. 2018;10(10):1513. [DOI] [PMC free article] [PubMed] [Google Scholar]
- 25. Ferraro PM, Mandel EI, Curhan GC, Gambaro G, Taylor EN. Dietary protein and potassium, diet-dependent net acid load, and risk of incident kidney stones. Clin J Am Soc Nephrol. 2016;11(10):1834–44. [DOI] [PMC free article] [PubMed] [Google Scholar]
- 26. Yao CK, Tan HL, van Langenberg DR, Barrett JS, Rose R, Liels K, Gibson PR, Muir JG. Dietary sorbitol and mannitol: food content and distinct absorption patterns between healthy individuals and patients with irritable bowel syndrome. J Hum Nutr Diet. 2014;27(Suppl 2):263–75. [DOI] [PubMed] [Google Scholar]
- 27. Nasrallah MS, Iber LF. Mannitol absorption and metabolism in man. Am J Med Sci. 1969;258(2):80–8. [DOI] [PubMed] [Google Scholar]
- 28. Livesey G. Health potential of polyols as sugar replacers, with emphasis on low glycaemic properties. Nutr Res Rev. 2003;16(2):163–91. [DOI] [PubMed] [Google Scholar]
- 29. Rasmussen LG, Winning H, Savorani F, Toft H, Larsen TM, Dragsted LO, Astrup A, Engelsen SB. Assessment of the effect of high or low protein diet on the human urine metabolome as measured by NMR. Nutrients. 2012;4(2):112–31. [DOI] [PMC free article] [PubMed] [Google Scholar]
- 30. Kochhar S, Jacobs DM, Ramadan Z, Berruex F, Fuerholz A, Fay LB. Probing gender-specific metabolism differences in humans by nuclear magnetic resonance-based metabonomics. Anal Biochem. 2006;352(2):274–81. [DOI] [PubMed] [Google Scholar]
- 31. Siqueira ME, Paiva MJ. Hippuric acid in urine: reference values. Rev Saude Publica. 2002;36(6):723–7. [DOI] [PubMed] [Google Scholar]
- 32. Krumsiek J, Mittelstrass K, Do KT, Stuckler F, Ried J, Adamski J, Peters A, Illig T, Kronenberg F, Friedrich N et al.. Gender-specific pathway differences in the human serum metabolome. Metabolomics. 2015;11(6):1815–33. [DOI] [PMC free article] [PubMed] [Google Scholar]
- 33. Elorinne AL, Alfthan G, Erlund I, Kivimaki H, Paju A, Salminen I, Turpeinen U, Voutilainen S, Laakso J. Food and nutrient intake and nutritional status of Finnish vegans and non-vegetarians. PLoS One. 2016;11(2):e0148235. [DOI] [PMC free article] [PubMed] [Google Scholar]
- 34. Haddad EH, Berk LS, Kettering JD, Hubbard RW, Peters WR. Dietary intake and biochemical, hematologic, and immune status of vegans compared with nonvegetarians. Am J Clin Nutr. 1999;70(3 Suppl):586S–93S. [DOI] [PubMed] [Google Scholar]
- 35. Xiao Q, Moore SC, Keadle SK, Xiang YB, Zheng W, Peters TM, Leitzmann MF, Ji BT, Sampson JN, Shu XO et al.. Objectively measured physical activity and plasma metabolomics in the Shanghai Physical Activity Study. Int J Epidemiol. 2016;45(5):1433–44. [DOI] [PMC free article] [PubMed] [Google Scholar]
- 36. Chorell E, Svensson MB, Moritz T, Antti H. Physical fitness level is reflected by alterations in the human plasma metabolome. Mol Biosyst. 2012;8(4):1187–96. [DOI] [PubMed] [Google Scholar]
- 37. Wilson T, Garcia-Perez I, Posma JM, Lloyd AJ, Chambers ES, Tailliart K, Zubair H, Beckmann M, Mathers JC, Holmes E et al.. Spot and cumulative urine samples are suitable replacements for 24-hour urine collections for objective measures of dietary exposure in adults using metabolite biomarkers. J Nutr. 2019;149:1692–1700. [DOI] [PubMed] [Google Scholar]
Associated Data
This section collects any data citations, data availability statements, or supplementary materials included in this article.