

ABSTRACT
Background
Vitamin D is critical to embryonic neuronal differentiation and other developmental processes that may affect future neurocognitive function. However, observational studies have found inconsistent associations between gestational vitamin D and neurocognitive outcomes.
Objectives
We examined the association of gestational 25-hydroxyvitamin D [25(OH)D] with children's IQ at 4–6 y, and explored whether associations differed by race.
Methods
This study used data from the CANDLE (Conditions Affecting Neurocognitive Development and Learning in Early Childhood) cohort. Between 2006 and 2011, CANDLE recruited 1503 women in their second trimester of healthy singleton pregnancies. Inclusion criteria for this analysis were gestation of ≥34 wk and availability of 25(OH)D and IQ data. Associations between second-trimester 25(OH)D plasma concentration and Stanford-Binet IQ scores in offspring at 4–6 y were examined using multivariable linear regression; interaction terms were used to explore possible effect modification by race.
Results
Mean ± SD 25(OH)D concentration among 1019 eligible dyads was 21.6 ± 8.4 ng/mL, measured at a mean ± SD gestational age of 23.0 ± 3.0 wk. Vitamin D deficiency [25(OH)D < 20 ng/mL] was observed in 45.6%. Maternal 25(OH)D differed by race with a mean ± SD of 19.8 ± 7.2 ng/mL in Blacks sand 25.9 ± 9.3 ng/mL in Whites ( P < 0.001). In adjusted models a 10-ng/mL increase in 25(OH)D was associated with a 1.17-point higher Full Scale IQ (95% CI: 0.27, 2.06 points), a 1.17-point higher Verbal IQ (95% CI: 0.19, 2.15 points), and a 1.03-point higher Nonverbal IQ (95% CI: 0.10, 1.95 points). We observed no evidence of effect modification by race.
Conclusions
Second-trimester maternal 25(OH)D was positively associated with IQ at 4–6 y, suggesting that gestational vitamin D status may be an important predictor of neurocognitive development. These findings may help inform prenatal nutrition recommendations and may be especially relevant for Black and other dark-skinned women at high risk of vitamin D deficiency.
Keywords: vitamin D, 25-hydroxyvitamin D, neurodevelopment, IQ, prenatal nutrition
Introduction
Vitamin D deficiency is a worldwide problem affecting the general public and women of childbearing age (1, 2), especially among those with darker skin (3). Observational studies have linked low perinatal and prenatal vitamin D to developmental brain disorders including schizophrenia and autism (4–6), and some (7–9) but not all (10–13) cohort studies have found positive associations between gestational vitamin D and childhood IQ. During gestation vitamin D influences the expression of genes that regulate the production, migration, and differentiation of neuronal structures, setting the foundation for many aspects of future neurocognitive development (14–16).
The vitamin D receptor (VDR) is expressed in the mammalian brain as early as 12 d into gestation (17) and VDRs are found throughout brain matter (18). Maternal vitamin D is transported through the placenta (19), and by binding to VDR in the fetal brain, it exerts transcriptional control over many genes related to structural brain development (20). Vitamin D influences embryonic neuronal differentiation (21, 22), regulates neurotransmitter concentrations (23–25), and plays a role in regulating neuronal calcium, reactive oxygen species, and neurotrophic factors (26). Therefore, gestational vitamin D status may have important implications for neurocognitive development in offspring.
Cutaneous synthesis is a major source of vitamin D for many individuals, because the modern diet has few rich sources of vitamin D. Cutaneous synthesis is reduced in Blacks and others with pigmented skin due to the absorption of UV radiation by melanin (3), making these populations especially vulnerable to deficiency. Vitamin D deficiency in the general population is defined by the Institute of Medicine (IOM) as 25-hydroxyvitamin D [25(OH)D] concentrations <20 ng/mL, and is based on bone health (27). Desirable concentrations in pregnant women have yet to be established and may differ from those in the general public (28). Nationally representative data from 2001–2006 indicated that 13% of White pregnant women in the United States had 25(OH)D concentrations <20 ng/mL compared with 80% of pregnant Black women (2). Thus, the potential consequences of gestational vitamin D deficiency may disproportionately affect children of Black women.
We previously reported that maternal 25(OH)D status during pregnancy was associated with receptive language in offspring at age 2 y in a majority Black cohort, the CANDLE (Conditions Affecting Neurocognitive Development and Learning in Early Childhood) study (29). Whether or not this association persists beyond age 2 y in this population with high vulnerability to vitamin D deficiency has not yet been explored. The aim of this study was to examine the hypothesis that maternal 25(OH)D during pregnancy is associated with neurocognitive development through 4–6 y of age.
Methods
Study design and population
The CANDLE study, which has been described in detail previously (30), was designed to examine biological and environmental influences on early childhood neurocognitive development. CANDLE is a prospective pregnancy cohort study in Shelby County, Tennessee, that recruited pregnant women between December 2006 and July 2011. Women were eligible for participation if they were between 16 and 28 weeks of gestation, had a singleton low-risk pregnancy, resided in Shelby County, and planned to deliver at one of the 5 participating health care settings in the county. The CANDLE study conducted 2 clinic visits during pregnancy, 1 at labor and delivery, annual visits after birth, frequent phone visits, and 2 home visits during early childhood.
Mother–child dyads in the CANDLE study were excluded from this analysis if mothers delivered earlier than 34 weeks of gestation (n = 34), if data were unavailable for second-trimester 25(OH)D plasma concentration (n = 26), or if children did not have complete and valid IQ testing at the age 4–6 y visit (n = 448).
Maternal measures
At baseline clinic visits conducted during the second trimester, research staff collected maternal demographic information. Women self-reported their race and ethnicity, household income, educational attainment, and marital status. Self-reported health insurance status was collapsed to a binary variable, coded as either public (Medicare, Medicaid, or TennCare) or private/other (employer, union, private, military, or other source). Women also reported whether they had used alcohol or tobacco during this pregnancy and responses were coded as binary. Prepregnancy BMI was calculated from women's self-reported weight and height (in kg/m2). Research staff administered the Block 2005 FFQ, a validated 111-item questionnaire used to estimate usual dietary intake over the preceding 3 mo (31). FFQ data were used to estimate diet quality using the Healthy Eating Index (HEI) 2010, a measure with a maximum score of 100 that assesses conformance with US dietary guidance (32). Maternal IQ was assessed using the Wechsler Abbreviated Scale of Intelligence (33).
Venous blood was collected from mothers during baseline visits at 16–28 weeks of gestation. Blood samples were transported on ice, centrifuged at 4°C, divided into aliquots, and frozen at −20°C within 6 h of collection. Plasma concentrations of 25(OH)D, the most reliable marker of vitamin D status (34), were measured using a commercial enzymatic immunoassay kit (Immunodiagnostic Systems) according to the manufacturer's instructions. Assays were performed at the University of Tennessee Health Science Center in a laboratory that participates in the College of American Pathology Quality Assessment Program for 25(OH)D assays. National Institute of Standards and Technology SRM972 Vitamin D was used for quality assurance of 25(OH)D. The minimum detection range of the assay was 2 ng/mL. The interassay variability was <6% for the laboratory assay controls, and precision was within 1 SD of the mean vitamin D concentration.
Child IQ assessment
Child IQ was measured at the age 4–6 y study visit using the Stanford-Binet Intelligence Scales, Fifth Edition (SB5) (35). The SB5 was normed and standardized using a diverse sample of 4800 individuals in the United States (36, 37) and has been extensively tested for reliability and validity (38, 39). The SB5 is composed of 10 subtests, 5 of which are verbal and 5 nonverbal. The 5 verbal subtests yield a Verbal IQ (VIQ) and the 5 nonverbal subtests yield a Nonverbal IQ (NVIQ). The VIQ and NVIQ are then combined to yield a composite score, Full Scale IQ (FSIQ), with a mean of 100 and an SD of 15. FSIQ was examined as the primary outcome in this study; VIQ and NVIQ were examined as secondary outcomes.
Data analysis
All data analysis was conducted using SAS version 9.4 (SAS Institute). Descriptive statistics were calculated to characterize the study sample overall and by vitamin D status defined using the IOM deficiency cutoff of 20 ng/mL (27).
Associations of maternal vitamin D status with IQ outcomes were examined through multivariable linear regression with robust SEs using maximum likelihood type robust estimates as introduced by Huber (40). All model covariates were chosen a priori based on existing evidence with no reliance on statistical significance. Minimally adjusted models included the child's sex and age (continuous) at the time of the age 4–6 y assessment as covariates. The fully adjusted models also included the following suspected confounders and precision variables: HEI 2010 score (41, 42) (continuous), insurance status (43, 44) (public, private/other), maternal IQ (43, 45) (continuous), maternal education (44, 45) (less than high school, high school diploma, technical school, college degree, graduate or professional degree), maternal age (46) (continuous), marital status (44, 45) (cohabitation, single), prepregnancy BMI (47, 48) (continuous), tobacco use during pregnancy (49, 50) (yes, no), alcohol use during pregnancy (51, 52) (yes, no), race (53–55) (Black, White, other/multiple races), mother's parity (45) (continuous), and annual household income adjusted for the number of children and adults supported by the income (43, 44, 56) (continuous). Because of differences in vitamin D metabolism between Blacks and Whites (57, 58) we examined the possibility of effect modification by race using additional models that included an interaction term between race and 25(OH)D concentration. These interaction models excluded the small portion of women who identified as multiple/other races (6.5%) in order to specifically examine the implications of differing vitamin D metabolism between Black and White women.
Complete data for the covariates used in the fully adjusted regression models were available for 88% of the eligible sample. Missingness of each covariate was <1% except for HEI score, which was missing among 11% of eligible participants. Covariate data were assumed to be missing at random, and were multiply imputed by fully conditional specification, a validated method ideal for imputation in large epidemiologic data sets consisting of variables on differing scales and with complex relations (59). The discriminant function was used to impute variables with binary or nominal responses, whereas the regression method was used for continuous variables. Imputed data sets (n = 10) were used to conduct regression analyses and data were pooled to generate inferential statistics.
Supplemental analyses were conducted to examine potential nonlinearity in dose-response between 25(OH)D concentration and IQ. We explored the association of vitamin D status as a binary variable [25(OH)D < 20 ng/mL compared with ≥20 ng/mL] with IQ scores in our fully adjusted regression models. In addition, to allow a more flexible fit to the data, we created fully adjusted regression models applying a natural cubic spline effect to the 25(OH)D variable.
Results
Participant characteristics
Mean age of mothers at the time of enrollment was 26 y and most (63.2%) identified as Black (Table 1). Over half (59.3%) were insured through Medicaid or Medicare and 32% had earned a college degree or above at the time of enrollment. Approximately two-thirds (67.1%) had an adjusted annual income of <$22,000. Mean ± SD age of children at the time of IQ assessment was 4.4 ± 0.6 y (minimum: 3.8 y; 5th percentile: 4.0 y; 95th percentile: 5.4 y; maximum: 8.0 y). Participants who were enrolled in CANDLE but excluded from this analysis were generally similar in sociodemographic characteristics to those included in the analysis (Supplemental Table 1).
TABLE 1.
Characteristics of the study population, overall and with stratification by plasma 25(OH)D status1
| Second-trimester maternal 25(OH)D status | |||
|---|---|---|---|
| Overall | <20 ng/mL | ≥20 ng/mL | |
| n | 1019 | 465 | 554 |
| Maternal age, y | 26.4 ± 5.6 | 25.4 ± 5.4 | 27.3 ± 5.6 |
| Maternal race | |||
| Black | 644 (63.2) | 348 (74.8) | 296 (53.4) |
| White | 309 (30.3) | 77 (16.6) | 232 (41.9) |
| Other or multiple races | 66 (6.5) | 40 (8.6) | 26 (4.7) |
| Maternal education2 | |||
| Less than high school diploma | 119 (11.7) | 81 (17.5) | 38 (6.9) |
| High school diploma or GED | 477 (46.9) | 238 (51.2) | 239 (43.1) |
| Technical school | 96 (9.4) | 48 (10.3) | 48 (8.7) |
| College degree | 206 (20.2) | 63 (13.6) | 143 (25.8) |
| Graduate/professional degree | 120 (11.8) | 34 (7.3) | 86 (15.5) |
| Maternal IQ2,3 | |||
| <85 | 278 (27.6) | 174 (37.9) | 104 (18.9) |
| 85 to <100 | 327 (32.4) | 160 (34.9) | 167 (30.4) |
| 100 to <115 | 270 (26.8) | 89 (19.4) | 181 (32.9) |
| ≥115 | 134 (13.3) | 36 (7.8) | 98 (17.8) |
| Prepregnancy BMI status2,4 | |||
| Underweight | 48 (4.7) | 23 (5.0) | 25 (4.5) |
| Normal weight | 384 (37.8) | 147 (31.8) | 237 (42.8) |
| Overweight | 245 (24.1) | 117 (25.3) | 128 (23.1) |
| Obese | 339 (33.4) | 175 (37.9) | 164 (29.6) |
| Maternal marital status2 | |||
| Cohabitation | 570 (55.9) | 212 (45.6) | 358 (64.6) |
| Single | 448 (44.0) | 252 (54.2) | 196 (35.4) |
| Health insurance status | |||
| Public | 604 (59.3) | 340 (73.1) | 264 (47.7) |
| Private/other | 415 (40.7) | 125 (26.9) | 290 (52.4) |
| Adjusted household income,2 $ | |||
| <10k | 438 (43.1) | 273 (59.1) | 165 (29.8) |
| 10k to <16k | 136 (13.4) | 57 (12.3) | 79 (14.3) |
| 16k to <22k | 108 (10.6) | 38 (8.2) | 70 (12.6) |
| 22k to <40k | 188 (18.5) | 59 (12.8) | 129 (23.3) |
| ≥40k | 146 (14.4) | 35 (7.6) | 111 (20.0) |
| Prenatal alcohol use (yes)2 | 88 (8.6) | 30 (6.5) | 58 (10.5) |
| Prenatal tobacco use (yes)2 | 93 (9.1) | 48 (10.3) | 45 (8.1) |
| Maternal 25(OH)D, ng/mL | 21.6 ± 8.4 | 14.4 ± 3.1 | 27.6 ± 6.4 |
| Maternal 25(OH)D status | |||
| <20 ng/mL | 465 (45.6) | 465 (100) | — |
| 20 to <30 ng/mL | 413 (40.5) | — | 413 (74.6) |
| ≥30 ng/mL | 141 (13.8) | — | 141 (25.5) |
| Maternal HEI 2010 score2 | 60.2 ± 11.3 | 57.7 ± 11.1 | 62.0 ± 11.1 |
| Child age at assessment, y | 4.4 ± 0.6 | 4.5 ± 0.6 | 4.3 ± 0.5 |
| Child sex | |||
| Male | 504 (49.5) | 226 (48.6) | 278 (50.2) |
| Female | 515 (50.5) | 239 (51.4) | 276 (49.8) |
| Child IQ3 | |||
| Full Scale IQ | 100.0 ± 14.9 | 96.0 ± 14.5 | 103.3 ± 14.5 |
| Verbal IQ | 99.3 ± 15.2 | 95.5 ± 14.8 | 102.4 ± 14.8 |
| Nonverbal IQ | 101.1 ± 14.7 | 97.3 ± 14.3 | 104.3 ± 14.4 |
Values are mean ± SDs or n (%). HEI, Healthy Eating Index; 25(OH)D, 25-hydroxyvitamin D.
Maternal education, marital status, alcohol use, and tobacco use were missing for 1 participant each; prepregnancy BMI (in kg/m2) and adjusted household income were missing for 3 participants each; maternal IQ was missing for 10 participants; HEI score was missing for 112 participants; percentages were calculated after excluding missing cases from the denominator.
Maternal IQ was assessed using the Wechsler Abbreviated Scale of Intelligence; child IQ was assessed using the Stanford-Binet Intelligence Scales, Fifth Edition.
BMI status was classified using CDC guidelines: BMI < 18.5 was considered underweight; BMI ≥ 18.5 and <25 was considered normal weight; BMI ≥ 25 and <30 was considered overweight; BMI ≥ 30 was considered obese.
Mean ± SD maternal 25(OH)D was 21.6 ± 8.4 ng/mL and nearly half (45.6%) of participants had 25(OH)D concentrations < 20 ng/mL. Compared with women with lower 25(OH)D, those with concentrations ≥20 ng/mL were more likely to experience socioeconomic advantages including higher educational attainment, greater income, and higher diet quality. Mean ± SD 25(OH)D concentration was higher in White women (25.9 ± 9.3 ng/mL) than in Black women (19.8 ± 7.2 ng/mL) (P < 0.001).
Modeling of gestational 25(OH)D and IQ scores
In multivariable linear regression models adjusted for child sex and age, plasma 25(OH)D was significantly and positively associated with FSIQ, VIQ, and NVIQ (Figure 1). After additional adjustment for socioeconomic and demographic factors, a 10-ng/mL increase in 25(OH)D was associated with a 1.17-point (95% CI: 0.27, 2.06 points) greater FSIQ, 1.17-point (95% CI: 0.19, 2.15 points) greater VIQ, and 1.03-point (95% CI: 0.10, 1.95 points) greater NVIQ. Interaction terms used to examine potential effect modification by race were nonsignificant (P-interaction: FSIQ: 0.22; VIQ: 0.42; NVIQ: 0.12) (Table 2).
FIGURE 1.
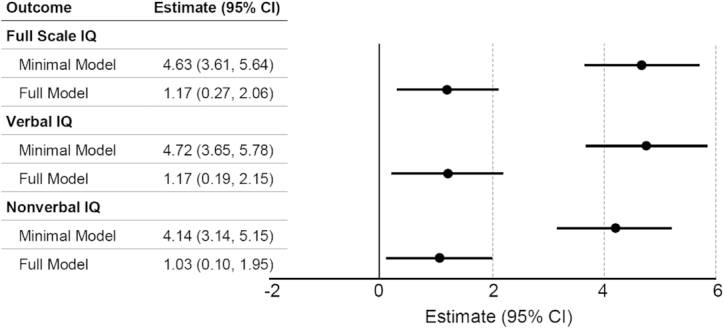
Estimated difference in offspring Stanford-Binet Intelligence Scales, Fifth Edition IQ per 10-ng/mL increase in maternal plasma 25-hydroxyvitamin D. The minimal model adjusted for child sex (male, female) and child age at year 4 assessment (continuous). The full model adjusted for the covariates in the minimal model plus prepregnancy BMI (continuous), race (Black, White, other/multiple races), mother's IQ (continuous), mother's education (less than high school, high school diploma, technical school, college degree, graduate/professional degree), marital status (cohabitation, single), previous pregnancies to term (continuous), health insurance (public, private/other), alcohol use (yes, no), tobacco use (yes, no), mother's age at baseline (continuous), Healthy Eating Index 2010 score (continuous), and income (continuous).
TABLE 2.
Estimated regression coefficients (95% CIs) for association of maternal plasma 25(OH)D concentration and IQ at 4–6 y with interaction of race and 25(OH)D1
| Outcome | |||
|---|---|---|---|
| Model term | Full Scale IQ | Verbal IQ | Nonverbal IQ |
| Maternal 25(OH)D (ng/mL) × race (Black)2 | 0.11 (−0.07, 0.29) | 0.08 (−0.12, 0.28) | 0.15 (−0.04, 0.33) |
| Maternal 25(OH)D, ng/mL | 0.06 (−0.07, 0.20) | 0.08 (−0.07, 0.23) | 0.03 (−0.11, 0.17) |
| Maternal race, Black | −6.22 (−11.09, −1.37) | −5.74 (−11.04, −0.44) | −6.11 (−11.14, −1.09) |
| Maternal age, y | 0.23 (0.04, 0.43) | 0.15 (−0.07, 0.36) | 0.24 (0.04, 0.44) |
| Maternal education | |||
| Less than high school diploma | −2.18 (−6.30, 1.94) | −2.82 (−7.32, 1.67) | −1.93 (−6.19, 2.32) |
| High school diploma or GED | −0.33 (−3.52, 2.86) | −2.00 (−5.49, 1.48) | 0.75 (−2.55, 4.05) |
| Technical school | 1.80 (−1.80, 5.39) | −0.17 (−4.09, 3.75) | 2.60 (−1.11, 6.31) |
| College degree | 0.71 (−1.98, 3.41) | −0.90 (−3.84, 2.04) | 2.03 (−0.76, 4.82) |
| Graduate/professional degree | — | — | — |
| Maternal IQ | 0.19 (0.12, 0.26) | 0.18 (0.10, 0.26) | 0.18 (0.11, 0.25) |
| Prepregnancy BMI, kg/m2 | −0.09 (−0.19, 0.00) | −0.09 (−0.19, 0.01) | −0.09 (−0.18, 0.01) |
| Maternal marital status (single) | −0.39 (−2.16, 1.37) | 0.18 (−1.75, 2.11) | −1.04 (−2.87, 0.79) |
| Health insurance (public) | −0.51 (−2.68, 1.65) | −0.64 (−3.01, 1.72) | −0.41 (−2.65, 1.83) |
| Adjusted household income (in thousands of dollars) | 0.04 (0.00, 0.12) | 0.07 (0.00, 0.10) | 0.02 (−0.10, 0.10) |
| Prenatal alcohol use (no) | −2.07 (−4.63, 0.47) | −2.21 (−4.99, 0.57) | −1.56 (−4.20, 1.07) |
| Prenatal tobacco use (no) | 2.65 (0.07, 5.23) | 2.95 (0.13, 5.76) | 2.46 (−0.21, 5.13) |
| Parity | −1.59 (−2.30, −0.87) | −1.47 (−2.26, −0.69) | −1.50 (−2.25, −0.76) |
| Maternal HEI 2010 score | 0.07 (−0.01, 0.14) | 0.07 (−0.01, 0.16) | 0.05 (−0.03, 0.14) |
| Child age at assessment, y | −1.06 (−2.42, 0.30) | −0.96 (−2.45, 0.53) | −0.94 (−2.35, 0.47) |
| Child sex (male) | −3.69 (−5.10, −2.28) | −4.55 (−6.09, −3.01) | −2.86 (−4.32, −1.41) |
| Intercept | 84.80 (71.65, 97.95) | 86.47 (72.13, 100.82) | 85.07 (71.46, 98.68) |
Interaction models were created using data from participants identified as either White or Black (n = 953). HEI, Healthy Eating Index; 25(OH)D, 25-hydroxyvitamin D.
Interaction coefficients represent the estimated difference in the slope of the relation between 25(OH)D (ng/mL) and IQ predicted for Blacks compared with Whites.
When we examined vitamin D as a binary variable in fully adjusted models, having 25(OH)D concentrations ≥20 ng/mL was associated with a 2.23-point (95% CI: 0.76, 3.70 points) greater FSIQ, 1.65-point (95% CI: 0.04, 3.25 points) greater VIQ, and 2.61-point (95% CI: 1.10, 4.12 points) greater NVIQ than predicted for those with 25(OH)D deficiency (<20 ng/mL). A natural cubic spline used to visualize the bivariate association of 25(OH)D with FSIQ suggested no marked departures from linearity through 25(OH)D concentrations of ∼40 ng/mL, a range that encompassed the observed 25(OH)D values of 992 (97%) of the 1019 mothers (Figure 2). In fully adjusted regression models, the natural cubic spline effect added to the 25(OH)D variable (knots at 22.0, 37.5, and 52.9 ng/mL) did not meaningfully improve model fit. Residual plots from models both with and without spline effects exhibited homoscedasticity without detectable outliers or patterns.
FIGURE 2.

Natural cubic spline regression of maternal plasma 25(OH)D concentration and offspring Full Scale IQ. 25(OH)D, 25-hydroxyvitamin D.
Discussion
We observed that maternal 25(OH)D during pregnancy is positively associated with children's FSIQ, VIQ, and NVIQ at age 4–6 y. We previously reported that maternal 25(OH)D was positively associated with receptive language development at 2 y in CANDLE, as assessed using the Bayley Scales of Infant and Toddler Development, Third Edition (BSID-III) (29). This analysis suggests that an association between gestational 25(OH)D and neurocognitive development may persist through age 4–6 y. Associations between 25(OH)D concentrations and offspring IQ were similar between races. Because of the high risk of vitamin D deficiency in Black women due to skin melanin content, the implications of these findings may be especially relevant to this population.
The observed effect size of 1.17-point greater FSIQ per 10-ng/mL 25(OH)D may translate meaningfully to other positive future outcomes. It has been estimated that for each IQ point decrement, males experience a 1.93% decrease in lifetime earnings and females experience a 3.23% decrease (60). In addition, a meta-analysis revealed that a 1-SD advantage in cognitive test scores was associated with a 24% lower risk of death during 17–69 y of follow-up (61).
Our findings are consistent with results from several other prospective cohorts around the world. In rural Vietnam, infants born to mothers with 25(OH)D < 15 ng/mL had significantly lower BSID-III developmental language scores at 6 mo of age than those born to mothers with sufficient 25(OH)D (defined as ≥30 ng/mL) (9). Gestational 25(OH)D was also associated with greater BSID-III mental and psychomotor development scores at 14 mo in a Spanish cohort (8). Similarly, among Caucasian women in an Australian cohort gestational 25(OH)D was inversely associated with language impairment at ages 5 and 10 y (7). In 2 other predominantly Caucasian cohorts from Australia and Denmark, neonatal and cord blood 25(OH)D concentrations, which correlate with maternal 25(OH)D (62, 63), were positively associated with language development at 18 mo and 4 y (64), and with IQ at 19 y (65).
Results of other studies, however, have not fully confirmed an association. In a cohort in Greece, maternal vitamin D was not associated with cognitive function at age 4 y, but was negatively associated with behavioral difficulties, hyperactivity/inattention, and externalizing behavior (66). Another cohort in England found that gestational vitamin D was not significantly associated with IQ at age 8 y, but was positively associated with motor and social development in children <4 y old (67). Other observational studies detected no association between gestational 25(OH)D and children's neurodevelopmental outcomes (10–13, 68, 69).
Differences in findings between studies may be related to several factors including differences in the vitamin D status of participants. Nearly half of the mothers in CANDLE were classified as deficient in 25(OH)D (<20 ng/mL), which is likely related to the predominance of Black participants. In contrast, several studies that did not detect significant associations were comprised of populations in which deficiency was relatively uncommon (67, 69) or not observed at all (10). In addition, whereas we separately examined 25(OH)D as a continuous and a binary variable, others have considered vitamin D only as a categorical exposure (12, 66, 67, 70). Our categorical and continuous modeling approaches both revealed positive associations between 25(OH)D and IQ. However, it is possible that use of certain categorization schemas may obscure a true relationship, particularly in cohorts with little variation in vitamin D concentrations or those with few cases of vitamin D deficiency.
Findings from observational studies may also differ because of the timing of vitamin D assessment during pregnancy. This study and multiple others have found that first- (66, 71) or second-trimester (7, 8, 29) maternal vitamin D was significantly and positively associated with neurocognitive outcomes, but only 1 (64) of several studies (4, 10, 64, 68) that examined vitamin D at delivery found a significant relationship. These observations may suggest that a critical window exists early in gestation, yet experimental data from animals have suggested a critical window in late pregnancy (72). Further study is needed to clarify these potential critical periods.
Animal studies support the biological plausibility of our findings, demonstrating that gestational vitamin D deficiency can alter brain morphology in offspring (73, 74) and disrupt normal regulation of the cell cycle and apoptosis in the developing brain (75). Experimental studies also indicate that vitamin D deficiency may impair the synthesis of neurotrophic factors and reduce the expression of neurotrophic receptors (73, 76, 77). Deficiency may affect genes related to speech and language development (74) and lead to disturbed brain function in adult offspring (72, 78). Localization studies in humans have shown that 1α-hydroxylase, the enzyme responsible for formation of active vitamin D, is present throughout the cytoplasm of neurons and glial cells (79), suggesting that the human brain metabolizes vitamin D locally and that vitamin D may have similar roles in the human brain to those observed in animal studies.
Our findings highlight the importance of assessing 25(OH)D status in pregnant women and addressing deficiencies. This study and others (80) have called attention to the high prevalence of vitamin D deficiency among Black women, which is thought to be largely related to reduced cutaneous synthesis of 25(OH)D (81). Vitamin D supplementation may be indicated for women who have poor dietary intake of vitamin D and/or reduced cutaneous synthesis related to skin pigmentation, geographic setting, or lifestyle factors affecting sun exposure. Popular prenatal supplements, which typically contain 400–600 IU vitamin D, are likely insufficient to correct 25(OH)D deficiencies. Randomized controlled trials have suggested that daily supplementation of 800 (82) to 1000 IU (83) may be needed for repletion in pregnancy, and that doses as high as 4000 IU may be ideal in cases of severe deficiency (84). Importantly, there is currently no established consensus regarding optimal 25(OH)D concentrations during pregnancy, and additional research in diverse populations is needed to develop guidelines, which may need to be population-specific, for treating deficiency during pregnancy.
Primary strengths of this study include its large size and racial diversity. CANDLE includes large numbers of White and Black mothers, which allowed for the exploration of potential effect modification by race. Mothers in this study all resided in 1 county, which reduced potential confounding by geographic variation in sunlight exposure, a critical factor in cutaneous vitamin D synthesis. This study also has limitations. This study did not examine genetic makeup, but future studies should consider several known single-nucleotide polymorphisms in vitamin D pathway genes (85) that may modify an association between gestational vitamin D and cognitive outcomes.
In conclusion, gestational vitamin D concentrations were positively associated with IQ at age 4–6 y, suggesting that vitamin D plays an important role in programming neurocognitive development. Vitamin D status may therefore be an important modifiable factor during pregnancy that can be optimized through appropriate nutritional recommendations and guidance. Vitamin D deficiency was especially prevalent among Black women in this cohort, suggesting a heightened need for screening and nutritional intervention in this vulnerable population. Future studies examining vitamin D status throughout pregnancy should be conducted to elucidate potential critical windows during gestation.
Supplementary Material
Acknowledgments
The authors’ responsibilities were as follows—MMM, CTL, SS, and FAT: designed the research; MMM: performed statistical analysis and wrote the paper; LEM, JCG, KJD, KZL, NRB, DAE, CTL, MK, SS, and FAT: critically reviewed and edited the manuscript; and all authors: read and approved the final manuscript.
Notes
ECHO PATHWAYS is funded by NIH grants 1UG3OD023271-01 (to SS) and 4UH3OD023271-03 (to SS). The Conditions Affecting Neurocognitive Development and Learning in Early Childhood (CANDLE) study was funded by the Urban Child Institute (to FAT) and NIH grant R01 HL109977 (to FAT).
Author disclosures: The authors report no conflicts of interest.
Supplemental Table 1 is available from the “Supplementary data” link in the online posting of the article and from the same link in the online table of contents at https://academic.oup.com/jn/.
Abbreviations used: BSID-III, Bayley Scales of Infant and Toddler Development, Third Edition; CANDLE, Conditions Affecting Neurocognitive Development and Learning in Early Childhood; FSIQ, full scale IQ; HEI, Healthy Eating Index; IOM, Institute of Medicine; NVIQ, nonverbal IQ; SB5, Stanford-Binet Intelligence Scales, Fifth Edition; VDR, vitamin D receptor; VIQ, verbal IQ; 25(OH)D, 25-hydroxyvitamin D.
Contributor Information
Melissa M Melough, Department of Child Health, Behavior, and Development, Seattle Children's Research Institute, Seattle, WA, USA.
Laura E Murphy, Department of Psychiatry, University of Tennessee Health Science Center, Memphis, TN, USA; Boling Center for Developmental Disabilities, University of Tennessee Health Science Center, Memphis, TN, USA.
J Carolyn Graff, Boling Center for Developmental Disabilities, University of Tennessee Health Science Center, Memphis, TN, USA; College of Nursing, University of Tennessee Health Science Center, Memphis, TN, USA.
Karen J Derefinko, Department of Preventive Medicine, University of Tennessee Health Science Center, Memphis, TN, USA.
Kaja Z LeWinn, Weill Institute for Neurosciences, Department of Psychiatry and Behavioral Sciences, University of California San Francisco, San Francisco, CA, USA.
Nicole R Bush, Weill Institute for Neurosciences, Department of Psychiatry and Behavioral Sciences, University of California San Francisco, San Francisco, CA, USA.
Daniel A Enquobahrie, Department of Epidemiology, University of Washington School of Public Health, Seattle, WA, USA.
Christine T Loftus, Department of Environmental and Occupational Health Sciences, University of Washington, Seattle, WA, USA.
Mehmet Kocak, Department of Preventive Medicine, University of Tennessee Health Science Center, Memphis, TN, USA.
Sheela Sathyanarayana, Department of Child Health, Behavior, and Development, Seattle Children's Research Institute, Seattle, WA, USA; Department of Environmental and Occupational Health Sciences, University of Washington, Seattle, WA, USA; Department of Pediatrics, University of Washington, Seattle, WA, USA.
Frances A Tylavsky, Department of Preventive Medicine, University of Tennessee Health Science Center, Memphis, TN, USA.
References
- 1. Holick MF. The vitamin D deficiency pandemic: approaches for diagnosis, treatment and prevention. Rev Endocr Metab Disord. 2017;18:153–65. [DOI] [PubMed] [Google Scholar]
- 2. Ginde AA, Sullivan AF, Mansbach JM, Camargo CA. Vitamin D insufficiency in pregnant and nonpregnant women of childbearing age in the United States. Am J Obstet Gynecol. 2010;202:436.e1–8. [DOI] [PMC free article] [PubMed] [Google Scholar]
- 3. Webb AR, Kazantzidis A, Kift RC, Farrar MD, Wilkinson J, Rhodes LE. Colour counts: sunlight and skin type as drivers of vitamin D deficiency at UK latitudes. Nutrients. 2018;10:457. [DOI] [PMC free article] [PubMed] [Google Scholar]
- 4. Wu D-M, Wen X, Han X-R, Wang S, Wang Y-J, Shen M, Fan S-H, Zhuang J, Li M-Q, Hu B et al. Relationship between neonatal vitamin D at birth and risk of autism spectrum disorders: the NBSIB study. J Bone Miner Res. 2018;33:458–66. [DOI] [PubMed] [Google Scholar]
- 5. McGrath J, Eyles D, Mowry B, Yolken R, Buka S. Low maternal vitamin D as a risk factor for schizophrenia: a pilot study using banked sera. Schizophr Res. 2003;63:73–8. [DOI] [PubMed] [Google Scholar]
- 6. Grant WB, Soles CM. Epidemiologic evidence for supporting the role of maternal vitamin D deficiency as a risk factor for the development of infantile autism. Dermatoendocrinol. 2009;1:223–8. [DOI] [PMC free article] [PubMed] [Google Scholar]
- 7. Whitehouse AJO, Holt BJ, Serralha M, Holt PG, Kusel MMH, Hart PH. Maternal serum vitamin D levels during pregnancy and offspring neurocognitive development. Pediatrics. 2012;129:485–93. [DOI] [PubMed] [Google Scholar]
- 8. Morales E, Guxens M, Llop S, Rodríguez-Bernal CL, Tardón A, Riaño I, Ibarluzea J, Lertxundi N, Espada M, Rodriguez A et al. Circulating 25-hydroxyvitamin D3 in pregnancy and infant neuropsychological development. Pediatrics. 2012;130:e913–20. [DOI] [PubMed] [Google Scholar]
- 9. Hanieh S, Ha TT, Simpson JA, Thuy TT, Khuong NC, Thoang DD, Tran TD, Tuan T, Fisher J, Biggs B-A. Maternal vitamin D status and infant outcomes in rural Vietnam: a prospective cohort study. PLoS One. 2014;9:e99005. [DOI] [PMC free article] [PubMed] [Google Scholar]
- 10. Laird E, Thurston SW, van Wijngaarden E, Shamlaye CF, Myers GJ, Davidson PW, Watson GE, McSorley EM, Mulhern MS, Yeates AJ et al. Maternal vitamin D status and the relationship with neonatal anthropometric and childhood neurodevelopmental outcomes: results from the Seychelles Child Development Nutrition Study. Nutrients. 2017;9:1235. [DOI] [PMC free article] [PubMed] [Google Scholar]
- 11. McCarthy EK, Murray DM, Malvisi L, Kenny LC, O'B Hourihane J, Irvine AD, Kiely ME. Antenatal vitamin D status is not associated with standard neurodevelopmental assessments at age 5 years in a well-characterized prospective maternal-infant cohort. J Nutr. 2018;148:1580–6. [DOI] [PubMed] [Google Scholar]
- 12. Gale CR, Robinson SM, Harvey NC, Javaid MK, Jiang B, Martyn CN, Godfrey KM, Cooper C. Maternal vitamin D status during pregnancy and child outcomes. Eur J Clin Nutr. 2008;62:68–77. [DOI] [PMC free article] [PubMed] [Google Scholar]
- 13. Veena SR, Krishnaveni GV, Srinivasan K, Thajna KP, Hegde BG, Gale CR, Fall CHD. Association between maternal vitamin D status during pregnancy and offspring cognitive function during childhood and adolescence. Asia Pac J Clin Nutr. 2017;26:438–49. [DOI] [PMC free article] [PubMed] [Google Scholar]
- 14. Tau GZ, Peterson BS. Normal development of brain circuits. Neuropsychopharmacol. 2010;35:147–68. [DOI] [PMC free article] [PubMed] [Google Scholar]
- 15. Buss C, Entringer S, Swanson JM, Wadhwa PD. The role of stress in brain development: the gestational environment's long-term effects on the brain. Cerebrum. 2012(Mar–Apr):4. [PMC free article] [PubMed] [Google Scholar]
- 16. Stiles J, Jernigan TL. The basics of brain development. Neuropsychol Rev. 2010;20:327–48. [DOI] [PMC free article] [PubMed] [Google Scholar]
- 17. Kesby JP, Eyles DW, Burne THJ, McGrath JJ. The effects of vitamin D on brain development and adult brain function. Mol Cell Endocrinol. 2011;347:121–7. [DOI] [PubMed] [Google Scholar]
- 18. Pike JW, Meyer MB. The vitamin D receptor: new paradigms for the regulation of gene expression by 1,25-dihydroxyvitamin D3. Rheum Dis Clin North Am. 2012;38:13–27. [DOI] [PMC free article] [PubMed] [Google Scholar]
- 19. Liu NQ, Hewison M. Vitamin D, the placenta and pregnancy. Arch Biochem Biophys. 2012;523:37–47. [DOI] [PubMed] [Google Scholar]
- 20. Harms LR, Burne THJ, Eyles DW, McGrath JJ. Vitamin D and the brain. Best Pract Res Clin Endocrinol Metab. 2011;25:657–69. [DOI] [PubMed] [Google Scholar]
- 21. Cui X, Gooch H, Petty A, McGrath JJ, Eyles D. Vitamin D and the brain: genomic and non-genomic actions. Mol Cell Endocrinol. 2017;453:131–43. [DOI] [PubMed] [Google Scholar]
- 22. Shin JS, Choi MY, Longtine MS, Nelson DM. Vitamin D effects on pregnancy and the placenta. Placenta. 2010;31:1027–34. [DOI] [PMC free article] [PubMed] [Google Scholar]
- 23. Patrick RP, Ames BN. Vitamin D hormone regulates serotonin synthesis. Part 1: relevance for autism. FASEB J. 2014;28:2398–413. [DOI] [PubMed] [Google Scholar]
- 24. Patrick RP, Ames BN. Vitamin D and the omega-3 fatty acids control serotonin synthesis and action. Part 2: relevance for ADHD, bipolar disorder, schizophrenia, and impulsive behavior. FASEB J. 2015;29:2207–22. [DOI] [PubMed] [Google Scholar]
- 25. Jiang P, Zhang L-H, Cai H-L, Li H-D, Liu Y-P, Tang M-M, Dang R-L, Zhu W-Y, Xue Y, He X. Neurochemical effects of chronic administration of calcitriol in rats. Nutrients. 2014;6:6048–59. [DOI] [PMC free article] [PubMed] [Google Scholar]
- 26. Eyles D, Burne T, McGrath J. Vitamin D in fetal brain development. Semin Cell Dev Biol. 2011;22:629–36. [DOI] [PubMed] [Google Scholar]
- 27. Institute of Medicine. Dietary Reference Intakes for calcium and vitamin D. Washington (DC): The National Academies Press; 2011. [PubMed] [Google Scholar]
- 28. El-Hajj Fuleihan G, Bouillon R, Clarke B, Chakhtoura M, Cooper C, McClung M, Singh RJ. Serum 25-hydroxyvitamin D levels: variability, knowledge gaps, and the concept of a desirable range. J Bone Miner Res. 2015;30:1119–33. [DOI] [PubMed] [Google Scholar]
- 29. Tylavsky FA, Kocak M, Murphy LE, Graff JC, Palmer FB, Völgyi E, Diaz-Thomas AM, Ferry RJ. Gestational vitamin 25(OH)D status as a risk factor for receptive language development: a 24-month, longitudinal, observational study. Nutrients. 2015;7:9918–30. [DOI] [PMC free article] [PubMed] [Google Scholar]
- 30. Sontag-Padilla L, Burns R, Shih R, Griffin B, Martin L, Chandra A, Tylavsky F. The Urban Child Institute CANDLE Study: methodological overview and baseline sample description. [Internet]. (Accessed April 1, 2020.)Santa Monica, CA: RAND Corporation; 2015. Available from: http://www.rand.org/pubs/research_reports/RR1336.html. [Google Scholar]
- 31. Block G, Hartman AM, Dresser CM, Carroll MD, Gannon J, Gardner L. A data-based approach to diet questionnaire design and testing. Am J Epidemiol. 1986;124:453–69. [DOI] [PubMed] [Google Scholar]
- 32. Guenther PM, Casavale KO, Kirkpatrick SI, Reedy J, Hiza HAB, Kuczynski KJ, Kahle LL, Krebs-Smith SM. Update of the Healthy Eating Index: HEI-2010. J Acad Nutr Diet. 2013;113:569–80. [DOI] [PMC free article] [PubMed] [Google Scholar]
- 33. Wechsler D. Wechsler Abbreviated Scale of Intelligence. San Antonio, TX: The Psychological Corporation; 1999. [Google Scholar]
- 34. von Websky K, Hasan AA, Reichetzeder C, Tsuprykov O, Hocher B. Impact of vitamin D on pregnancy-related disorders and on offspring outcome. J Steroid Biochem Mol Biol. 2018;180:51–64. [DOI] [PubMed] [Google Scholar]
- 35. Roid GH. Stanford-Binet Intelligence Scales. 5th ed Rolling Meadows, IL: Riverside Publishing; 2003. [Google Scholar]
- 36. Bain SK, Allin JD. Test review: Stanford-Binet Intelligence Scales, Fifth Edition. J Psychoeduc Assess. 2005;23:87–95. [Google Scholar]
- 37. Janzen HL, Obrzut JE, Marusiak CW. Test review: Stanford-Binet Intelligence Scales, Fifth Edition (SB:V). Can J Sch Psychol. 2004;19:235–44. [Google Scholar]
- 38. Murphy LE, Taylor CD, Floyd RG. Concurrent and predictive relationships between the Bayley-III and the Stanford-Binet 5. Perspect Early Child Psychol Educ. 2019;4:71–104. [Google Scholar]
- 39. Pomplun M, Custer MG. The construct validity of the Stanford-Binet 5 measures of working memory. Assessment. 2005;12:338–46. [DOI] [PubMed] [Google Scholar]
- 40. Huber PJ. Robust regression: asymptotics, conjectures and Monte Carlo. Ann Stat. 1973;1:799–821. [Google Scholar]
- 41. Freitas-Vilela AA, Pearson RM, Emmett P, Heron J, Smith A, Emond A, Hibbeln JR, Castro MBT, Kac G. Maternal dietary patterns during pregnancy and intelligence quotients in the offspring at 8 years of age: findings from the ALSPAC cohort. Matern Child Nutr. 2018;14:e12431. [DOI] [PMC free article] [PubMed] [Google Scholar]
- 42. Peltner J, Thiele S. Association between the Healthy Eating Index-2010 and nutrient and energy densities of German households’ food purchases. Eur J Public Health. 2017;27:547–52. [DOI] [PubMed] [Google Scholar]
- 43. Ronfani L, Vecchi Brumatti L, Mariuz M, Tognin V, Bin M, Ferluga V, Knowles A, Montico M, Barbone F. The complex interaction between home environment, socioeconomic status, maternal IQ and early child neurocognitive development: a multivariate analysis of data collected in a newborn cohort study. PLoS One. 2015;10:e0127052. [DOI] [PMC free article] [PubMed] [Google Scholar]
- 44. Hackman DA, Farah MJ. Socioeconomic status and the developing brain. Trends Cogn Sci. 2009;13:65–73. [DOI] [PMC free article] [PubMed] [Google Scholar]
- 45. Eriksen HLF, Kesmodel US, Underbjerg M, Kilburn TR, Bertrand J, Mortensen EL. Predictors of intelligence at the age of 5: family, pregnancy and birth characteristics, postnatal influences, and postnatal growth. PLoS One. 2013;8:e79200. [DOI] [PMC free article] [PubMed] [Google Scholar]
- 46. Goisis A, Schneider DC, Myrskylä M. The reversing association between advanced maternal age and child cognitive ability: evidence from three UK birth cohorts. Int J Epidemiol. 2017;46:850–9. [DOI] [PMC free article] [PubMed] [Google Scholar]
- 47. Lagunova Z, Porojnicu LC, Lindberg F, Hexeberg S, Moan J. The dependency of vitamin D status on body mass index, gender, age and season. Anticancer Res. 2009;29:3713–20. [PubMed] [Google Scholar]
- 48. Tanda R, Salsberry PJ, Reagan PB, Fang MZ. The impact of prepregnancy obesity on children's cognitive test scores. Matern Child Health J. 2013;17:222–9. [DOI] [PMC free article] [PubMed] [Google Scholar]
- 49. Julvez J, Ribas-Fitó N, Torrent M, Forns M, Garcia-Esteban R, Sunyer J. Maternal smoking habits and cognitive development of children at age 4 years in a population-based birth cohort. Int J Epidemiol. 2007;36:825–32. [DOI] [PubMed] [Google Scholar]
- 50. Lange NE, Sparrow D, Vokonas P, Litonjua AA. Vitamin D deficiency, smoking, and lung function in the Normative Aging Study. Am J Respir Crit Care Med. 2012;186:616–21. [DOI] [PMC free article] [PubMed] [Google Scholar]
- 51. Biffen SC, Warton CMR, Lindinger NM, Randall SR, Lewis CE, Molteno CD, Jacobson JL, Jacobson SW, Meintjes EM. Reductions in corpus callosum volume partially mediate effects of prenatal alcohol exposure on IQ. Front Neuroanat. 2018;11:132. [DOI] [PMC free article] [PubMed] [Google Scholar]
- 52. Tardelli VS, do Lago MPP, da Silveira DX, Fidalgo TM. Vitamin D and alcohol: a review of the current literature. Psychiatry Res. 2017;248:83–6. [DOI] [PubMed] [Google Scholar]
- 53. Thomas D. Racial IQ differences among transracial adoptees: fact or artifact?. J Intell. 2017;5:1. [DOI] [PMC free article] [PubMed] [Google Scholar]
- 54. Rushton JP, Jensen AR. Thirty years of research on race differences in cognitive ability. Psychol Public Policy Law. 2005;11:235–94. [Google Scholar]
- 55. Weishaar T, Rajan S, Keller B. Probability of vitamin D deficiency by body weight and race/ethnicity. J Am Board Fam Med. 2016;29:226–32. [DOI] [PubMed] [Google Scholar]
- 56. Burniaux J-M, Dang T-T, Fore DC, Förster MF, Mira D'Ercole M, Oxley H. Income distribution and poverty in selected OECD countries. Paris: Organisation for Economic Co-operation and Development; 1998. [Google Scholar]
- 57. Baca KM, Govil M, Zmuda JM, Simhan HN, Marazita ML, Bodnar LM. Vitamin D metabolic loci and vitamin D status in black and white pregnant women. Eur J Obstet Gynecol Reprod Biol. 2018;220:61–8. [DOI] [PMC free article] [PubMed] [Google Scholar]
- 58. Holick MF. Bioavailability of vitamin D and its metabolites in black and white adults. N Engl J Med. 2013;369:2047–8. [DOI] [PubMed] [Google Scholar]
- 59. Liu Y, De A. Multiple imputation by fully conditional specification for dealing with missing data in a large epidemiologic study. Int J Stat Med Res. 2015;4:287–95. [DOI] [PMC free article] [PubMed] [Google Scholar]
- 60. Griffiths C, McGartland A, Miller M. A comparison of the monetized impact of IQ decrements from mercury emissions. Environ Health Perspect. 2007;115:841–7. [DOI] [PMC free article] [PubMed] [Google Scholar]
- 61. Calvin CM, Deary IJ, Fenton C, Roberts BA, Der G, Leckenby N, Batty GD. Intelligence in youth and all-cause-mortality: systematic review with meta-analysis. Int J Epidemiol. 2011;40:626–44. [DOI] [PMC free article] [PubMed] [Google Scholar]
- 62. Ariyawatkul K, Lersbuasin P. Prevalence of vitamin D deficiency in cord blood of newborns and the association with maternal vitamin D status. Eur J Pediatr. 2018;177:1541–5. [DOI] [PubMed] [Google Scholar]
- 63. Greer FR. 25-Hydroxyvitamin D: functional outcomes in infants and young children. Am J Clin Nutr. 2008;88:529S–33S. [DOI] [PubMed] [Google Scholar]
- 64. Gould JF, Anderson AJ, Yelland LN, Smithers LG, Skeaff CM, Zhou SJ, Gibson RA, Makrides M. Association of cord blood vitamin D with early childhood growth and neurodevelopment. J Paediatr Child Health. 2017;53:75–83. [DOI] [PubMed] [Google Scholar]
- 65. Specht IO, Janbek J, Thorsteinsdottir F, Frederiksen P, Heitmann BL. Neonatal vitamin D levels and cognitive ability in young adulthood. Eur J Nutr. 2020;59:1919–28. [DOI] [PubMed] [Google Scholar]
- 66. Daraki V, Roumeliotaki T, Koutra K, Chalkiadaki G, Katrinaki M, Kyriklaki A, Kampouri M, Margetaki K, Vafeiadi M, Papavasiliou S et al. High maternal vitamin D levels in early pregnancy may protect against behavioral difficulties at preschool age: the Rhea mother–child cohort, Crete, Greece. Eur Child Adolesc Psychiatry. 2018;27:79–88. [DOI] [PubMed] [Google Scholar]
- 67. Darling AL, Rayman MP, Steer CD, Golding J, Lanham-New SA, Bath SC. Association between maternal vitamin D status in pregnancy and neurodevelopmental outcomes in childhood: results from the Avon Longitudinal Study of Parents and Children (ALSPAC). Br J Nutr. 2017;117:1682–92. [DOI] [PMC free article] [PubMed] [Google Scholar]
- 68. Keim SA, Bodnar LM, Klebanoff MA. Maternal and cord blood 25(OH)-vitamin D concentrations in relation to child development and behaviour. Paediatr Perinat Epidemiol. 2014;28:434–44. [DOI] [PMC free article] [PubMed] [Google Scholar]
- 69. Strøm M, Halldorsson TI, Hansen S, Granström C, Maslova E, Petersen SB, Cohen AS, Olsen SF. Vitamin D measured in maternal serum and offspring neurodevelopmental outcomes: a prospective study with long-term follow-up. Ann Nutr Metab. 2014;64:254–61. [DOI] [PubMed] [Google Scholar]
- 70. Wang H, Yu XD, Huang LS, Chen Q, Ouyang FX, Wang X, Zhang J. Fetal vitamin D concentration and growth, adiposity and neurodevelopment during infancy. Eur J Clin Nutr. 2018;72:1396–403. [DOI] [PubMed] [Google Scholar]
- 71. Chawla D, Fuemmeler B, Benjamin-Neelon SE, Hoyo C, Murphy S, Daniels JL. Early prenatal vitamin D concentrations and social-emotional development in infants. J Matern Neonatal Med. 2019;32:1441–8. [DOI] [PMC free article] [PubMed] [Google Scholar]
- 72. O'Loan J, Eyles DW, Kesby J, Ko P, McGrath JJ, Burne THJ. Vitamin D deficiency during various stages of pregnancy in the rat; its impact on development and behaviour in adult offspring. Psychoneuroendocrinology. 2007;32:227–34. [DOI] [PubMed] [Google Scholar]
- 73. Eyles D, Brown J, Mackay-Sim A, McGrath J, Feron F. Vitamin D3 and brain development. Neuroscience. 2003;118:641–53. [DOI] [PubMed] [Google Scholar]
- 74. Hawes JE, Tesic D, Whitehouse AJ, Zosky GR, Smith JT, Wyrwoll CS. Maternal vitamin D deficiency alters fetal brain development in the BALB/c mouse. Behav Brain Res. 2015;286:192–200. [DOI] [PubMed] [Google Scholar]
- 75. Ko P, Burkert R, McGrath J, Eyles D. Maternal vitamin D3 deprivation and the regulation of apoptosis and cell cycle during rat brain development. Dev Brain Res. 2004;153:61–8. [DOI] [PubMed] [Google Scholar]
- 76. Neveu I, Naveilhan P, Jehan F, Baudet C, Wion D, De Luca HF, Brachet P. 1,25-Dihydroxyvitamin D3 regulates the synthesis of nerve growth factor in primary cultures of glial cells. Mol Brain Res. 1994;24:70–6. [DOI] [PubMed] [Google Scholar]
- 77. Harvey L, Burne T, Cui X, Mackay-Sim A, Eyles D, McGrath J. Vitamin D and the brain: a neuropsychiatric perspective. Clinic Rev Bone Miner Metab. 2009;7:199–205. [Google Scholar]
- 78. Al-Harbi AN, Khan KM, Rahman A. Developmental vitamin D deficiency affects spatial learning in Wistar rats. J Nutr. 2017;147:1795–805. [DOI] [PubMed] [Google Scholar]
- 79. Eyles DW, Smith S, Kinobe R, Hewison M, McGrath JJ. Distribution of the vitamin D receptor and 1α-hydroxylase in human brain. J Chem Neuroanat. 2005;29:21–30. [DOI] [PubMed] [Google Scholar]
- 80. Powe CE, Evans MK, Wenger J, Zonderman AB, Berg AH, Nalls M, Tamez H, Zhang D, Bhan I, Karumanchi SA et al. Vitamin D–binding protein and vitamin D status of black Americans and white Americans. N Engl J Med. 2013;369:1991–2000. [DOI] [PMC free article] [PubMed] [Google Scholar]
- 81. Luque-Fernandez MA, Gelaye B, VanderWeele T, Ferre C, Siega-Riz AM, Holzman C, Enquobahrie DA, Dole N, Williams MA. Seasonal variation of 25-hydroxyvitamin-D among non-Hispanic black and white pregnant women from three U.S. pregnancy cohorts. Paediatr Perinat Epidemiol. 2014;28:166–76. [DOI] [PMC free article] [PubMed] [Google Scholar]
- 82. Yu CKH, Sykes L, Sethi M, Teoh TG, Robinson S. Vitamin D deficiency and supplementation during pregnancy. Clin Endocrinol (Oxf). 2009;70:685–90. [DOI] [PubMed] [Google Scholar]
- 83. Grant CC, Stewart AW, Scragg R, Milne T, Rowden J, Ekeroma A, Wall C, Mitchell EA, Crengle S, Trenholme A et al. Vitamin D during pregnancy and infancy and infant serum 25-hydroxyvitamin D concentration. Pediatrics. 2014;133:e143. [DOI] [PubMed] [Google Scholar]
- 84. Dawodu A, Saadi HF, Bekdache G, Javed Y, Altaye M, Hollis BW. Randomized controlled trial (RCT) of vitamin D supplementation in pregnancy in a population with endemic vitamin D deficiency. J Clin Endocrinol Metab. 2013;98:2337–46. [DOI] [PubMed] [Google Scholar]
- 85. McGrath JJ, Saha S, Burne THJ, Eyles DW. A systematic review of the association between common single nucleotide polymorphisms and 25-hydroxyvitamin D concentrations. J Steroid Biochem Mol Biol. 2010;121:471–7. [DOI] [PubMed] [Google Scholar]
Associated Data
This section collects any data citations, data availability statements, or supplementary materials included in this article.